

Forecasting drug utilization and expenditure: ten years of experience in Stockholm
- PMID: 32393238
- PMCID: PMC7212573
- DOI: 10.1186/s12913-020-05170-0
Forecasting drug utilization and expenditure: ten years of experience in Stockholm
Abstract
Background: Operating under constrained budgets, payers and providers globally face challenges in enabling appropriate and sustainable access to new medicines. Among payer initiatives aiming to improve preparedness of healthcare systems for the introduction of new medicines, drug utilization and expenditure forecasting has played an increasingly important role. This study aims to describe the forecasting model used in Region Stockholm and to evaluate the accuracy of the forecasts produced over the past decade.
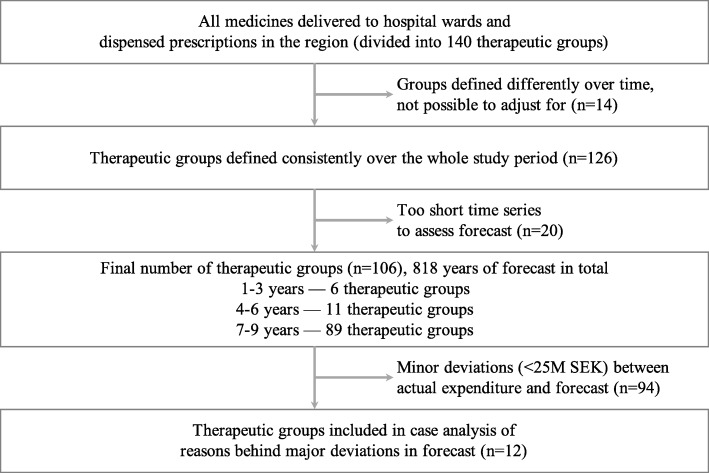
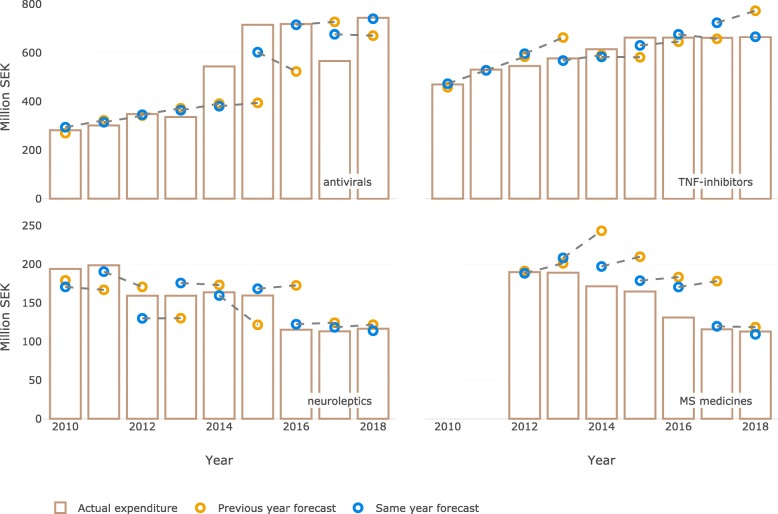
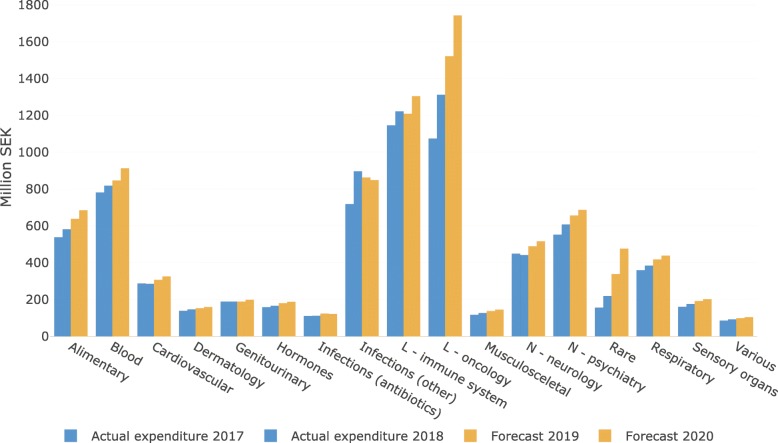
Methods: In this repeated cross-sectional study, we compared the predicted pharmaceutical expenditure with actual expenditure during the entire available follow-up period (2007-2018) both for overall drug utilization and for individual therapeutic groups. All analyses were based on pharmaceutical expenditure data that include medicines used in hospitals and dispensed prescription medicines for all residents of the region.
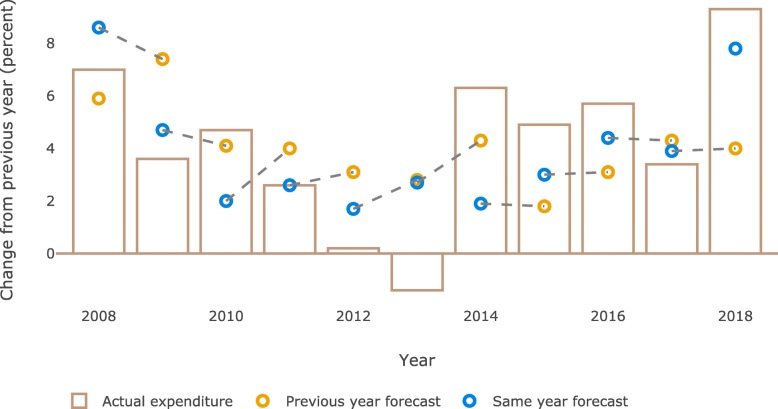
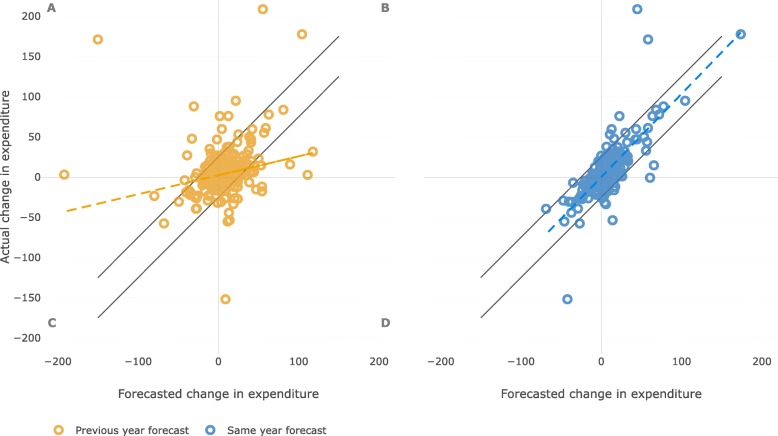
Results: According to the forecasts, the total pharmaceutical expenditure was estimated to increase between 2 and 8% annually. Our analyses showed that the accuracy of these forecasts varied over the years with a mean absolute error of 1.9 percentage points. Forecasts for the same year were more accurate than forecasts for the next year. The accuracy of forecasts also differed across the therapeutic areas. Factors influencing the accuracy of forecasting included the timing of the introduction of both new medicines and generics, the rate of uptake of new medicines, and sudden changes in reimbursement policies.
Conclusions: Based on the analyses of all forecasting reports produced since the model was established in Stockholm in the late 2000s, we demonstrated that it is feasible to forecast pharmaceutical expenditure with a reasonable accuracy. A number of factors influencing the accuracy of forecasting were also identified. If forecasting is used to provide data for decisions on budget allocation and agreements between payers and providers, we advise to update the forecast as close as possible prior to the decision date.
Keywords: Drug utilization; Forecasting; Pharmaceutical expenditure.
Conflict of interest statement
The authors declare that they have no competing interests.
Figures
References
-
- OECD . Pharmaceutical spending (indicator) 2019.
MeSH terms
Substances
LinkOut - more resources
Full Text Sources
Miscellaneous
