. 2020 May 11;39(1):83.
doi: 10.1186/s13046-020-01588-w.

Different p53 genotypes regulating different phosphorylation sites and subcellular location of CDC25C associated with the formation of polyploid giant cancer cells

Affiliations

Different p53 genotypes regulating different phosphorylation sites and subcellular location of CDC25C associated with the formation of polyploid giant cancer cells

Kai Liu et al. J Exp Clin Cancer Res. .

Erratum in

Abstract

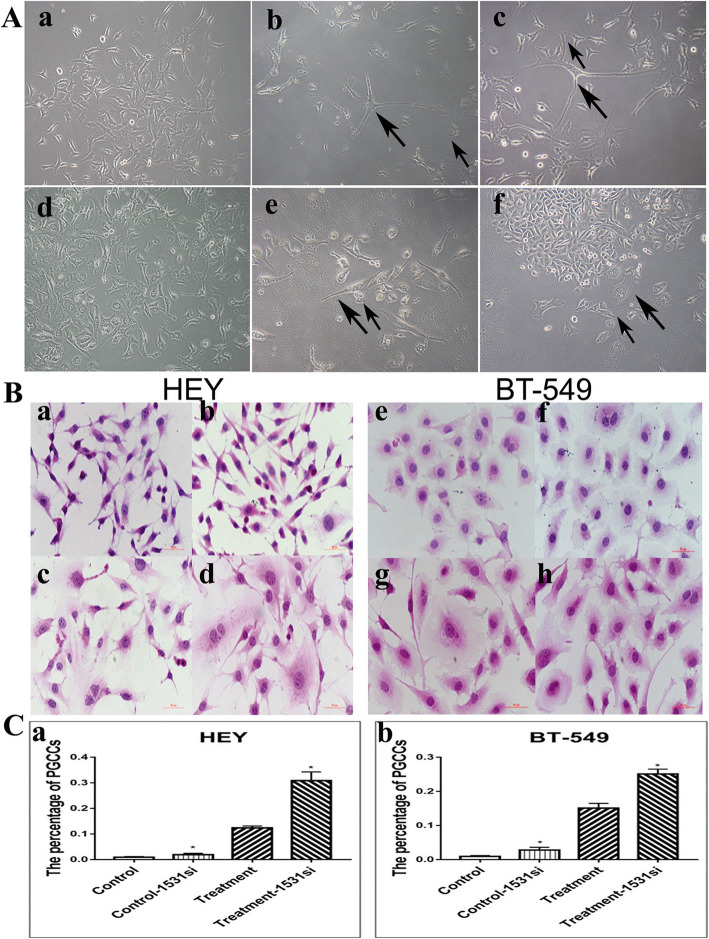
Background: Our previous studies have confirmed that cobalt chloride (CoCl2) can induce the formation of polyploid giant cancer cells (PGCCs), which is the key to the heterogeneity of solid tumors. PGCC formation is closely related to the abnormal expression of cell cycle-related proteins and cell fusion. In this study, we investigated the molecular mechanism of PGCCs formation by detecting the expression of cell cycle-related proteins in mutant and wild-type p53 cancer cell lines.

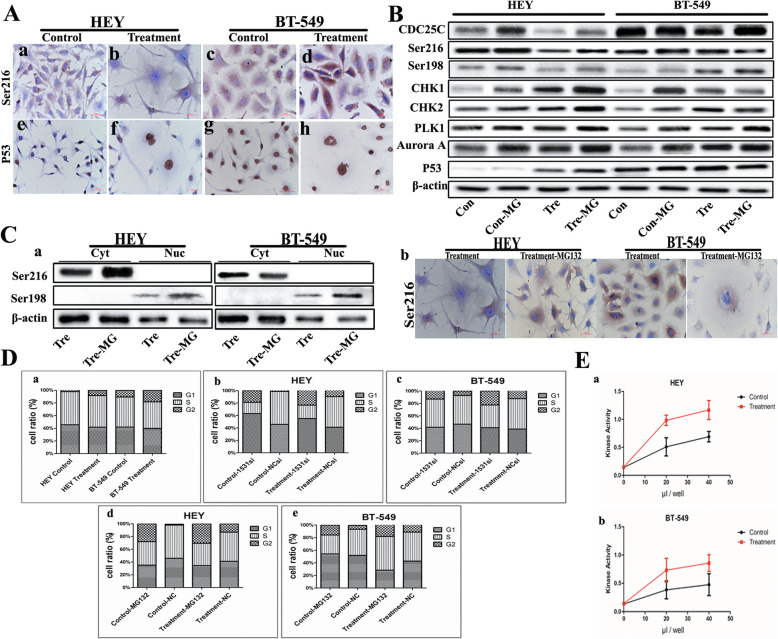
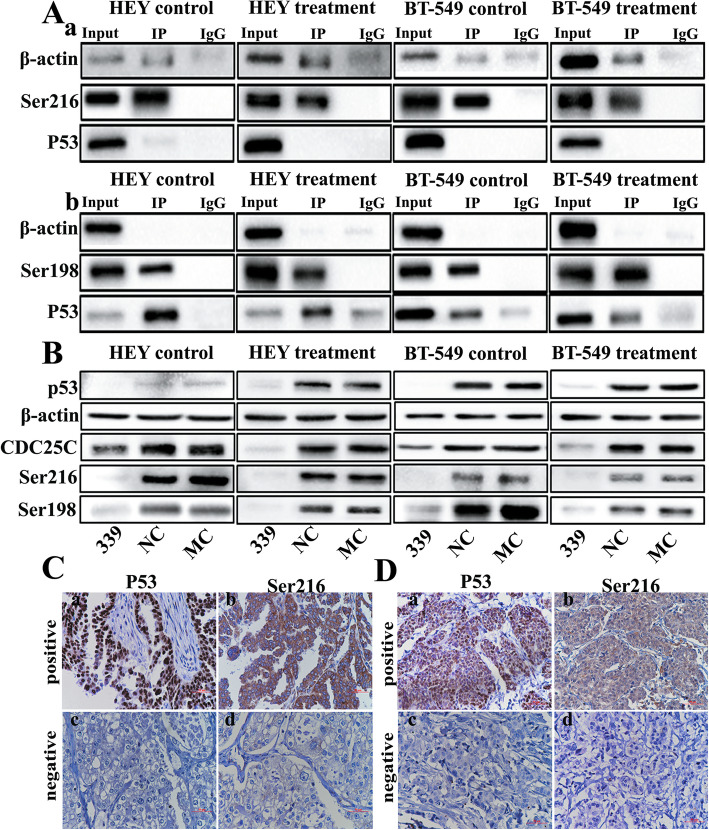
Methods: HEY, BT-549, SKOv3 and MDA-MB-231 cells were treated with CoCl2 and the cell cycle was detected by flow cytometry. The expression and subcellular localization of cell cycle-related proteins, kinases, and P53 were compared before and after CoCl2 treatment. Immunoprecipitation was used to analyze the interacting proteins of pCDC25C-Ser216 and pCDC25C-Ser198. The clinicopathologic significances of these cell cycle-related proteins and protein kinases expression were studied.

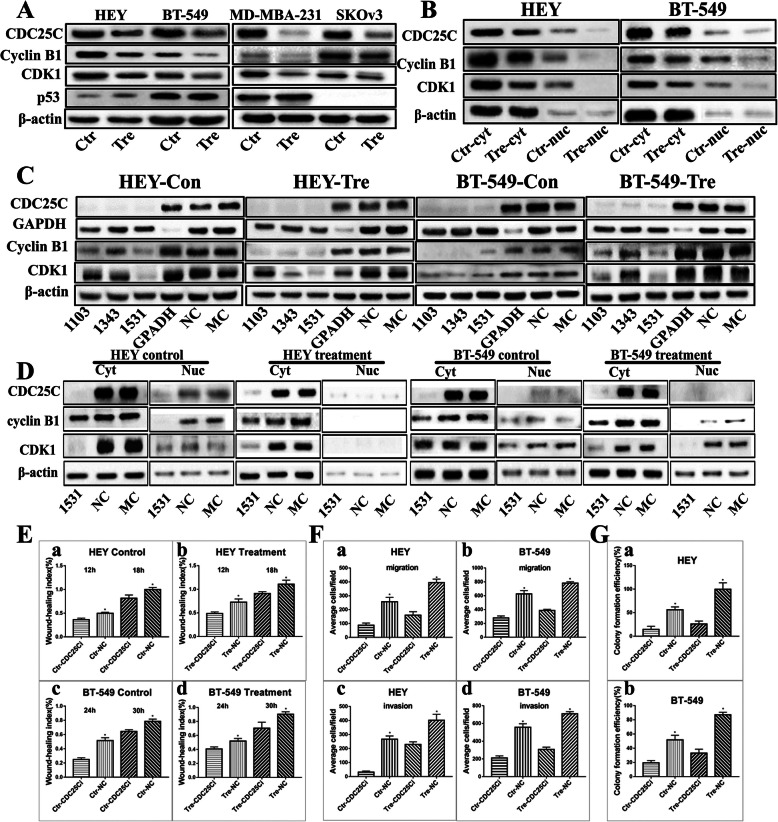
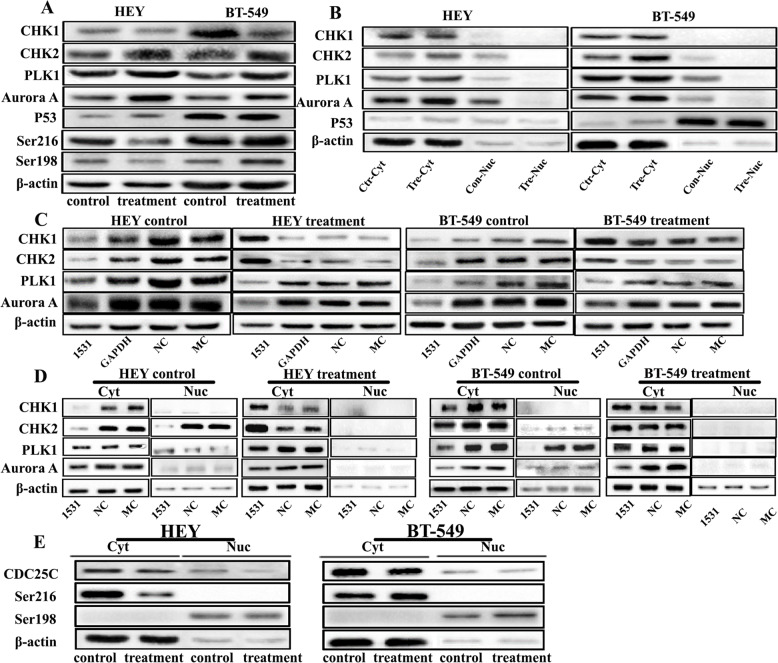
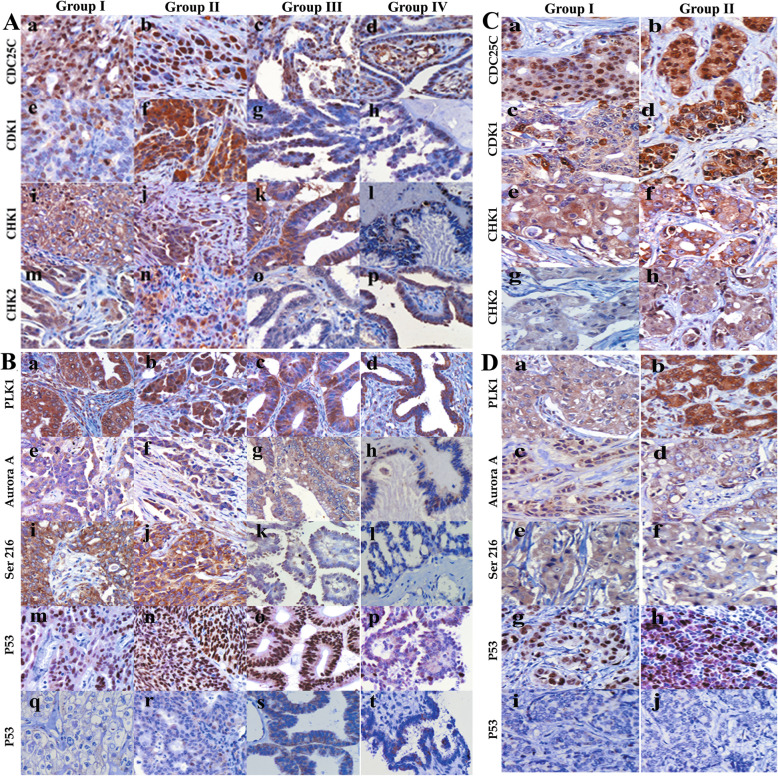
Results: CoCl2 induced the formation of PGCCs and G2/M arrest. CDC25C, cyclin B1, and CDK1 expressions after CoCl2 treatment were lower than that in control cells. Cytoplasmic CDC25C was degraded by ubiquitin-dependent proteasome. The expression of P53 and phosphokinases including CHK1, CHK2, PLK1, and Aurora A increased after CoCl2 treatment. The expression of pCDC25C-Ser216 and pCDC25C-Ser198 depended upon the genotype of p53. The expressions of cell cycle-related proteins and kinases gradually increased with the development of ovarian cancer and breast cancer.

Conclusion: CHK1, CHK2-pCDC25C-Ser216-cyclin B1-CDK1, and Aurora A-PLK1-pCDC25C-Ser198-cyclin B1-CDK1 signaling pathways may participate in the formation of PGCCs and different phosphorylation sites of CDC25C may be associated with the genotype of p53.

Keywords: CDC25C; Cell cycle-related proteins; Phosphorylation; Polyploid giant cancer cells; p53.


Conflict of interest statement

The authors declare that they have no competing interests.

Figures

Fig. 1
Fig. 1
PGCCs with budding daughter cells in HEY and BT-549 cells. a HEY and BT-549 control cells and PGCCs. (a) HEY control cells, (b) HEY PGCCs induced by 450 μM CoCl2 treatment for 48 h, (c) PGCCs and their daughter cells; the large black arrow indicates PGCCs and the small black arrow heads the daughter cells, (d) BT-549 control cells, (e) BT-549 PGCCs induced by 450 μM CoCl2 treatment for 24 h, and (f) PGCCs and their daughter cells; the large black arrow indicates PGCCs and the small black arrow heads the daughter cells. b H&E staining of the HEY and BT-549 cells before and after CDC25i. (a) HEY control cells, (b) Control cells after CDC25C knockdown, (c) HEY PGCCs with daughter cells, (d) HEY PGCCs and daughter cells after CDC25C knockdown, (e) BT-549 control cells, (f) Control cells after CDC25C knockdown, (g) H&E staining of the BT-549 PGCCs with daughter cells, and (h) BT-549 PGCCs with daughter cells after CDC25C knockdown c (a) The percentage of HEY PGCCs in control, control cells after CDC25i, PGCCs with daughter cells, and PGCCs with daughter cells after CDC25Ci. (b) The percentage of BT-549 PGCCs in control, control cells after CDC25i, PGCCs with daughter cells, and PGCCs with daughter cells after CDC25Ci. All magnifications are at 100×. Treatment: Cells treated with CoCl2. 1531si: siRNA CDC25C-1531
Fig. 2
Fig. 2
CDC25C, cyclin B1, and CDK1 expression in HEY, SKOv3, BT-549 and MDA-MB-231 cells before and after CoCl2 treatment. a Western blot showed the total protein expression of CDC25C, cyclin B1, and CDK1 in HEY, SKOv3, BT-549 and MDA-MB-231 control and PGCCs with daughter cells. b Western blot results show CDC25C, cyclinB1, and CDK1 cytoplasmic and nuclear expression in HEY and BT-549 control and PGCCs with daughter cells. c Total protein expression of CDC25C, cyclin B1, and CDK1 in HEY control and PGCCs with daughter cells with siRNA CDC25C-1103, 1343, 1531, siRNA control, and negative control transfection. d CDC25C, cyclin B1 and CDK1 cytoplasmic and nuclear expression in HEY and BT-549 control and PGCCs with daughter cells with siRNA CDC25C-1531, siRNA control, and negative control transfection. e Histogram was used to quantify wound-healing index in HEY and BT-549 cells by measuring no less than three different healing areas. (a) HEY control cells treated with CDC25C-siRNA and siRNA control. (b) HEY PGCCs and daughter cells treated with CDC25C-siRNA and siRNA control. (c) BT-549 control cells treated with CDC25C-siRNA and siRNA control. (d) BT-549 PGCCs and daughter cells treated with CDC25C-siRNA and siRNA control. f Column diagram of the average cell number for migration and invasion assay in HEY and BT-549 control, PGCCs, and daughter cells after the CDC25C-siRNA and siRNA control transfection. Average cell number for migration among (a) HEY and (b) BT-549 cells after the CDC25C-siRNA and siRNA control transfection. Average cell number for invasion among (c) HEY and (d) BT-549 cells after the CDC25C-siRNA and siRNA control transfection. g Column diagram shows the colony formation efficiency in HEY and BT-549 control and PGCCs with daughter cells after CDC25C-siRNA and siRNA control transfection. Colony formation efficiency of (a) HEY and (b) BT-549 with different treatment. Treatment: Cells treated with CoCl2. CDC25i: CDC25C-1531 siRNA
Fig. 3
Fig. 3
The expression of CHK1, CHK2, PLK1, Aurora A, P53, pCDC25CSer216, and pCDC25CSer198 in HEY and BT-549 control cells and PGCCs with budding daughter cells with and without CDC25C knockdown. a Western blot showed the total protein expression of CHK1, CHK2, PLK1, Aurora A, P53, pCDC25CSer216, and pCDC25CSer198 in HEY and BT-549 control and PGCCs with daughter cells. b The levels of total protein expression of CHK1, CHK2, PLK1, and Aurora A in HEY and BT-549 control and PGCCs with daughter cells, which were transfected with CDC25Ci, siRNA control, and negative control. c Cytoplasmic and nuclear protein expression of CHK1, CHK2, PLK1, Aurora A, P53 in HEY and BT-549 control and PGCCs with daughter cells. d Cytoplasmic and nuclear expression of CHK1, CHK2, PLK1, and Aurora A in HEY and BT-549 control and PGCCs with daughter cells, which were transfected with CDC25Ci, siRNA control, and negative control. e The cytoplasm and nuclear protein expression of pCDC25CSer216 and pCDC25CSer198 in HEY and BT-549 control and PGCCs with daughter cells. Treatment: Cells treated with CoCl2. 1531si: siRNA CDC25C-1531
Fig. 4
Fig. 4
a ICC staining of pCDC25CSer216 and P53 in HEY and BT-549 before and after CoCl2 treatment (200×). pCDC25CSer216 in (a) HEY control cells, (b) HEY PGCCs with daughter cells, (c) BT-549 control, and (d) BT-549 PGCCs with daughter cells. P53 in (e) HEY control, (f) HEY PGCCs with daughter cells, (g) BT-549 control, and (h) BT-549 PGCCs and daughter cells. b CDC25C, pCDC25CSer216, pCDC25CSer198, CHK1, CHK2, PLK1, Aurora A, P53 expression in HEY and BT-549 control cells and PGCCs before and after MG-132 treatment. c (a) Cytoplasmic and nuclear expression of pCDC25CSer216 and pCDC25CSer198 in HEY and BT-549 control cells and PGCCs after MG-132 treatment. (b) ICC staining showing the subcellular localization of pCDC25CSer216 in HEY and BT-549 PGCCs with budding cells after MG-132 treatment (400×). d Columnar percentage plot showing the ratio of cells at G1, S, and G2 stages of cell cycle in HEY and BT-549 cells. (a) The ratio of cells at G1, S, and G2 stages in HEY control and PGCCs with daughter cells before and after CoCl2 treatment. (b) The ratio of cells at G1, S, and G2 stages in HEY control and PGCCs with daughter cells before and after CDC25C knockdown. (c) The ratio of cells at G1, S, and G2 stages in BT-549 control and PGCCs with daughter cells before and after CDC25C knockdown. (d) The ratio of cells at G1, S, and G2 stages in HEY control and PGCCs with daughter cells before and after MG132 treatment. (e) The ratio of cells at G1, S, and G2 stages in BT-549 control and PGCCs with daughter cells before and after MG132 treatment. e The results of kinase activity assay in vitro. (a) HEY control cells and PGCCs with budding. (b) BT-549 control cells and PGCCs with budding. Treatment: Cells treated with CoCl2. MG: Cells were treated with MG-132. 1531si: siRNA CDC25C-1531
Fig. 5
Fig. 5
a Co-IP shows the interaction between pCDC25CSer216, pCDC25CSer198, and P53 in HEY and BT-549 cells. Western blot showed the interaction between (a) pCDC25CSer216 and P53 and (b) pCDC25CSer198 and P53. b The levels of total protein expression of CDC25C, pCDC25CSer216, and pCDC25CSer198 in HEY and BT-549 control and PGCCs with daughter cells transfected with p53i, siRNA control, and negative control. c Expression of P53 and pCDC25CSer216 in human breast cancer (IHC, × 100). Breast cancer tissue with (a) P53 and (b) pCDC25CSer216 positive expressions. Breast cancer tissue with (c) P53 and (d) pCDC25CSer216 negative expressions. d Expression of P53 and pCDC25CSer216 in human ovarian tumor (IHC, 100×). Ovarian cancer tissue with (a) P53 and (b) pCDC25CSer216 positive expressions. Ovarian carcinoma with (c) P53 and (d) pCDC25CSer216 negative expressions. Treatment: Cells treated with CoCl2. 339: siRNA p53–339
Fig. 6
Fig. 6
a Expression of cell cycle-related proteins in primary ovarian cancer with lymph node metastasis (group I), corresponding lymph node metastases (group II), primary ovarian cancer tissue without lymph node metastasis (group III), and serious borderline cystadenoma (group IV) (IHC, 200×). (a–d) CDC25C, (e–h) CDK1, (i–l) CHK1, and (m–p) CHK2 expressions in different groups. b Expression of protein kinase and P53 in primary ovarian cancer with lymph node metastasis (group I), corresponding lymph node metastases (group II), primary ovarian cancer tissue without lymph node metastasis (group III), and serious borderline cystadenoma (group IV) (IHC, 200×). (a–d) PLK1, (e–h) Aurora A, (i–l) pCDC25C-Ser216, and (m–p) positive and (q–t) negative P53 expressions in different groups. c Expression of cell cycle-related proteins in primary breast cancer (group I) and lymph node metastatic breast cancer (group II) (IHC, 200×). (a–b) CDC25C, (c–d) CDK1, (e–f) CHK1, and (g–h) CHK2 expressions in different groups. d Expression of protein kinase and P53 in primary breast cancer (group I) and lymph node metastatic breast cancer (group II) (IHC, 200×). (a–b) PLK1, (c–d) Aurora A, (e–f) pCDC25C-ser216, and (g–h) positive and (i–j) negative P53 expressions in different groups

Similar articles

Cited by

References

    1. Zhang S, Mercado-Uribe I, Xing Z, Sun B, Kuang J, Liu J. Generation of cancer stem-like cells through the formation of polyploid giant cancer cells. Oncogene. 2014;33(1):116–28. 10.1038/onc.2013.96 - DOI - PMC - PubMed
    1. Fei F, Zhang D, Yang Z, Wang S, Wang X, Wu Z, Wu Q, Zhang S. The number of polyploid giant cancer cells and epithelial-mesenchymal transition-related proteins are associated with invasion and metastasis in human breast cancer. J Exp Clin Cancer Res. 2015;34:158. 10.1186/s13046-015-0277-8 - DOI - PMC - PubMed
    1. Zhang S, Zhang D, Yang Z, Zhang X. Tumor budding, micropapillary pattern, and polyploidy Giant Cancer cells in colorectal Cancer: current status and future prospects. Stem Cells Int. 2016;2016:4810734. 10.1155/2016/4810734 - DOI - PMC - PubMed
    1. Zhang D, Yang X, Yang Z, Fei F, Li S, Qu J, Zhang M, Li Y, Zhang X, Zhang S. Daughter cells and Erythroid cells budding from PGCCs and their Clinicopathological significances in colorectal Cancer. J Cancer. 2017;8(3):469–78. 10.7150/jca.17012 - DOI - PMC - PubMed
    1. Fei F, Li C, Wang X, Du J, Liu K, Li B, Yao P, Li Y, Zhang S. Syncytin 1, CD9, and CD47 regulating cell fusion to form PGCCs associated with cAMP/PKA and JNK signaling pathway. Cancer Med. 2019;8(6):3047–58. 10.1002/cam4.2173 - DOI - PMC - PubMed

MeSH terms