. 2020 May 11;21(1):108.
doi: 10.1186/s13059-020-02024-0.

Defining the relative and combined contribution of CTCF and CTCFL to genomic regulation

Affiliations

Defining the relative and combined contribution of CTCF and CTCFL to genomic regulation

Mayilaadumveettil Nishana et al. Genome Biol. .

Erratum in

Abstract

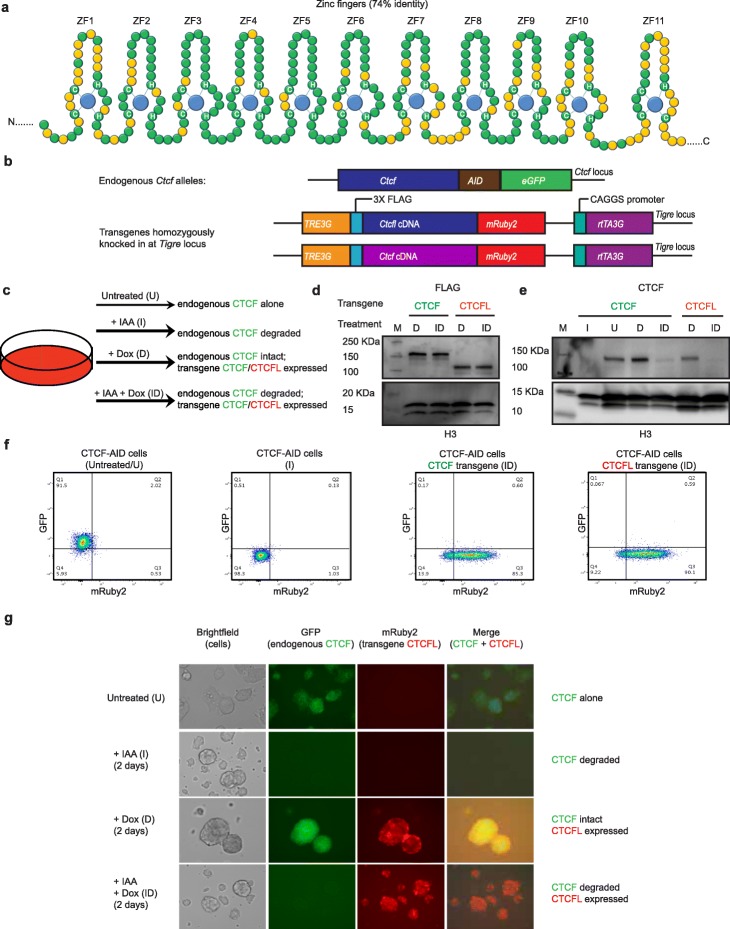
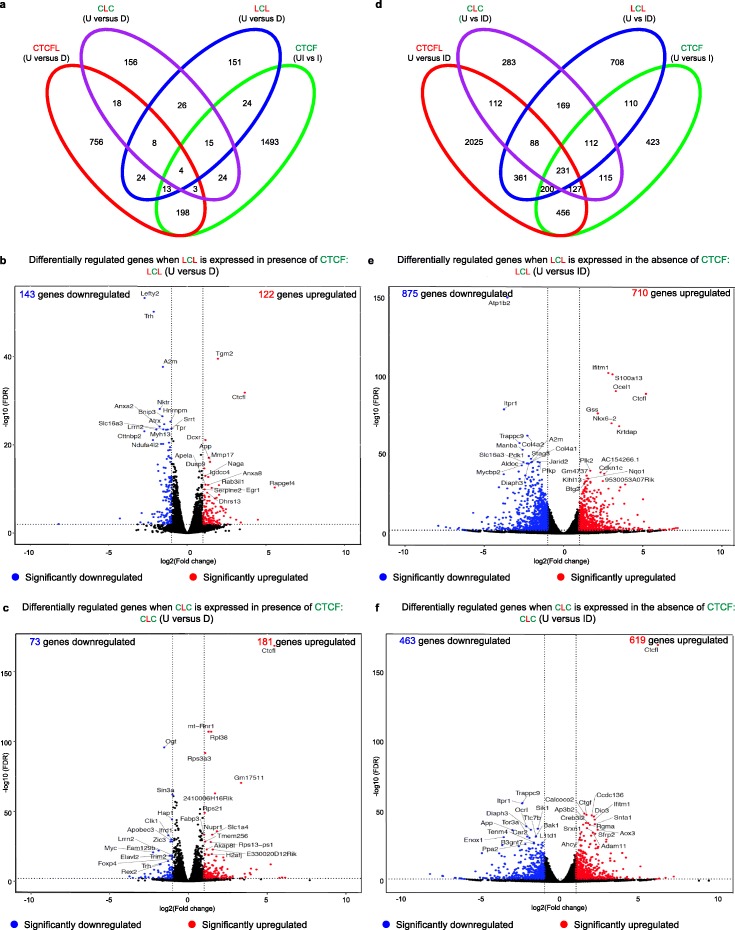
Background: Ubiquitously expressed CTCF is involved in numerous cellular functions, such as organizing chromatin into TAD structures. In contrast, its paralog, CTCFL, is normally only present in the testis. However, it is also aberrantly expressed in many cancers. While it is known that shared and unique zinc finger sequences in CTCF and CTCFL enable CTCFL to bind competitively to a subset of CTCF binding sites as well as its own unique locations, the impact of CTCFL on chromosome organization and gene expression has not been comprehensively analyzed in the context of CTCF function. Using an inducible complementation system, we analyze the impact of expressing CTCFL and CTCF-CTCFL chimeric proteins in the presence or absence of endogenous CTCF to clarify the relative and combined contribution of CTCF and CTCFL to chromosome organization and transcription.

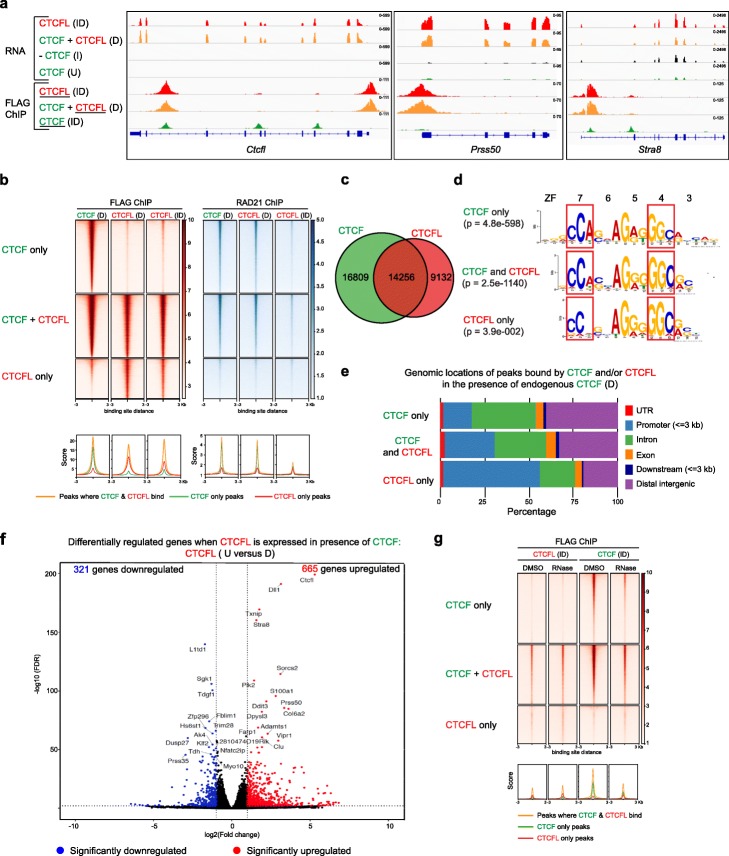
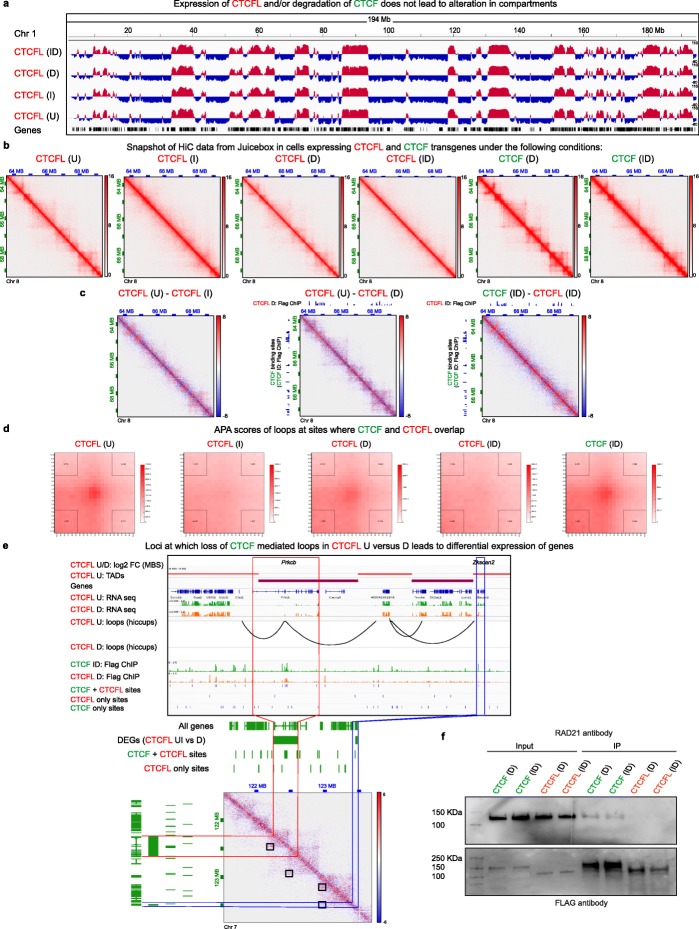
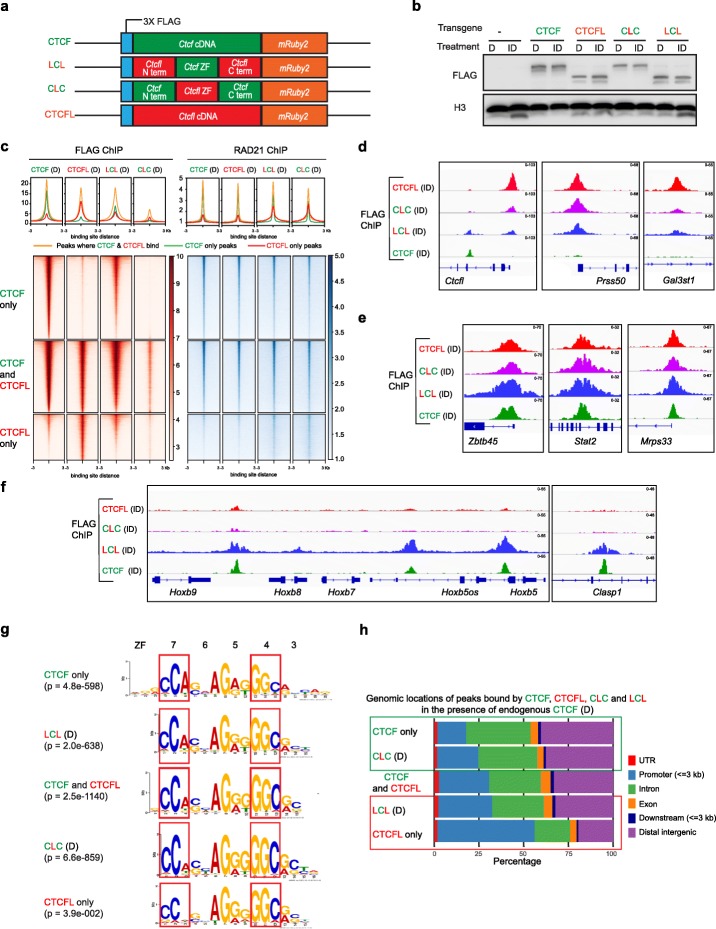
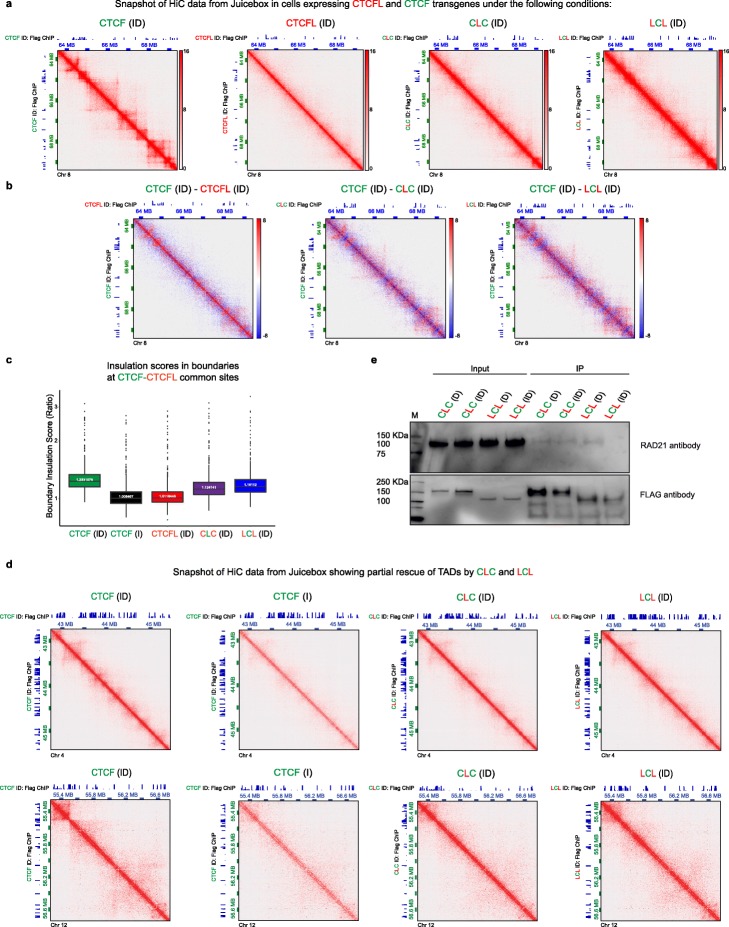
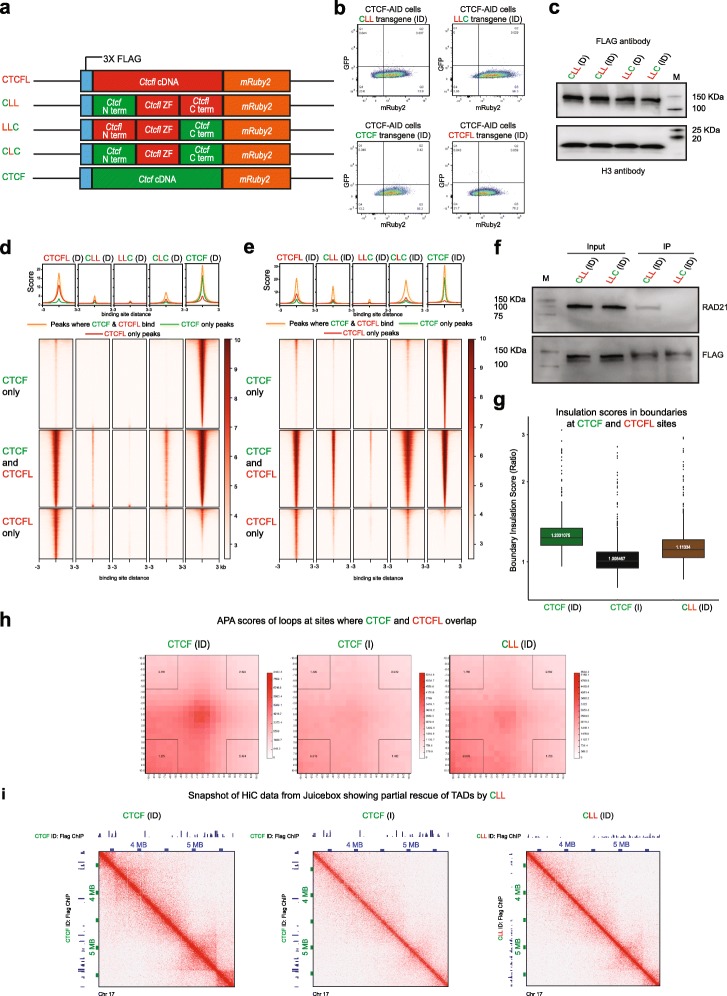
Results: We demonstrate that the N terminus of CTCF interacts with cohesin which explains the requirement for convergent CTCF binding sites in loop formation. By analyzing CTCF and CTCFL binding in tandem, we identify phenotypically distinct sites with respect to motifs, targeting to promoter/intronic intergenic regions and chromatin folding. Finally, we reveal that the N, C, and zinc finger terminal domains play unique roles in targeting each paralog to distinct binding sites to regulate transcription, chromatin looping, and insulation.

Conclusion: This study clarifies the unique and combined contribution of CTCF and CTCFL to chromosome organization and transcription, with direct implications for understanding how their co-expression deregulates transcription in cancer.

Keywords: 3D chromatin architecture; CTCF; CTCFL; Cancer; Chromatin insulation; Cohesin; Gene regulation; Loop extrusion.


Conflict of interest statement

The authors declare that they have no competing interests.

Figures

Fig. 1
Fig. 1
System to investigate the interplay between CTCFL and CTCF in somatic cells. a Schematic representation of the similarities and differences between CTCF and CTCFL. Figure adapted from Marshall et al. [34]. The DNA binding domain of both proteins is composed of 11 zinc fingers. ZFs 1–10 and ZF11 belong to the C2H2 and C2HC class of ZFs, respectively. Shared and different amino acids in CTCF and CTCFL are shown in green and yellow, respectively. Blue circles indicate zinc ions. Histidines and cysteines that form coordinate bonds with zinc are marked. b Scheme of genetic modifications in the Ctcf locus and the doxycycline-inducible transgenic Ctcfl or Ctcf knocked-in at the Tigre locus. The endogenous Ctcf contains the auxin-inducible degron (AID) and the eGFP tag on both alleles. Both Ctcf and Ctcfl transgenes harbor an N terminal 3× FLAG tag and C terminal mRUBY2 as well as TetO-3G element and rtTA3G for doxycycline-induced expression. c Experimental strategy for expression of dox-inducible CTCF/CTCFL transgenes in the presence and absence of CTCF using the auxin-inducible degron system. Addition of indole-3-acetic acid (IAA), a chemical analog of auxin, leads to transient and reversible degradation of CTCF, while addition of doxycycline (Dox) leads to induction and expression of the respective transgene. The four conditions used in our analysis are as follows: U, untreated cells; I, IAA treated for CTCF depletion; D, Dox induced expression of transgenic CTCF/CTCFL; ID, IAA plus Dox treated for depletion of endogenous CTCF and induction of transgene expression. d Western blot using FLAG antibody shows that the level of expression of transgenes are comparable across the cell types (CTCF and CTCFL in D and ID conditions). CTCF has a predicted molecular weight of 84 kDa and CTCFL, 74 kDa. However, CTCF is known to migrate as a 130-kDa protein [39]. Since the transgenes are expressed as fusion proteins with FLAG tag and mRuby2, which together adds another 29 kDa, the resulting proteins migrate at 159 and 103 kDa, respectively. e Western blot with CTCF antibody shows the presence of endogenous and transgenic CTCF. Histone H3 serves as a loading control in d and e. “M” is the molecular weight ladder and the molecular weights are marked. f, g Flow cytometry and microscopy confirmed that the level of mRuby2 expression of transgenic CTCF and CTCFL are comparable
Fig. 2
Fig. 2
Distinct characteristics of CTCF and CTCFL and their binding sites. a IgV tracks show RNA-seq in cells harboring the CTCFL transgene in U, I, D, and ID conditions. FLAG ChIP-seq to detect CTCFL and CTCF in cells with the respective transgenic knock-ins. The protein whose binding is being assessed is underlined. Expression of Ctcfl, Prss50, and Stra8 are also shown. b Heatmaps showing CTCF and CTCFL ChIP-seq signals at regions where they bind alone or together in CTCF D, CTCFL D, and ID conditions. The heatmaps are divided into CTCF only, CTCF+CTCFL overlapping, and CTCFL-only sites. Cohesin binding profiles (RAD21 ChIP) are shown for the corresponding conditions. Peaks are ranked by FLAG ChIP in cells expressing the CTCF transgene. Average profiles are shown below the corresponding heatmaps. c Venn diagrams showing the numbers of unique and overlapping CTCF and CTCFL binding sites (D condition). d Binding site motifs for unique and overlapping CTCF and CTCFL binding sites. Zinc fingers and the corresponding bases to which they bind are marked. e Annotation of the genomic locations of peaks for unique and overlapping CTCF and CTCFL binding sites in D condition. The locations of UTR, promoters (+/− 3 kb around TSS), introns, exons, downstream (3 kb), and distal intergenic regions are marked. f Volcano plot highlighting DEGs in wild-type versus CTCFL expressing mESCs in the presence of endogenous CTCF. Red and blue points identify genes with significantly increased or decreased expression, respectively (FDR < 0.01). The number of genes that are significantly up- or downregulated is indicated in either case. g Heatmaps showing the inhibition of chromatin binding of CTCF, but not CTCFL, after RNaseA treatment. The heatmaps are divided into CTCF only, CTCF+CTCFL overlapping, and CTCFL-only sites. Peaks are ranked by FLAG ChIP in cells expressing the CTCF transgene (CTCF ID). Average profiles are shown below the corresponding heatmaps
Fig. 3
Fig. 3
The impact of CTCFL on 3D chromatin organization. a IgV tracks showing principal component analysis characterizing the A/B status of compartments (red track: A compartment, PC1 > 0; blue track: B compartment, PC1 < 0) in cells harboring the CTCFL transgene under U, I, D, and ID conditions. Data from chromosome 1 is shown. b Hi-C data from Juicebox corresponding to Chr 8: 63,616,214-69,456,200 at 10 kb resolution. TADs show up as triangles on Hi-C contact maps whose intensity represents interaction strength. Heatmap of Hi-C interactions demonstrates loss of TADs following CTCF depletion (CTCFL I). CTCFL expression does not have a major impact on global TAD structure in the presence (D) or absence (ID) of CTCF. Strengthening of TADs is seen in CTCF D and rescue of TADs in CTCF ID. c Subtraction heatmaps of Hi-C data from Juicebox corresponding to CTCFL (U–I), CTCFL (U–D), and CTCF ID–CTCFL ID. CTCF binding sites (CTCF ID: FLAG ChIP) are shown on the y-axis and FLAG ChIPs of CTCFL-D and CTCFL ID on the x-axis, as indicated. d Aggregate peak analysis demonstrates the strength of the loops at sites where CTCF and CTCFL bind competitively. The transgenes and the respective treatments are indicated. The color intensity at the center of the plot is indicative of loop strength. APA scores are shown in the corners. Values > 1 indicate presence of loops. Examples of altered loops at specific loci are shown in Additional file 1: Figure S4B. e Screenshots of UCSC genome browser showing features of chromatin organization including mean boundary scores (MBS), presence of TADs, and alterations in loops as well as RNA and ChIP-seq tracks. The ChIP-seq peaks unique to CTCF and CTCFL as well as those that are overlapping are shown. The transgenes harbored by the cells and the respective treatments are indicated. Lower panel shows a representative case where alterations in loops and differential expression of genes occur at sites where CTCF and CTCFL binding overlaps. A snapshot of subtraction heatmap from Juicebox is shown with the loops highlighted in boxes. Loops appear as dots at the apex of TADs, the intensity of which defines the “loop strength.” f Co-IP experiments showing the interaction of RAD21 with transgenic CTCF and CTCFL in both D and ID conditions
Fig. 4
Fig. 4
The role of CTCF and CTCFL zinc fingers and N/C terminals in site-specific binding. a Schematic showing the doxycycline-inducible parent (Ctcf, Ctcfl) and chimeric (CTCFL N terminus - CTCF ZFs - CTCFL C terminus (LCL) and CTCF N terminus - CTCFL ZFs - CTCF C terminus (CLC) transgenes knocked into the Tigre locus. All transgenes contain an N terminal 3 × FLAG, C terminal mRUBY2, and TetO-3G and rtTA3G for doxycycline-induced expression. b Western blot using FLAG antibody shows that the level of expression of transgenes is comparable across cell types as well as experimental conditions (D versus ID). Histone H3 serves as loading control. c Heatmaps of CTCF, CTCFL, LCL, and CLC ChIP-seq signals at regions where they bind in the presence of endogenous CTCF (D). The heatmaps are divided into CTCF only, CTCF+CTCFL overlapping, and CTCFL-only regions. Cohesin peaks (RAD21 ChIP) are shown for the corresponding conditions. Peaks are ranked by FLAG ChIP using cells expressing the CTCF transgene. Average profiles are shown above the corresponding heatmaps. d–f IgV tracks showing ChIP-seq for CTCF, CTCFL, LCL, and CLC at Ctcfl, Prss50, Gal3st1 (d), Zbtb45, Stat2, Mrps33 (e), Hoxb, and Clasp1 (f) using a FLAG antibody in cells harboring the respective transgenes in the absence of CTCF. g Binding site motifs at CTCF and CTCFL-only sites, as well as CTCF and CTCFL overlapping sites. Motifs for CLC and LCL were identified in the presence of endogenous CTCF. The zinc fingers and the corresponding bases to which they bind are marked. h Annotation of the genomic locations of peaks bound at CTCF and CTCFL-only sites, as well as CTCF and CTCFL overlapping sites. Motifs for CLC and LCL were identified in the presence of endogenous CTCF. The locations of UTR, promoter (+/−  3 kb around TSS), intron, exon, downstream (3 kb), and distal intergenic regions are marked
Fig. 5
Fig. 5
Gene expression changes of fusion proteins do not phenocopy that of either parent protein. a, d Venn diagrams showing comparison of deregulated gene expression by CTCFL, LCL, and CLC in the presence (a) and absence (d) of endogenous CTCF. b, c, e, f Volcano plot representation of differentially expressed genes in untreated (U) versus LCL (b, e) and CLC (c, f) expressing mESCs in the presence (D) (b, c) and absence (ID) (e, f) of endogenous CTCF. Red and blue mark the genes with significantly increased or decreased expression, respectively (FDR < 0.01). The x-axis shows the log2 fold-changes in expression and the y-axis the log 10 (false discovery rate) of a gene being differentially expressed. The number of genes that are significantly up- or downregulated is indicated in either case
Fig. 6
Fig. 6
The impact of fusion proteins on chromatin organization. a Snapshot of Hi-C data from Juicebox corresponding to Chr 8: 63,616,214-69,456,200 at 10 kb resolution. Cells harboring CTCF, CTCFL, CLC, and LCL transgenes were treated with ID as indicated for 4 days. The corresponding FLAG ChIPs are shown on the x- and y-axis. b Subtraction heatmaps of Hi-C data from Juicebox corresponding to CTCF ID – CTCFL ID, CTCF ID – CLC ID, and CTCF ID – LCL ID. CTCF binding sites (CTCF ID: Flag ChIP) are shown on the y-axis and Flag ChIPs of CTCFL ID, CLC ID, and LCL ID on the x-axis, as indicated. c Insulation scores in boundaries of CTCF+CTCFL overlapping sites in CTCF depleted cells (CTCF I) as well as cells depleted of CTCF but induced to express transgenic CTCF, CTCFL, CLC, or LCL (ID condition). d Snapshot of Hi-C data from Juicebox showing partial recue of TADs when CLC and LCL were expressed in the absence of endogenous CTCF. The corresponding FLAG ChIPs are shown on the x- and y-axis. e Co-IP experiments showing interaction of RAD21 with transgenic CLC or LCL in the presence (D) and absence (ID) of CTCF
Fig. 7
Fig. 7
The N terminus of CTCF interacts with RAD21. a Schematic showing the doxycycline-inducible parent and chimeric protein transgenes knocked into the Tigre locus. b Flow cytometry confirms that the level of mRuby2 expression of the transgenes and parental proteins are comparable. c Western blot using FLAG antibody shows that the level of expression of CLL and LLC is comparable across experimental conditions (D versus ID). Histone H3 serves as loading control. d, e Heatmaps showing CTCFL, CLL, LLC, CLC, and CTCF ChIP-seq signals at regions where they bind in the presence (d) and absence (e) of endogenous CTCF. The heatmaps are divided into CTCF only, CTCF+CTCFL overlapping, and CTCFL-only sites. Average profile of the respective heatmaps is shown above the corresponding heatmaps. f Co-IP experiments showing interaction of RAD21 with transgenic CLL and LLC in the absence (ID) of CTCF. M stands for molecular weight marker and the corresponding weights are shown. g Insulation scores in boundaries of CTCF+CTCFL overlapping sites in CTCF-depleted cells (CTCF I) and cells depleted of CTCF that were induced to express transgenic CTCF and CLL (ID condition). h Aggregate peak analysis demonstrates the strength of the loops in the CTCF ID, CTCF I, and CLL ID conditions at sites where CTCF and CTCFL bind competitively. i Snapshot of Hi-C data from Juicebox showing TADs in the presence of transgenic CTCF (CTCF ID), loss of TADs after CTCF depletion (CTCF I), and partial recue of TADs when CLL was expressed in the absence of endogenous CTCF (CLL ID). The corresponding FLAG ChIPs are shown on the x- and y-axis

Similar articles

Cited by

References

    1. Tang Z, Luo OJ, Li X, Zheng M, Zhu JJ, Szalaj P, Trzaskoma P, Magalska A, Wlodarczyk J, Ruszczycki B, et al. CTCF-mediated human 3D genome architecture reveals chromatin topology for transcription. Cell. 2015;163:1611–1627. doi: 10.1016/j.cell.2015.11.024. - DOI - PMC - PubMed
    1. Sanborn AL, Rao SS, Huang SC, Durand NC, Huntley MH, Jewett AI, Bochkov ID, Chinnappan D, Cutkosky A, Li J, et al. Chromatin extrusion explains key features of loop and domain formation in wild-type and engineered genomes. Proc Natl Acad Sci U S A. 2015;112:E6456–E6465. doi: 10.1073/pnas.1518552112. - DOI - PMC - PubMed
    1. Nuebler J, Fudenberg G, Imakaev M, Abdennur N, Mirny LA. Chromatin organization by an interplay of loop extrusion and compartmental segregation. Proc Natl Acad Sci U S A. 2018;115:E6697–E6706. doi: 10.1073/pnas.1717730115. - DOI - PMC - PubMed
    1. Nasmyth K. Disseminating the genome: joining, resolving, and separating sister chromatids during mitosis and meiosis. Annu Rev Genet. 2001;35:673–745. doi: 10.1146/annurev.genet.35.102401.091334. - DOI - PubMed
    1. Fudenberg G, Imakaev M, Lu C, Goloborodko A, Abdennur N, Mirny LA. Formation of chromosomal domains by loop extrusion. Cell Rep. 2016;15:2038–2049. doi: 10.1016/j.celrep.2016.04.085. - DOI - PMC - PubMed

Publication types