. 2020 May 11;21(1):114.
doi: 10.1186/s13059-020-01996-3.

Insights gained from a comprehensive all-against-all transcription factor binding motif benchmarking study

Affiliations

Insights gained from a comprehensive all-against-all transcription factor binding motif benchmarking study

Giovanna Ambrosini et al. Genome Biol. .

Abstract

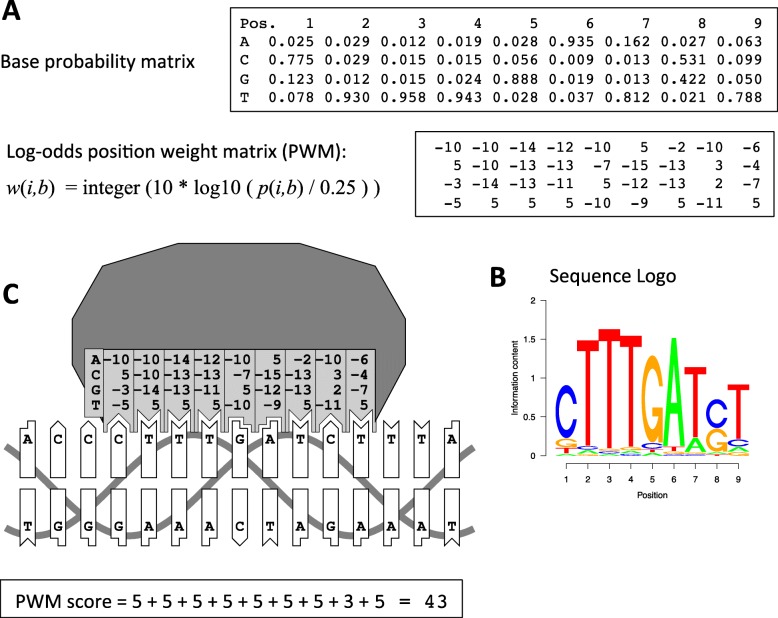
Background: Positional weight matrix (PWM) is a de facto standard model to describe transcription factor (TF) DNA binding specificities. PWMs inferred from in vivo or in vitro data are stored in many databases and used in a plethora of biological applications. This calls for comprehensive benchmarking of public PWM models with large experimental reference sets.

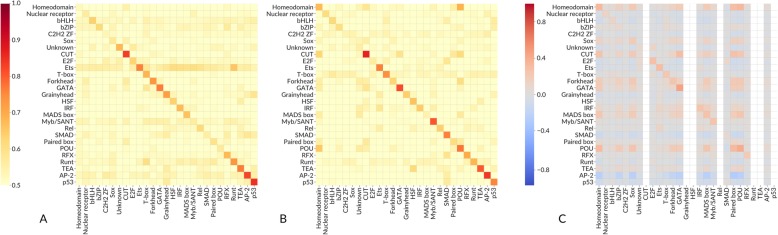
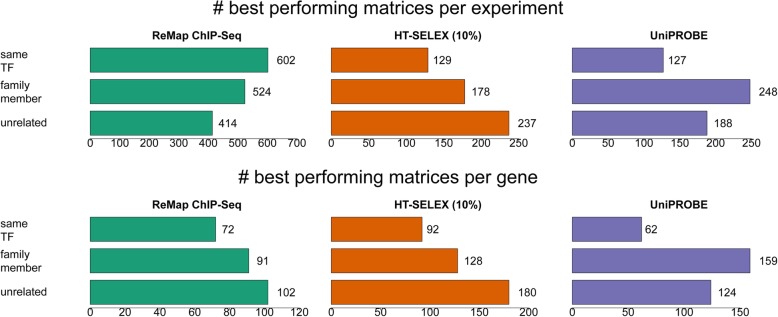
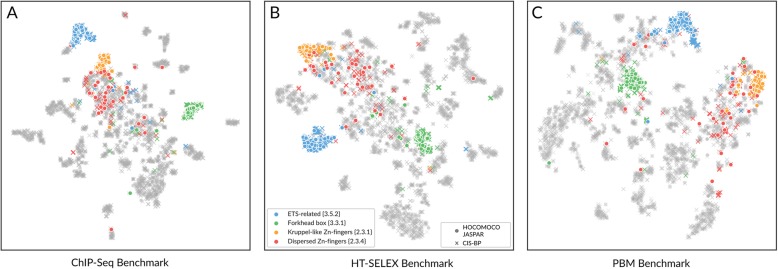
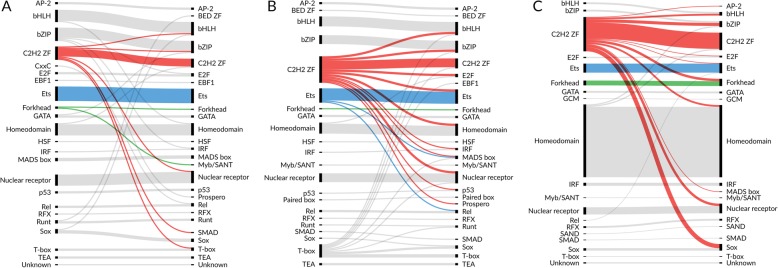
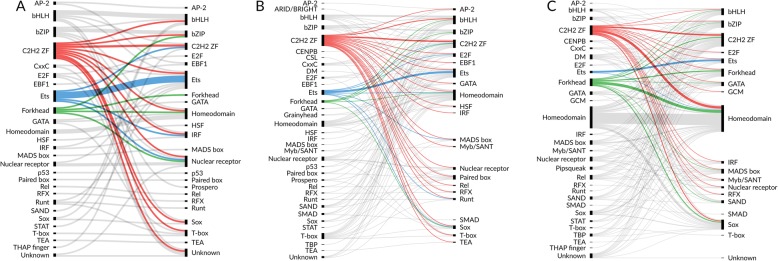
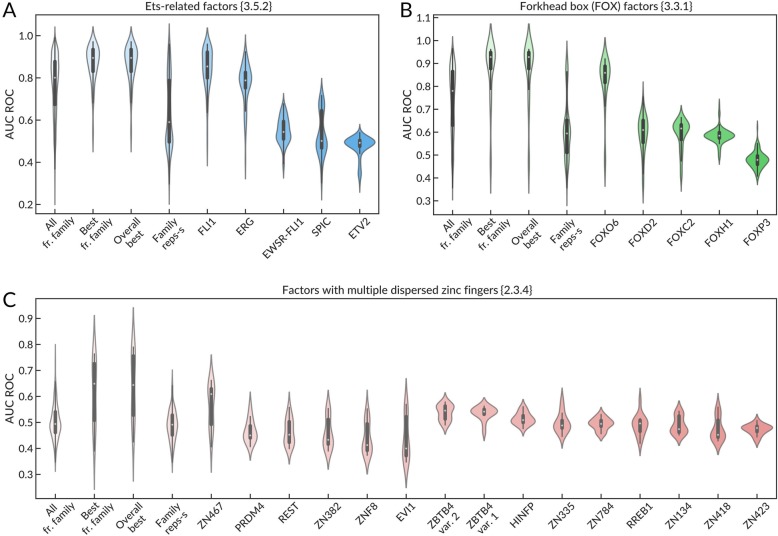
Results: Here we report results from all-against-all benchmarking of PWM models for DNA binding sites of human TFs on a large compilation of in vitro (HT-SELEX, PBM) and in vivo (ChIP-seq) binding data. We observe that the best performing PWM for a given TF often belongs to another TF, usually from the same family. Occasionally, binding specificity is correlated with the structural class of the DNA binding domain, indicated by good cross-family performance measures. Benchmarking-based selection of family-representative motifs is more effective than motif clustering-based approaches. Overall, there is good agreement between in vitro and in vivo performance measures. However, for some in vivo experiments, the best performing PWM is assigned to an unrelated TF, indicating a binding mode involving protein-protein cooperativity.

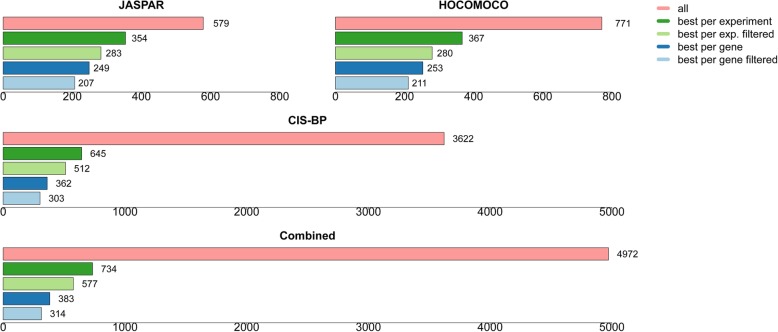
Conclusions: In an all-against-all setting, we compute more than 18 million performance measure values for different PWM-experiment combinations and offer these results as a public resource to the research community. The benchmarking protocols are provided via a web interface and as docker images. The methods and results from this study may help others make better use of public TF specificity models, as well as public TF binding data sets.

Keywords: Benchmarking; ChIP-seq; HT-SELEX; PBM; PWM; Transcription factor binding sites.


Conflict of interest statement

The authors declare that they have no competing interests.

Figures

Fig. 1
Fig. 1
Position weight matrix (PWM) model for representing transcription factor (TFBS) binding site motifs. a Base probability and position weight matrices are two alternative representations of a TFBS motif, inter-convertible by the formula shown. b Sequence logo representation of the same motif. c Biophysical interpretation of the PWM model
Fig. 2
Fig. 2
The average performance (а, b AUC ROC; c Pearson correlation coefficient) achieved by PWMs (rows) on particular data sets (columns). The average is taken over all binding motifs for TFs from the same family of DNA recognition domains according to the CIS-BP TF family classification and for all experiments for all TFs from the family of their DNA recognition domains. The PWMs were benchmarked on ChIP-seq (a), HT-SELEX 10% (b), and PBM (c) data. Only families with no less than 2 PWMs, 2 ChIP-seq, and 2 SELEX data sets are shown
Fig. 3
Fig. 3
Statistics about best performing matrices. Four thousand nine-hundred seventy-two matrices from JASPAR, HOCOMOCO, and CIS-BP were benchmarked on ChIP-seq, HT-SELEX, and PBM data. The “best” matrix for a TF was chosen based on its aggregate rank score over all experiments attributed to this TF (see the “Methods” section)
Fig. 4
Fig. 4
PWMs grouping according to the similarity of their performance measure values across data sets. PWMs recognizing bound regions in similar selections of experiments are grouped reasonably well according to their TFClass families. Dimensionality reduction with t-SNE is applied to motifs’ performance at ChIP-seq (a), HT-SELEX 10% (b), and PBM data (c). For illustration, several TF families are highlighted with color. Each point corresponds to a PWM. Source coordinates are AUC ROC values (a, b) or Pearson correlation coefficients (c) calculated for different data sets. ‘o’ HOCOMOCO and JASPAR PWMs, ‘x’ CIS-BP PWMs
Fig. 5
Fig. 5
Alluvial plots illustrating the performance of PWMs from particular CIS-BP TF families in ChIP-seq (a), SELEX 10% (b), and PBM (c) benchmarks. For each TF, PWMs with the highest average AUC ROC (a, b) or Pearson correlation coefficient (c) across the data sets for this TF are used to construct the links. PWMs grouped by CIS-BP TF family are shown on the left; TFs are shown on the right. The link width corresponds to the number of TFs. Only TFs with at least one ChIP-seq data set and one HT-SELEX data set are included. For illustration, selected motif families are highlighted with color
Fig. 6
Fig. 6
Alluvial plots illustrating the performance of PWMs from particular CIS-BP TF families in ChIP-seq (a), SELEX 10% (b), and PBM (c) benchmarks. For each TF, PWMs displaying the average AUC ROC of no less than 0.75 (a, b) or Pearson correlation coefficient of no less than 0.3 (c) across the data sets for this TF are selected for link construction. PWMs grouped by CIS-BP TF family are shown on the left; TFs are shown on the right. The link width is proportional to the square root of the number of appropriate PWM-TF pairs. Only TFs with at least one ChIP-seq data set and one HT-SELEX data set are included. For illustration, selected motif families are highlighted with color
Fig. 7
Fig. 7
Statistics on the best performing TF motif matrices. “Best performance per gene” means globally best performance over all corresponding ChIP-seq, HT-SELEX (top 10%), and PBM experiments in terms of aggregate rank scores (see the “Methods” section) over all corresponding experiments. The qualifier “filtered” relates to the numbers obtained when we only considered experiments for which at least one matrix achieved a ROC AUC value > 0.75 (ChIP-seq, HT-SELEX) or a Pearson correlation coefficient > 0.35 (PBM). The first three bar plots show the numbers for individual motif collections analyzed separately, whereas the last plot at the bottom shows the numbers obtained when all three collections were considered simultaneously
Fig. 8
Fig. 8
Violin plots of AUC ROC values obtained on ChIP-seq data sets for TFs of a particular TFClass family by PWMs belonging to TFs of the same family and representative motifs of the family selected using the PWM clustering-by-similarity. a Ets-related factors, b Forkhead box (FOX) factors, and c factors with multiple dispersed zinc fingers. All AUC ROC values are obtained using data sets of TFs from the selected family. The first 4 violins of each plot show AUC ROC values of (1) all PWMs of TFs from the selected family, (2) the best PWM (with the highest average AUC ROC) from the family, (3) the best PWM from all tested, and (4) family representatives obtained by the motif similarity clustering. The next violins of each plot show AUC ROC values achieved by particular representative PWMs belonging to the family and selected from the motif clustering by similarity

References

    1. Stormo GD. Modeling the specificity of protein-DNA interactions. Quant Biol Beijing China. 2013;1(2):115–130. doi: 10.1007/s40484-013-0012-4. - DOI - PMC - PubMed
    1. Johnson DS, Mortazavi A, Myers RM, Wold B. Genome-wide mapping of in vivo protein-DNA interactions. Science. 2007;316(5830):1497–1502. doi: 10.1126/science.1141319. - DOI - PubMed
    1. Hallikas O, Taipale J. High-throughput assay for determining specificity and affinity of protein-DNA binding interactions. Nat Protoc. 2006;1(1):215–222. doi: 10.1038/nprot.2006.33. - DOI - PubMed
    1. Berger MF, Bulyk ML. Universal protein-binding microarrays for the comprehensive characterization of the DNA-binding specificities of transcription factors. Nat Protoc. 2009;4(3):393–411. doi: 10.1038/nprot.2008.195. - DOI - PMC - PubMed
    1. Orenstein Y, Shamir R. Modeling protein-DNA binding via high-throughput in vitro technologies. Brief Funct Genomics. 2017;16(3):171–180. - PMC - PubMed

Publication types

Substances