. 2020 May 11;21(1):111.
doi: 10.1186/s13059-020-02015-1.

MOFA+: a statistical framework for comprehensive integration of multi-modal single-cell data

Affiliations

MOFA+: a statistical framework for comprehensive integration of multi-modal single-cell data

Ricard Argelaguet et al. Genome Biol. .

Abstract

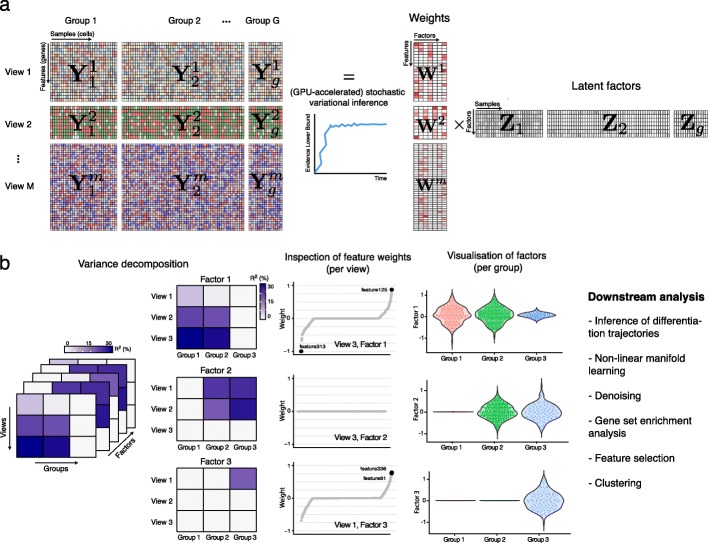
Technological advances have enabled the profiling of multiple molecular layers at single-cell resolution, assaying cells from multiple samples or conditions. Consequently, there is a growing need for computational strategies to analyze data from complex experimental designs that include multiple data modalities and multiple groups of samples. We present Multi-Omics Factor Analysis v2 (MOFA+), a statistical framework for the comprehensive and scalable integration of single-cell multi-modal data. MOFA+ reconstructs a low-dimensional representation of the data using computationally efficient variational inference and supports flexible sparsity constraints, allowing to jointly model variation across multiple sample groups and data modalities.

Keywords: Data integration; Factor analysis; Multi-omics; Single cell.


Conflict of interest statement

The authors declare that they have no competing interests.

Figures

Fig. 1
Fig. 1
Multi-Omics Factor Analysis v2 (MOFA+) provides an unsupervised framework for the integration of multi-group and multi-view single-cell data. a Model overview: the input consists of multiple data sets structured into M views and G groups. Views consist of non-overlapping sets of features that can represent different assays. Analogously, groups consist of non-overlapping sets of samples that can represent different conditions or experiments. Missing values are allowed in the input data. MOFA+ exploits the dependencies between the features to learn a low-dimensional representation of the data (Z) defined by K latent factors that capture the global sources of molecular variability. For each Factor, the weights (W) link the high-dimensional space with the low-dimensional manifold and provide a measure of feature importance. The sparsity-inducing priors on both the factors and the weights enable the model to disentangle variation that is unique to or shared across the different groups and views. Model inference can be significantly sped up using GPU-accelerated stochastic variational inference. b The trained MOFA+ model can be queried for a range of downstream analyses: variance decomposition, inspection of feature weights, gene set enrichment analysis, visualization of factors, sample clustering, inference of non-linear differentiation trajectories, denoising and feature selection
Fig. 2
Fig. 2
Integration of heterogeneous scRNA-seq experiments reveals stage-specific transcriptomic signatures associated with cell type commitment in mammalian development. a The heatmap displays the percentage of variance explained for each Factor (rows) in each group (pool of mouse embryos at a specific developmental stage, columns). b, c Characterization of Factor 1 as extra-embryonic (ExE) endoderm formation (b) and Factor 4 as Mesoderm commitment (c). In each panel, the top left plot shows the distribution of Factor values for each batch of embryos. Cells are colored by cell type. Line plots (top right) show the distribution of gene weights, with the top five genes with largest (absolute) weight highlighted. The bottom beeswarm plots represent the distribution of Factor values, with cells colored by the expression of the genes with highest weight. d Line plots show the percentage of variance explained (averaged across the two biological replicates) for each Factor as a function of time. The value of each replicate is shown as gray dots. e Dimensionality reduction using t-SNE on the inferred factors. Cells are colored by cell type
Fig. 3
Fig. 3
MOFA+ reveals context-dependent DNA methylation signatures associated with cellular diversity in the mammalian cortex. a Percentage of variance explained for each Factor across the different groups (cortical layer, x-axis) and views (genomic context, y-axis). For simplicity, only the first three factors are shown. b, c Characterization of (b) Factor 1 as the two major neuron populations and (c) Factor 3 as increased cellular diversity of excitatory neurons in deep cortical layers. The beeswarm plots show the distribution of Factor values for each group, defined as the neuron’s cortical layer. In the left plot, cells are colored by neuron class. In the middle and right plots, the cells are colored by average mCG and mCH levels (%), respectively, of the top 100 enhancers with the largest weights. d UMAP projection of the MOFA factors. Each dot represents a cell, colored by maximally resolved cell type assignments. e Correlation of enhancer mCG weights (x-axis) and mCH weights (y-axis) for Factor 1 (top) and Factor 3 (bottom)
Fig. 4
Fig. 4
MOFA+ integrates a multi-modal mouse gastrulation atlas to reveal epigenetic signatures associated with lineage commitment. a, b Characterization of Factor 1 as ExE endoderm formation and Factor 2 as Mesoderm commitment. Top left plot shows the percentage of variance explained by the Factor across the different views (rows) and groups (embryonic stages, as columns). Bottom left plot shows the distribution of Factor values for each stage, colored by cell type assignment. Histograms display the distribution of DNA methylation and chromatin accessibility weights for promoters and enhancer elements. c Dimensionality reduction using t-SNE on the inferred MOFA factors. Cells are colored by cell type. d Same as (c), but cells are colored by Factor 1 values (top left) and Factor 2 values (bottom left); by the DNA methylation levels of the enhancers with the largest weight in Factor 1 (top middle) and Factor 2 (bottom middle); by the chromatin accessibility levels of the enhancers with the largest weight in Factor 1 (top right) and Factor 2 (bottom right)

References

    1. Griffiths JA, Scialdone A, Marioni JC. Using single-cell genomics to understand developmental processes and cell fate decisions. Mol Syst Biol. 2018;14:e8046. doi: 10.15252/msb.20178046. - DOI - PMC - PubMed
    1. Papalexi E, Satija R. Single-cell RNA sequencing to explore immune cell heterogeneity. Nat Rev Immunol. 2018;18:35–45. doi: 10.1038/nri.2017.76. - DOI - PubMed
    1. Wills QF, Mead AJ. Application of single-cell genomics in cancer: promise and challenges. Hum Mol Genet. 2015;24:R74–R84. doi: 10.1093/hmg/ddv235. - DOI - PMC - PubMed
    1. Patel AP, Tirosh I, Trombetta JJ, Shalek AK, Gillespie SM, Wakimoto H, et al. Single-cell RNA-seq highlights intratumoral heterogeneity in primary glioblastoma. Science. 2014;344:1396–1401. doi: 10.1126/science.1254257. - DOI - PMC - PubMed
    1. Mulqueen RM, Pokholok D, Norberg SJ, Torkenczy KA, Fields AJ, Sun D, et al. Highly scalable generation of DNA methylation profiles in single cells. Nat Biotechnol. 2018;36:428–431. doi: 10.1038/nbt.4112. - DOI - PMC - PubMed

Publication types

LinkOut - more resources