. 2020 May 11;21(1):112.
doi: 10.1186/s13059-020-02032-0.

Sampling time-dependent artifacts in single-cell genomics studies

Affiliations

Sampling time-dependent artifacts in single-cell genomics studies

Ramon Massoni-Badosa et al. Genome Biol. .

Abstract

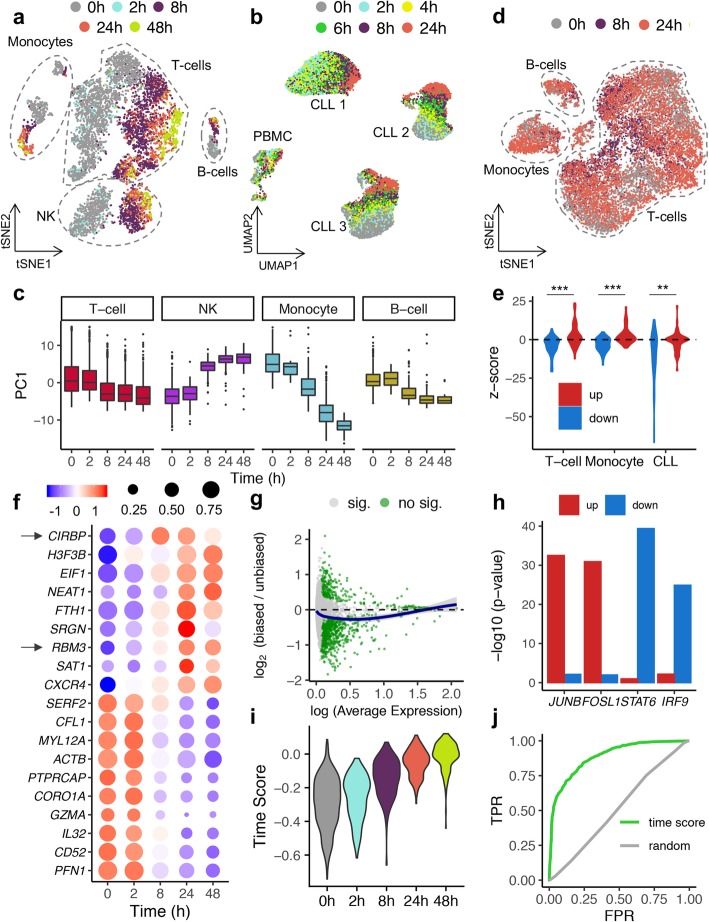
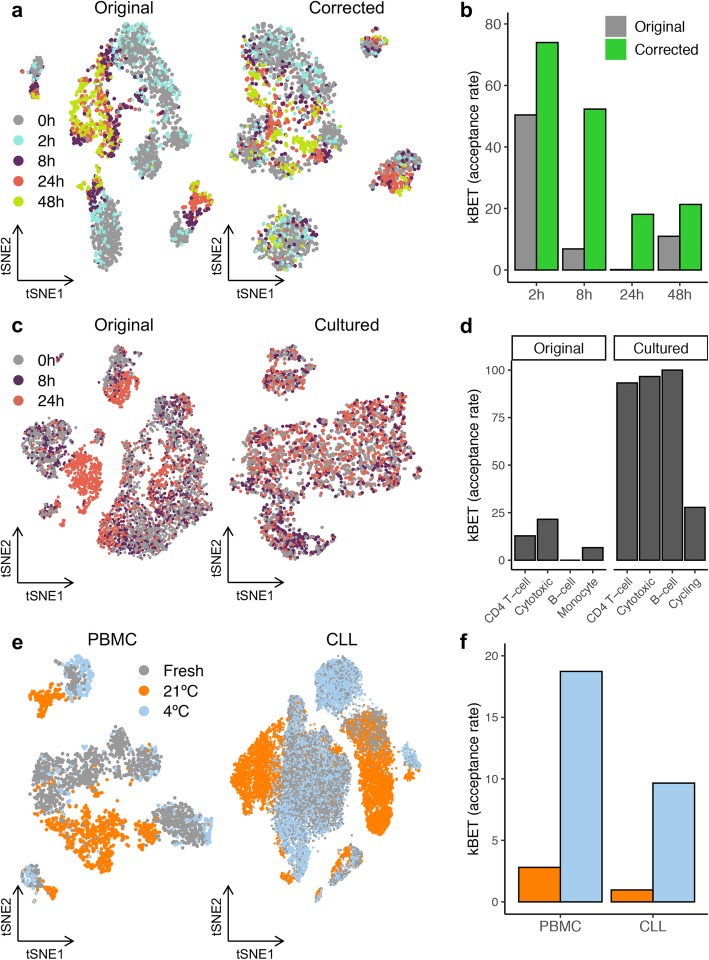
Robust protocols and automation now enable large-scale single-cell RNA and ATAC sequencing experiments and their application on biobank and clinical cohorts. However, technical biases introduced during sample acquisition can hinder solid, reproducible results, and a systematic benchmarking is required before entering large-scale data production. Here, we report the existence and extent of gene expression and chromatin accessibility artifacts introduced during sampling and identify experimental and computational solutions for their prevention.

Keywords: Benchmarking; Biobank; CLL; Chronic lymphocytic leukemia; Cryopreservation; PBMC; Peripheral blood mononuclear cells; RNA sequencing; Sampling; Single-cell.


Conflict of interest statement

The authors declare no conflict of interest.

Figures

Fig. 1
Fig. 1
The impact of sampling time on single-cell transcriptional and open chromatin profiles. a, b scRNA-seq-based tSNE or UMAP embeddings of 7378 PBMC (a, male donor) and 22,443 CLL cells (b, 3 donors) color-coded by sampling time. c Distribution of the first principal component (PC1) across processing times computed for each PBMC subtype independently. d scATAC-seq-based UMAP embedding color-coded by sampling time and highlighting major PBMC cell types. Unlabeled cluster corresponds to cells of unknown type. e Violin plot showing changes in RNA expression for the 50 genes associated with the top 50 distal (enhancer) peaks changing in accessibility (down: closing sites; up: opening sites); p value in Z score scale, Wilcoxon test *p < 0.05, **p < 0.01, ***p < 0.001. f Dot plot representing the time-dependent expression changes of the top up- and downregulated genes with a minimum log (expression) of 0.5, a minimum absolute log fold-change of 0.2 and an adjusted p value < 0.001. The arrows highlight the cold-inducible response binding protein (CIRBP) and the RNA Binding Motif Protein 3 (RBM3) genes. g M (log ratio)-A (mean average) plot showing the log2 fold-change between biased (> 2 h) and unbiased (≤ 2 h) PBMC as a function of the log average expression (Scran normalized expression values). Significant genes are colored in green (adjusted p value < 0.001), and a locally estimated scatterplot smoothing (LOESS) line is drawn in blue. h Motif enrichment analysis performed over the DNA sequences of the top 50 distal peaks with a change in accessibility (same peaks as e). i Time score distribution across processing times (female donor) calculated with the sampling time signature defined in the male PBMC donor. j Receiver operating characteristic (ROC) curve displaying the performance of a logistic regression model in classifying “biased” and “unbiased” PBMC
Fig. 2
Fig. 2
Solutions to correct or prevent sampling time-induced artifacts. a tSNEs displaying the effect of varying processing times on the transcriptome profiles of 7378 PBMC before (left) and after (right) regressing out the time score for every highly variable gene. b kBET acceptance score distribution across sampling times with or without the computational correction. c tSNE showing the effect of PBMC culturing and activation with anti-CD3 Dynabeads over 2 days. d kBET acceptance score distribution across cell types with or without cell culture/activation. e tSNE highlighting the sampling effect between cells cryopreserved immediately (fresh, 0 h) or after 24 h and 48 h stored cold (4 °C) or at RT (21 °C). f kBET acceptance score distribution across storage temperatures

Similar articles

Cited by

References

    1. Peakman TC, Elliott P. The UK Biobank sample handling and storage validation studies. Int J Epidemiol. 2008;37(Suppl 1):i2–i6. doi: 10.1093/ije/dyn019. - DOI - PubMed
    1. Elliott P, Peakman TC, UK biobank The UK Biobank sample handling and storage protocol for the collection, processing and archiving of human blood and urine. Int J Epidemiol. 2008;37:234–244. doi: 10.1093/ije/dym276. - DOI - PubMed
    1. Guillaumet-Adkins A, Rodríguez-Esteban G, Mereu E, Mendez-Lago M, Jaitin DA, Villanueva A, et al. Single-cell transcriptome conservation in cryopreserved cells and tissues. Genome Biol. 2017;18:45. doi: 10.1186/s13059-017-1171-9. - DOI - PMC - PubMed
    1. Regev A, Teichmann SA, Lander ES, Amit I, Benoist C, Birney E, et al. Science forum: the human cell atlas. eLife. 2017;6:e27041. doi: 10.7554/eLife.27041. - DOI - PMC - PubMed
    1. van der Wijst M, de Vries D, Groot H, Trynka G, Hon C, Bonder M, et al. The single-cell eQTLGen consortium. Pérez Valle H, Rodgers P, Montgomery SB, Fagny M, editors. eLife. 2020;9:e52155. - PMC - PubMed

Publication types