

Spatial variation in the frequency of knockdown resistance genotypes in Florida Aedes aegypti populations
- PMID: 32393364
- PMCID: PMC7216362
- DOI: 10.1186/s13071-020-04112-3
Spatial variation in the frequency of knockdown resistance genotypes in Florida Aedes aegypti populations
Abstract
Background: The development of insecticide resistance in disease-vectoring mosquito species can lead to vector control failure and disease resurgence. However, insecticide applications remain an essential public health intervention. In Florida, insecticide resistance in Aedes aegypti, an anthropophilic mosquito species capable of transmitting dengue, chikungunya, and Zika virus, is a major concern. Understanding the location, scale, and driving factors of insecticide resistance can enhance the ability of vector control organizations to target populations effectively.
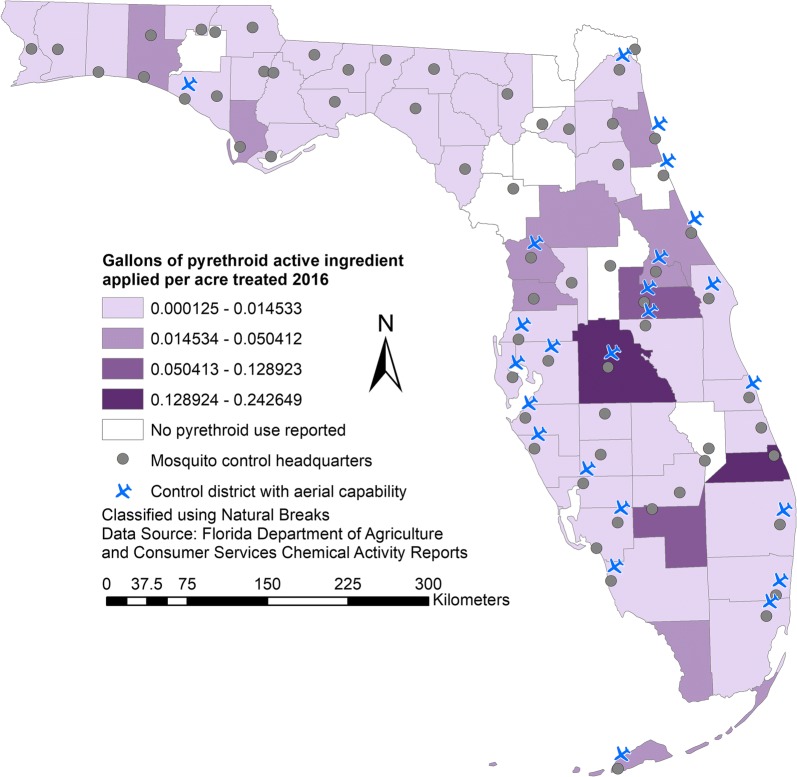
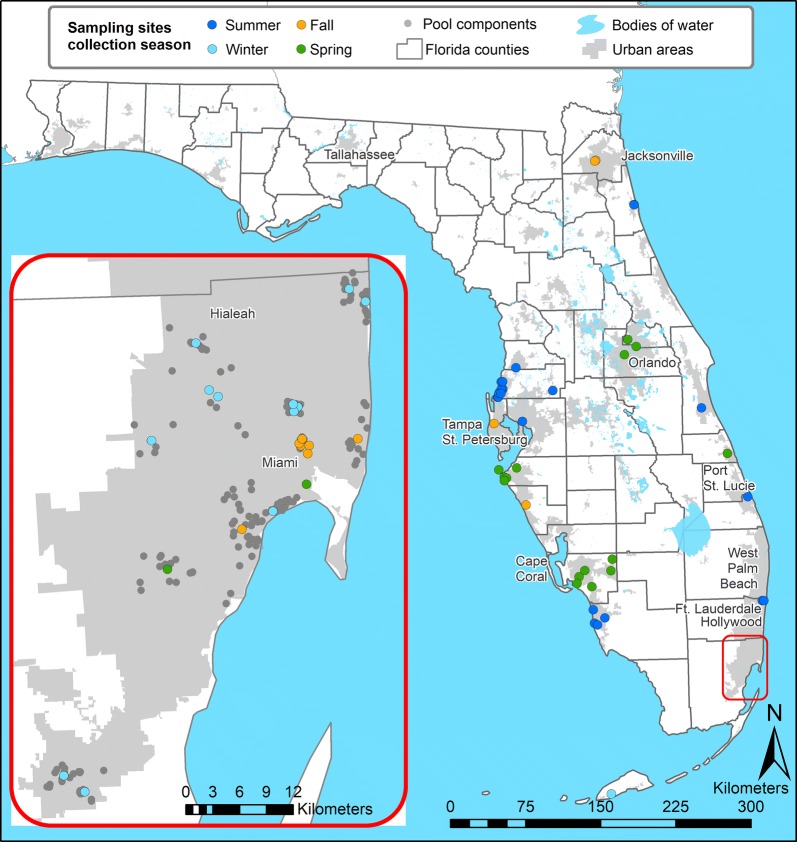
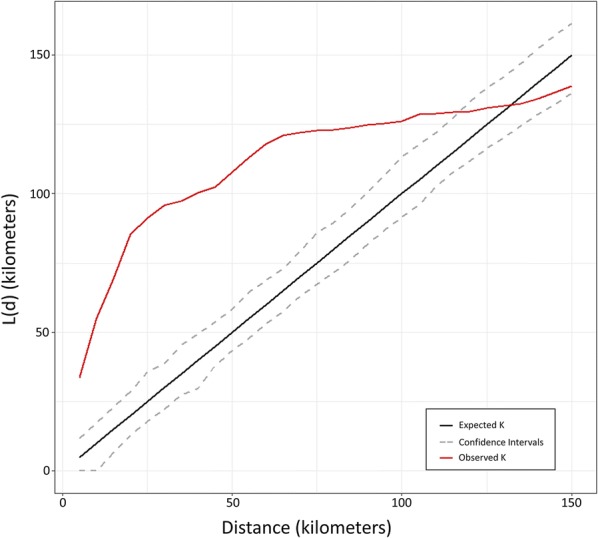
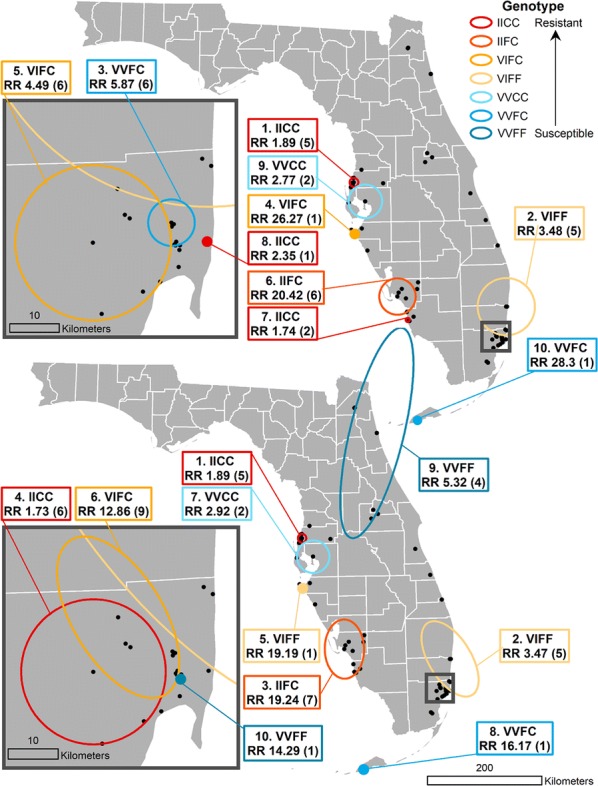
Methods: We used previously collected data on frequencies of mutations that confer resistance to commonly used pyrethroid insecticides in Ae. aegypti specimens from 62 sites distributed across 18 counties in Florida. To determine the scale of clustering for the most resistant variant, we used a Ripley's K function. We also used a spatial scanning statistic technique to identify locations of clusters where higher than expected frequencies of susceptible or resistant mosquitoes occurred. We then tested for associations between landscape, demographic, and insecticide-use factors using a beta regression modelling approach and evaluated the effect of spatial lag and spatial error terms on overall explanatory power of these models.
Results: The scale at which maximum clustering of the most resistant variant occurs is approximately 20 kilometers. We identified statistically significant clusters of genotypes associated with resistance in several coastal cities, although some of these clusters were near significant clusters of susceptible mosquitoes, indicating selection pressures vary at the local scale. Vegetation density, distance from roads, and pyrethroid-use by vector control districts were consistently significant predictors of knockdown resistance genotype frequency in the top-performing beta regression models, although pyrethroid use surprisingly had a negatively associated with resistance. The incorporation of spatial lags resulted in improvements to the fit and explanatory power of the models, indicating an underlying diffusion process likely explains some of the spatial patterns observed.
Conclusions: The genetic mutations that confer resistance to pyrethroids in Ae. aegypti mosquitoes in Florida exhibit spatial autocorrelation and patterns that can be partially explained by landscape and insecticide-use factors. Further work at local scales should be able to identify the mechanisms by which these variables influence selection for alleles associated with resistance.
Keywords: Aedes aegypti; Beta regression; Insecticide resistance; Knockdown resistance; Spatial scan statistic.
Conflict of interest statement
The authors declare that they have no competing interests.
Figures
References
MeSH terms
Substances
Grants and funding
LinkOut - more resources
Full Text Sources
