. 2020 Jun 16;133(12):jcs243071.
doi: 10.1242/jcs.243071.

AURKA destruction is decoupled from its activity at mitotic exit but is essential to suppress interphase activity

Affiliations

AURKA destruction is decoupled from its activity at mitotic exit but is essential to suppress interphase activity

Ahmed Abdelbaki et al. J Cell Sci. .

Abstract

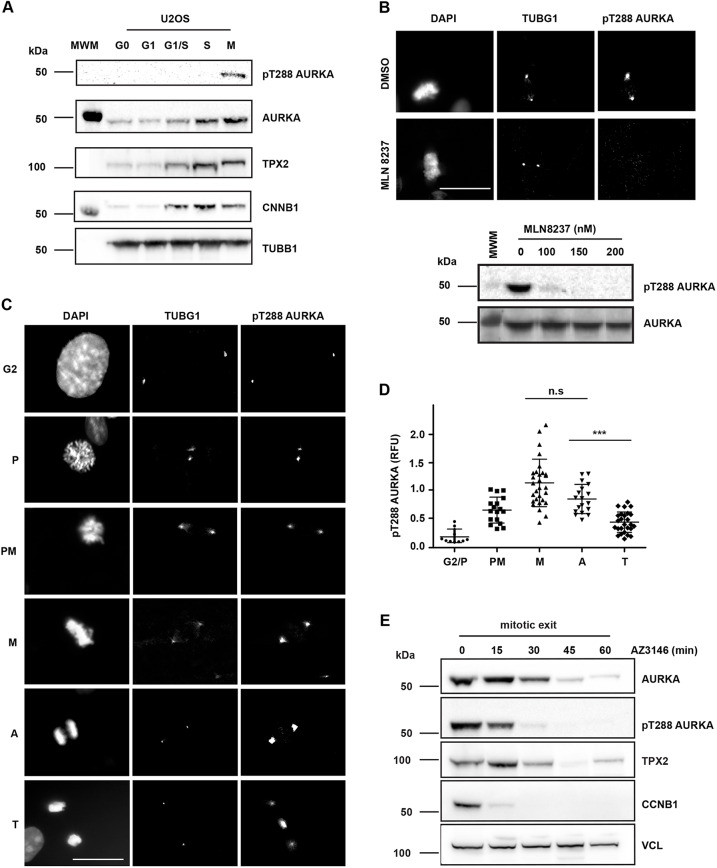
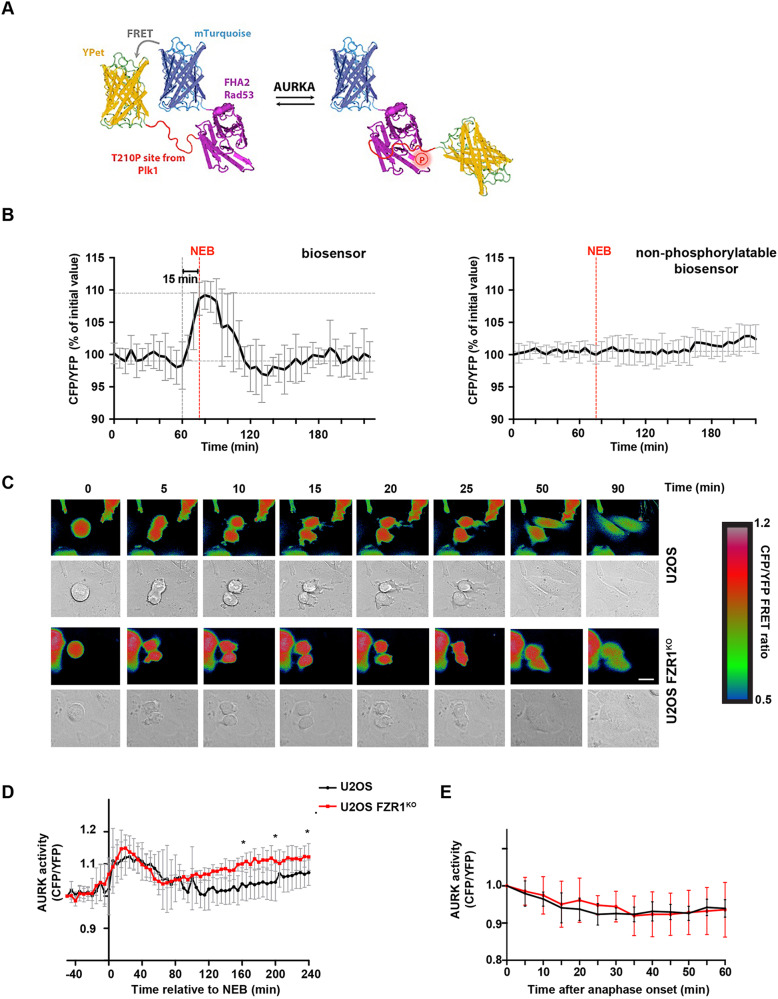
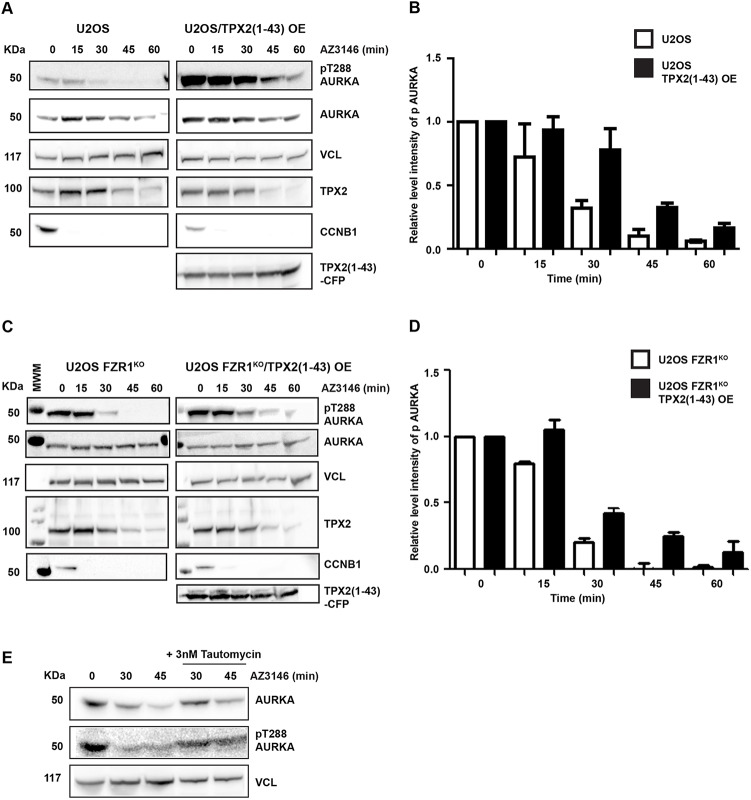
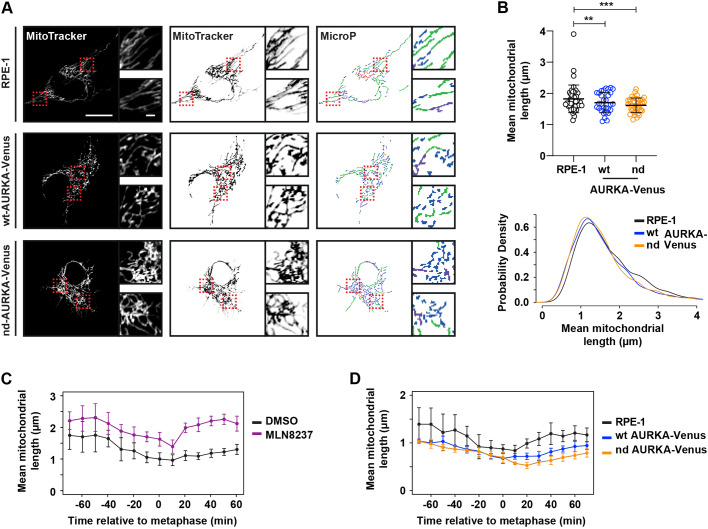
Activity of AURKA is controlled through multiple mechanisms including phosphorylation, ubiquitin-mediated degradation and allosteric interaction with TPX2. Activity peaks at mitosis, before AURKA is degraded during and after mitotic exit in a process strictly dependent on the APC/C coactivator FZR1. We used FZR1 knockout cells (FZR1KO) and a novel FRET-based AURKA biosensor to investigate how AURKA activity is regulated in the absence of destruction. We found that AURKA activity in FZR1KO cells dropped at mitotic exit as rapidly as in parental cells, despite absence of AURKA destruction. Unexpectedly, TPX2 was degraded normally in FZR1KO cells. Overexpression of an N-terminal TPX2 fragment sufficient for AURKA binding, but that is not degraded at mitotic exit, caused delay in AURKA inactivation. We conclude that inactivation of AURKA at mitotic exit is determined not by AURKA degradation but by degradation of TPX2 and therefore is dependent on CDC20 rather than FZR1. The biosensor revealed that FZR1 instead suppresses AURKA activity in interphase and is critically required for assembly of the interphase mitochondrial network after mitosis.This article has an associated First Person interview with the first authors of the paper.

Keywords: Aurora A kinase; Cdh1; FZR1; Mitochondria; Mitosis; TPX2.


Conflict of interest statement

Competing interestsThe authors declare no competing or financial interests.

Figures

Fig. 1.
Fig. 1.
Inactivation of AURKA during mitotic exit begins at anaphase. (A) pT288 antibody detects active phosphorylated AURKA only in mitotic cells. U2OS cells were synchronized as described in the Materials and Methods and blotted for pT288, total AURKA and other mitotic markers (TPX2, CNNB1 and TUBB1). MWM indicates molecular weight marker lane. (B) pT288 signal is sensitive to the AURKA-specific inhibitor MLN8237, as shown by IF of mitotic cells from a MeOH-fixed unsynchronized population (upper panel) or by immunoblot of STLC-arrested mitotic cells treated for 3 h at the indicated doses (lower panel). AURKA-specific pT288 signal is restricted to centrosomes and spindle pole bodies (marked by γ-tubulin, TUBG1). DNA is shown by DAPI staining. DMSO indicates images of vehicle-treated control cells. MWM indicates molecular weight marker lane. See also Fig. S1. (C–E) Quantification of pT288-AURKA during mitotic exit. In C and D, unsynchronized cell populations were fixed and stained as in B. Cells were judged to be at different stages of mitosis according to DAPI staining (C) and scored for mean pT288 AURKA signal measured in a fixed region of interest centered on TUBG1 signal at centrosomes or spindle poles (D). Scatter plots show distribution and mean±s.d. of pooled data from two independent experiments. Data are normalized to the mean value at metaphase. The plot is representative of two biological replicates. G2 and prophase (P), n=10; prometaphase (PM), n=15; metaphase (M), n=30; anaphase (A), n=30 and telophase (T), n=26. M versus A, not significant (n.s.); A versus T, P<0.0001 (***); Student's t-test. RFU, relative fluorescence units. For the western blots shown in E, cells were synchronized in 5 μM STLC and released by checkpoint inhibition using 10 μM AZ3146, with extracts harvested at the times indicated. These were examined by immunoblotting for AURKA, pT288-AURKA and TPX2 levels. Disappearance of cyclin B1 (CCNB1) acts as marker for mitotic exit, and the level of vinculin (VCL) acts as loading control. Data shown in A is from a single experiment, data shown in B and E are representative of two experiments. Scale bars: 10 μm.
Fig. 2.
Fig. 2.
AURKA destruction is not required for pT288-AURKA down-regulation at mitotic exit. (A,B) There is no mitotic exit destruction of AURKA in FZR1 KO cells (FZR1KO). AURKA–Venus (A) or H2B–GFP (B) were transiently transfected into both U2OS and U2OS FZR1KO cells. In A, quantifications of total fluorescence measurements from single mitotic cells were used to generate degradation curves for AURKA–Venus. Fluorescence values for individual curves were normalized to the last frame before anaphase onset, and all curves were in silico synchronized to anaphase. n=10 cells. Data are mean±s.d. In B, H2B–GFP fluorescence was used to score DNA as condensed or decondensed in cells undergoing mitotic exit (example shown in lower panels). Percentage of cells with condensed DNA over time was plotted as a measure of cumulative mitotic exit. n≥10 cells. (C–E) AURKA activity scored by pT288 is not affected by FZR1KO during mitotic exit. For the western blots in C, U2OS and FZR1KO cells were synchronized to prometaphase using 5 μM STLC and released by checkpoint inhibition using 10 μM AZ3146, with extracts harvested at the times indicated. Lysates were analysed by immunblot with antibodies against AURKA, pT288-AURKA and other mitotic regulators and are representative of three independent experiments. D and E show AURKA and pT288-AURKA staining associated with individual centrosomes/spindle poles in metaphase (M) versus telophase (T) cells (left-hand panels). Fluorescence values were measured as in Fig. 1 and are presented as scatter plots, with mean±s.d. indicated, for total AURKA (D) and pT288-AURKA (E) in both U2OS and FZR1KO. All values were normalized to the mean value from control metaphase cells. ns, not significant; **P<0.001; ***P<0.0001 (Student's t-test). D, n≥11 from one experiment; E, n≥23 from two experiments. Scale bars: 10 μm.
Fig. 3.
Fig. 3.
A FRET-based biosensor records unaltered parameters of mitotic AURKA activation and inactivation in FZR1KO cells. (A) Schematic illustration of the AURKA biosensor showing high FRET (left) versus low FRET state (right). (B) Inverted FRET measurements (CFP/YFP emission) from timelapse movies of cells expressing the biosensor, or a non-phosphorylatable version, show that the biosensor reports on mitotic phosphorylation events, n≥8. Data are mean±s.d. Further characterization of the specificity of the biosensor is shown in Fig. S4. (C) Examples of inverted false-coloured FRET ratio of biosensor-expressing single U2OS and FZR1KO cells passing through mitosis. High FRET (blue) reports on the non-phosphorylated state, whereas low FRET (red) reports on the phosphorylated probe. Scale bar: 10 μm. (D,E) FRET ratio values measured using the biosensor show that total Aurora kinase (AURK) activity is normally regulated through mitosis in FZR1KO cells but rises again in G1 phase (*P<0.05, Student's t-test). In D, cells are in silico synchronized to NEB. In E, cells are in silico synchronized and FRET values normalized to anaphase onset. Data are mean±s.d. of n=8 cells.
Fig. 4.
Fig. 4.
AURKA inactivation is controlled through TPX2. U2OS (A,B) and FZR1KO (C,D) cells were transfected with TPX2(1–43)–CFP and synchronized through mitotic exit as described in the legend to Fig. 2. Quantitative immunoblotting of cell lysates shows that loss of pT288-AURKA during mitotic exit is delayed in the presence of TPX2(1–43) in both parental and FZR1KO cells. Cyclin B1 (CCNB1) is used as a marker for mitotic exit, level of vinculin (VCL) is shown as a loading control. MWM indicates molecular weight marker lane. Bar charts (B,D) show pT288 signal normalized against vinculin. Results presented are mean±s.d. values from three independent experiments. (E) AURKA inactivation is phosphatase-dependent. U2OS cells undergoing mitotic exit were treated with 3 nM PP1 inhibitor tautomycin 10 min after relief of SAC arrest by AZ3146. Lysates harvested at the indicated time points after AZ3146 treatment were subject to immunoblot analysis. Blots shown are representative of two independent experiments.
Fig. 5.
Fig. 5.
Destruction of AURKA by APC/C–FZR1 is required to control interphase activity of AURKA. (A) The FRET biosensor reveals raised Aurora kinase activity in interphase FZR1KO cells. Cells were synchronized in G1/S using double thymidine block and treated (or not) for 3 h with 100 nM AURKA inhibitor MLN8237. Scatter plots show CFP/YFP emission ratios with mean±s.d. from individual cells in U2OS and FZR1KO populations (n=20; P<0.05, Student's t-test) and are representative of two independent experiments. (B) pT288 staining in fixed cells synchronized at G1/S, and scatter plots of centrosomal pT288 signal quantified as in Fig. 1, show that pT288 can be detected at centrosomes of G1/S FZR1KO cells, but not at centrosomes of parental U2OS cells. n≥21, ***P≤0.0001 (Student's t-test). RFU, relative fluorescence units. Scale bar: 10 μm. (C–F) Mitochondria are over-fragmented in interphase FZR1KO cells in an AURKA-sensitive manner. U2OS and FZR1KO cells were synchronized in G1/S then stained with MitoTracker™ and imaged live (C). FZR1KO cells were treated with DMSO or 100 nM MLN8237 for 3 h (D). Numbered boxes indicate the regions shown in magnified images. Scale bars: 10 μm. (E) Quantitative analyses of fragmented mitochondria length was carried out as described in the Materials and Methods and are presented as scatter plots with mean±s.d. indicated (n≥15 cells; ***P<0.001 by two-tailed Mann–Whitney U-test), whilst (F) percentages of tubular versus fragmented morphologies were calculated using MicroP software and are presented as mean±s.d. (n≥15). (G,H) Immunoblotting U2OS and FZR1KO cells shows that DRP1 levels, unlike those of AURKA, are not altered in G1/S FZR1KO cells (G), even though DRP1 undergoes modest degradation during mitotic exit (H). GAPDH is shown as a loading control. MWM indicates molecular weight marker lane. Blots shown in G,H are representative of two independent experiments.
Fig. 6.
Fig. 6.
Undegraded AURKA at mitotic exit inhibits reassembly of the interphase mitochondrial network. (A,B) RPE-1, RPE-1 WT-AURKA–Venus and non-degradable version (nd, Δ32–66) cell lines were stained with MitoTracker™ and imaged 24 h after induction of AURKA transgene expression. Acquired images were analysed with MicroP (A) and subjected to mitochondria length quantifications (B). Dashed boxes indicate regions shown in magnified images. Inverted images (A, middle) and output of MicroP length analysis (A, right) are shown. Scatter plots show mean±s.d. for mean mitochondrial lengths from 30 mitochondria per cell in 18–24 cells per condition from two experimental replicates (upper panel). P-values are calculated from raw measurements using a Mann–Whitney test: **P<0.001; ***P<0.0001; n≥600. Lower panel shows kernel density plots of raw data. Scale bars: 10 μm in large panels, 1μm in inset panels. (C) RPE1 cells treated with either DMSO or 100 nM MLN8237 were stained with MitoTracker™ and filmed live as they progressed through mitosis. Mean±s.d. mitochondrial length over time is plotted for n≥6 cells per condition in two experimental replicates. (D) RPE-1 WT-AURKA–Venus and nd-AURKA–Venus cells were stained with MitoTracker™, then filmed and analysed as in C. Data are mean±s.d. of n≥5 cells.

References

    1. Afonso O., Figueiredo A. C. and Maiato H. (2017). Late mitotic functions of Aurora kinases. Chromosoma 126, 93-103. 10.1007/s00412-016-0594-5 - DOI - PubMed
    1. Afonso O., Castellani C. M., Cheeseman L. P., Ferreira J. G., Orr B., Ferreira L. T., Chambers J. J., Morais-de-Sa E., Maresca T. J. and Maiato H. (2019). Spatiotemporal control of mitotic exit during anaphase by an aurora B-Cdk1 crosstalk. eLife 8, e47646 10.7554/eLife.47646 - DOI - PMC - PubMed
    1. Asteriti I. A., Rensen W. M., Lindon C., Lavia P. and Guarguaglini G. (2010). The Aurora-A/TPX2 complex: a novel oncogenic holoenzyme? Biochim. Biophys. Acta 1806, 230-239. 10.1016/j.bbcan.2010.08.001 - DOI - PubMed
    1. Asteriti I. A., Di Cesare E., De Mattia F., Hilsenstein V., Neumann B., Cundari E., Lavia P. and Guarguaglini G. (2014). The Aurora-A inhibitor MLN8237 affects multiple mitotic processes and induces dose-dependent mitotic abnormalities and aneuploidy. Oncotarget 5, 6229-6242. 10.18632/oncotarget.2190 - DOI - PMC - PubMed
    1. Barr A. R. and Gergely F. (2007). Aurora-A: the maker and breaker of spindle poles. J. Cell Sci. 120, 2987-2996. 10.1242/jcs.013136 - DOI - PubMed

Publication types

MeSH terms

Substances