. 2020 May 26;117(21):11674-11684.
doi: 10.1073/pnas.1921015117. Epub 2020 May 11.

The PDK1-FoxO1 signaling in adipocytes controls systemic insulin sensitivity through the 5-lipoxygenase-leukotriene B4 axis

Affiliations

The PDK1-FoxO1 signaling in adipocytes controls systemic insulin sensitivity through the 5-lipoxygenase-leukotriene B4 axis

Tetsuya Hosooka et al. Proc Natl Acad Sci U S A. .

Abstract

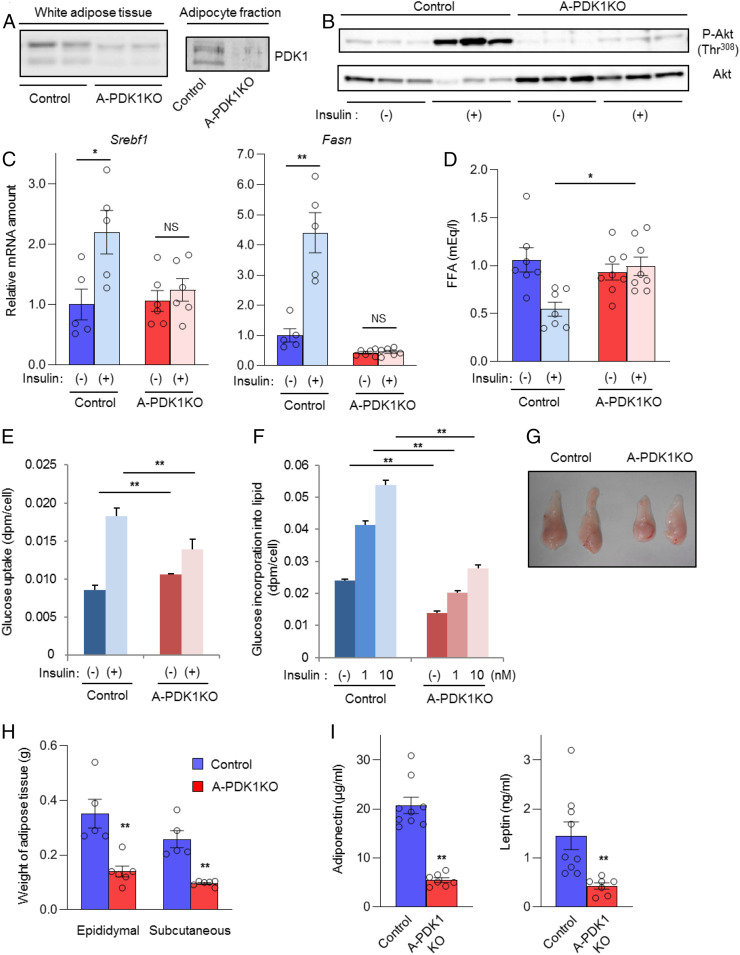
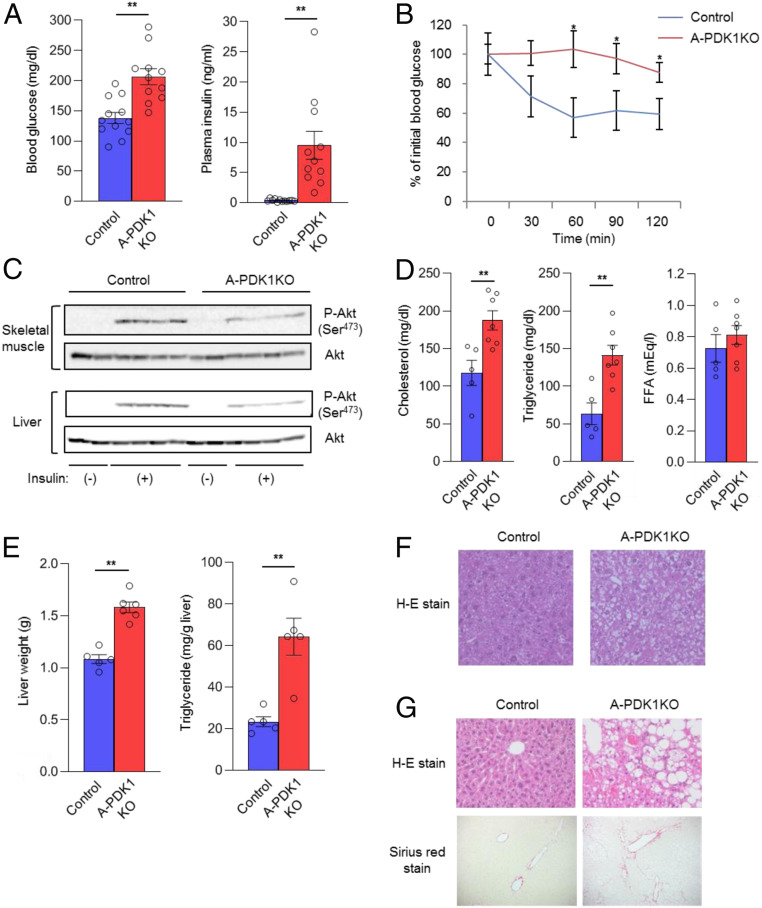
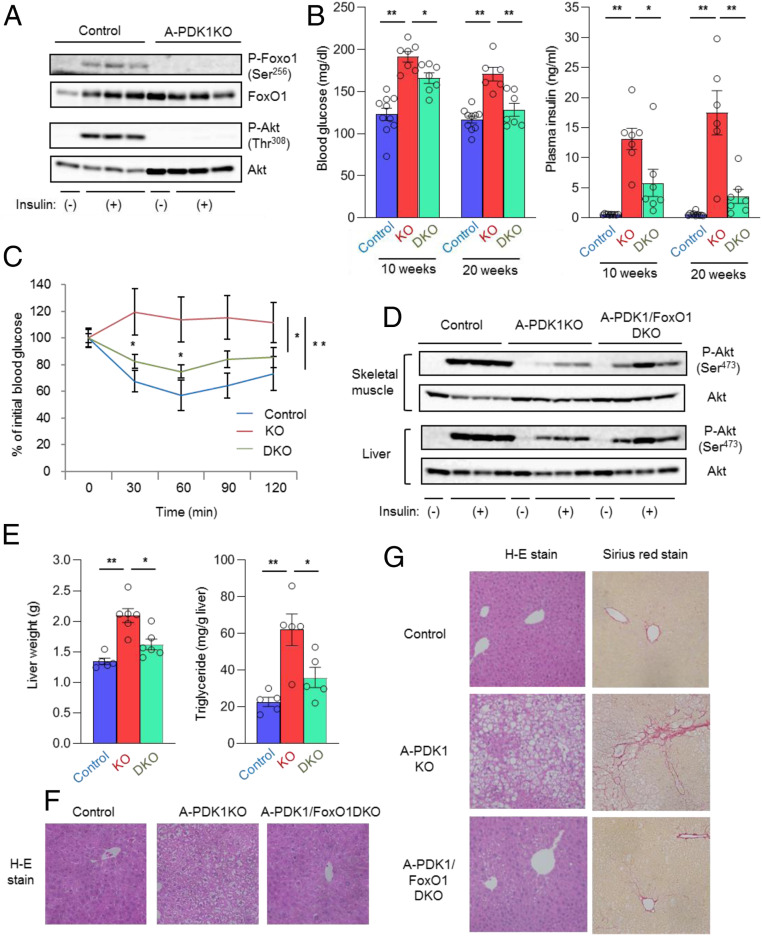
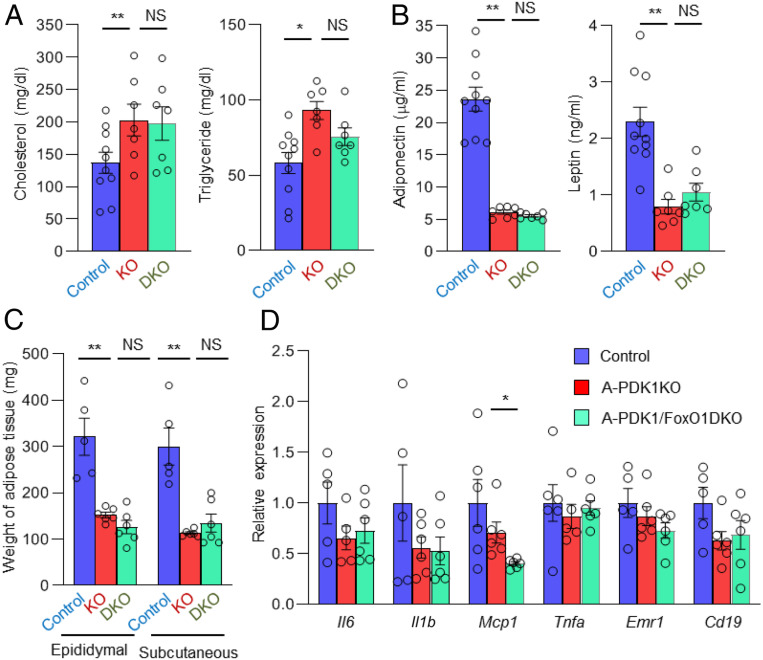
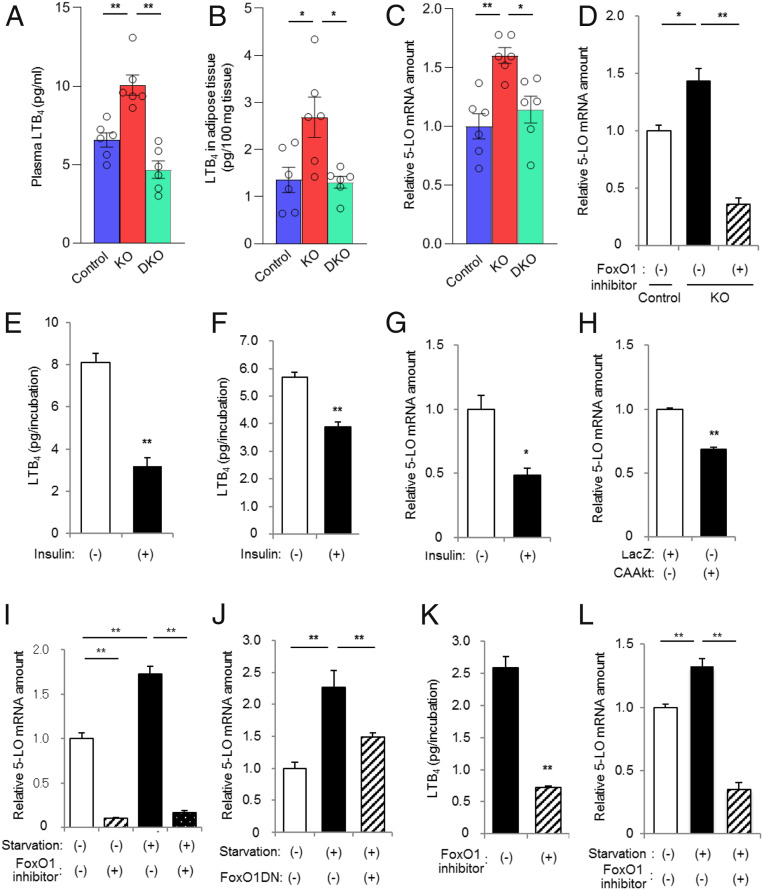
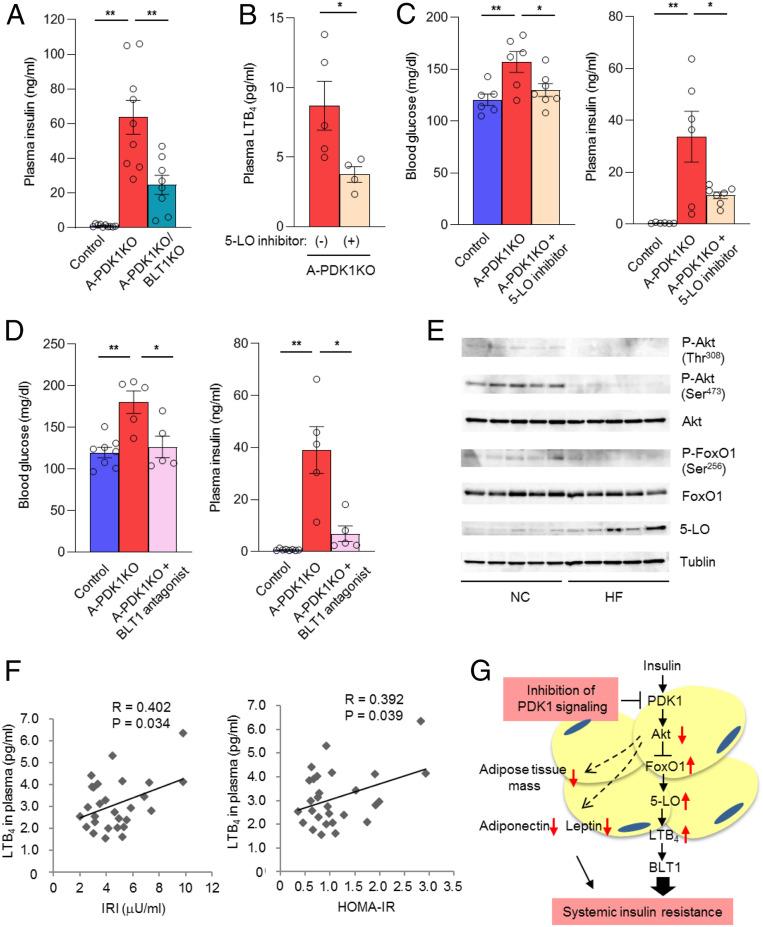
Although adipocytes are major targets of insulin, the influence of impaired insulin action in adipocytes on metabolic homeostasis remains unclear. We here show that adipocyte-specific PDK1 (3'-phosphoinositide-dependent kinase 1)-deficient (A-PDK1KO) mice manifest impaired metabolic actions of insulin in adipose tissue and reduction of adipose tissue mass. A-PDK1KO mice developed insulin resistance, glucose intolerance, and hepatic steatosis, and this phenotype was suppressed by additional ablation of FoxO1 specifically in adipocytes (A-PDK1/FoxO1KO mice) without an effect on adipose tissue mass. Neither circulating levels of adiponectin and leptin nor inflammatory markers in adipose tissue differed between A-PDK1KO and A-PDK1/FoxO1KO mice. Lipidomics and microarray analyses revealed that leukotriene B4 (LTB4) levels in plasma and in adipose tissue as well as the expression of 5-lipoxygenase (5-LO) in adipose tissue were increased and restored in A-PDK1KO mice and A-PDK1/FoxO1KO mice, respectively. Genetic deletion of the LTB4 receptor BLT1 as well as pharmacological intervention to 5-LO or BLT1 ameliorated insulin resistance in A-PDK1KO mice. Furthermore, insulin was found to inhibit LTB4 production through down-regulation of 5-LO expression via the PDK1-FoxO1 pathway in isolated adipocytes. Our results indicate that insulin signaling in adipocytes negatively regulates the production of LTB4 via the PDK1-FoxO1 pathway and thereby maintains systemic insulin sensitivity.

Keywords: 5-lipoxygenase; FoxO1; PDK1; insulin resistance; leukotriene B4.


Conflict of interest statement

The authors declare no competing interest.

Figures

Fig. 1.
Fig. 1.
Impaired insulin action in adipocytes of A-PDK1KO mice. (A) Immunoblot analysis of PDK1 in epididymal adipose tissue and in the adipocyte fraction of this tissue from control (PDK1flox/flox) and A-PDK1KO mice. (B) Immunoblot analysis of total and Thr308-phosphorylated (P-) forms of Akt in epididymal adipose tissue isolated from control or A-PDK1KO mice (n = 3) at 10 min after i.p. injection of insulin (5 U/kg) or vehicle. (C) RT and real-time PCR analysis of Srebf1 and Fasn expression in epididymal adipose tissue isolated from control or A-PDK1KO mice (n = 5 or 6) at 6 h after i.p. injection of insulin (1 U/kg) or vehicle. (D) Plasma FFA concentration in control or A-PDK1KO mice (n = 7 or 8) measured 1 h after i.p. injection of insulin (1 U/kg) or vehicle. (E) Basal and insulin (1 nM)-stimulated glucose uptake in isolated adipocytes from control or A-PDK1KO mice (n = 3). (F) Basal and insulin-stimulated lipogenesis in isolated adipocytes from control or A-PDK1KO mice (n = 3). (G) Representative images of epididymal adipose tissue and (H) weight of epididymal or subcutaneous (s.c.) adipose tissue from control or A-PDK1KO mice (n = 5 or 6). (I) Plasma adiponectin and leptin concentrations in control or A-PDK1KO mice (n = 7 to 9). All quantitative data are means ± SEM; *P < 0.05, **P < 0.01 for the indicated comparisons or versus corresponding control value (Student’s t test); NS, not significant.
Fig. 2.
Fig. 2.
Systemic insulin resistance and metabolic abnormalities in A-PDK1KO mice. (A) Blood glucose and plasma insulin concentrations for control or A-PDK1KO mice (n = 11 or 12) in the randomly fed state. (B) Insulin tolerance test for control or A-PDK1KO mice (n = 7 or 8). (C) Immunoblot analysis of total and Ser473-phosphorylated forms of Akt in liver and skeletal muscle isolated from control or A-PDK1KO mice at 10 min after i.p. injection of insulin (5 U/kg) or vehicle. (D) Plasma cholesterol, triglyceride, and FFA concentrations in control or A-PDK1KO mice (n = 5 to 7). (E) Weight and triglyceride content of the liver from control or A-PDK1KO mice (n = 5 or 6). (F) H&E staining of liver sections from 11-wk-old control or A-PDK1KO mice. (Original magnification: 200×.) (G) H&E (Upper) and Sirius red (Lower) staining of liver sections from 35- to 37-wk-old control or A-PDK1KO mice. (Original magnification: 200×.) All quantitative data are means ± SEM; *P < 0.05, **P < 0.01 for the indicated comparisons or versus corresponding control value (Student’s t test).
Fig. 3.
Fig. 3.
Additional ablation of FoxO1 in adipocytes ameliorates metabolic abnormalities of A-PDK1KO mice. (A) Immunoblot analysis of total and Ser256-phosphorylated forms of FoxO1 as well as of total and Thr308-phosphorylated forms of Akt in epididymal adipose tissue of control and A-PDK1KO mice at 10 min after i.p. injection of insulin (5 U/kg) or vehicle. (B) Blood glucose and plasma insulin concentrations in control, A-PDK1KO, or A-PDK1/FoxO1DKO mice at 10 or 20 wk of age (n = 6 to 10). (C) Insulin tolerance test in control, A-PDK1KO, or A-PDK1/FoxO1DKO mice (n = 6 to 8). (D) Immunoblot analysis of Akt phosphorylation in skeletal muscle and liver isolated from control, A-PDK1KO, or A-PDK1/FoxO1DKO female mice at 10 min after i.p. injection of insulin (5 U/kg) or vehicle. (E) Weight and triglyceride content of the liver of control, A-PDK1KO, or A-PDK1/FoxO1DKO mice (n = 5 or 6). (F) H&E staining of liver sections from control, A-PDK1KO, or A-PDK1/FoxO1DKO mice. (Original magnification: 200×.) (G) H&E and Sirius red staining of liver sections from control, A-PDK1KO, or A-PDK1/FoxO1DKO mice at 35 wk to 37 wk of age. (Original magnification: 200×.) All quantitative data are means ± SEM; *P < 0.05, **P < 0.01 for the indicated comparisons or versus corresponding control value (Student’s t test, or ANOVA for comparison of overall time courses in C).
Fig. 4.
Fig. 4.
Additional ablation of FoxO1 in adipocytes does not restore adipokine levels and adipose tissue mass in A-PDK1KO mice. (A) Plasma cholesterol and triglyceride as well as (B) adiponectin and leptin concentrations in control, A-PDK1KO, or A-PDK1/FoxO1DKO mice (n = 7 to 10). (C) Weight of epididymal and s.c. adipose tissue in control, A-PDK1KO, or A-PDK1/FoxO1DKO mice (n = 5 or 6). (D) RT and real-time PCR analysis of the expression of genes related to inflammation in epididymal adipose tissue of control, A-PDK1KO, or A-PDK1/FoxO1DKO mice (n = 5 or 6). All data are means ± SEM; *P < 0.05, **P < 0.01 (Student’s t test).
Fig. 5.
Fig. 5.
The insulin–PDK1–FoxO1 pathway regulates the 5-LO–LTB4 axis in adipocytes. (A) LTB4 concentration in plasma and (B) LTB4 content in epididymal adipose tissue of control, A-PDK1KO, or A-PDK1/FoxO1DKO mice (n = 6) as determined by LC-MS/MS analysis. (C) RT and real-time PCR analysis of 5-LO mRNA in epididymal adipose tissue of control, A-PDK1KO, or A-PDK1/FoxO1DKO mice (n = 6). (D) Real-time PCR analysis of 5-LO mRNA in primary adipocytes isolated from control or A-PDK1KO mice and incubated in the absence or presence of the FoxO1 inhibitor AS1842856 (10 μM) for 24 h. (E and F) LTB4 production by (E) primary adipocytes and (F) SV cells isolated from C57BL/6 mice and incubated in the absence or presence of 100 nM insulin for 24 h. (GJ) Real-time PCR analysis of 5-LO mRNA in SV cells isolated from C57BL/6 mice and either (G) incubated in the absence or presence of 100 nM insulin for 24 h, (H) infected with adenoviruses encoding LacZ (control) or a constitutively active form (CAAkt) of Akt, (I) deprived of serum and incubated in the absence or presence of AS1842856 (10 μM) for 24 h, or (J) infected with an adenovirus encoding a dominant negative mutant of FoxO1 (FoxO1DN) and then deprived of serum for 24 h. (K) LTB4 production by SV cells isolated from C57BL/6 mice and then deprived of serum during incubation with or without AS1842856 (10 μM) for 24 h. (L) Real-time PCR analysis of 5-LO mRNA in Raw264.7 cells that had been deprived of serum during incubation with or without AS1842856 (10 μM) for 24 h. All data are means ± SEM, and those in DL are from three or four samples. *P < 0.05, **P < 0.01 for the indicated comparisons or versus corresponding control (Student’s t test).
Fig. 6.
Fig. 6.
The 5-LO–LTB4 axis is associated with systemic insulin resistance in both mice and humans. (A) Plasma insulin concentrations for control, A-PDK1KO mice, and A-PDK1KO/BLT1KO mice (n = 8 to 10) in the randomly fed state at 24 wk of age. (B) Plasma LTB4 concentration in female A-PDK1KO mice (n = 4 or 5) treated with the 5-LO inhibitor zileuton for 2 wk. (C) Blood glucose and plasma insulin concentrations in control or A-PDK1KO mice (n = 6 or 7) treated (or not) with zileuton for 7 wk. (D) Blood glucose and plasma insulin concentrations in control or A-PDK1KO mice (n = 5 to 8) treated (or not) with the BLT1 antagonist CP-105696 for 5 wk. Quantitative data in AD are means ± SEM; *P < 0.05, **P < 0.01. (E) Immunoblot analysis of total and Thr308 or Ser473-phosphorylated forms of Akt, total, and Ser256-phosphorylated forms of FoxO1, 5-LO, and tublin in epididymal adipose tissue of mice fed a normal chow (NC) or a high-fat diet (HF) at 1 h after refeeding. (F) Correlation between plasma LTB4 concentration and either serum immunoreactive insulin (IRI) concentration or HOMA-IR in human subjects (n = 28). R, Pearson’s correlation coefficient. (G) Model for the regulation of systemic insulin sensitivity by insulin–PDK1 signaling in adipocytes. Red arrows indicate effects of PDK1 ablation in adipocytes.

Similar articles

Cited by

References

    1. Giorgino F., Laviola L., Eriksson J. W., Regional differences of insulin action in adipose tissue: Insights from in vivo and in vitro studies. Acta Physiol. Scand. 183, 13–30 (2005). - PubMed
    1. Fasshauer M., Paschke R., Regulation of adipocytokines and insulin resistance. Diabetologia 46, 1594–1603 (2003). - PubMed
    1. Fève B., Adipogenesis: Cellular and molecular aspects. Best Pract. Res. Clin. Endocrinol. Metab. 19, 483–499 (2005). - PubMed
    1. Blüher M., et al. , Adipose tissue selective insulin receptor knockout protects against obesity and obesity-related glucose intolerance. Dev. Cell 3, 25–38 (2002). - PubMed
    1. Eguchi J., et al. , Transcriptional control of adipose lipid handling by IRF4. Cell Metab. 13, 249–259 (2011). - PMC - PubMed

Publication types

MeSH terms

Substances

LinkOut - more resources