. 2020 May 26;117(21):11811-11819.
doi: 10.1073/pnas.2000760117. Epub 2020 May 11.

Preventing presbycusis in mice with enhanced medial olivocochlear feedback

Affiliations

Preventing presbycusis in mice with enhanced medial olivocochlear feedback

Luis E Boero et al. Proc Natl Acad Sci U S A. .

Abstract

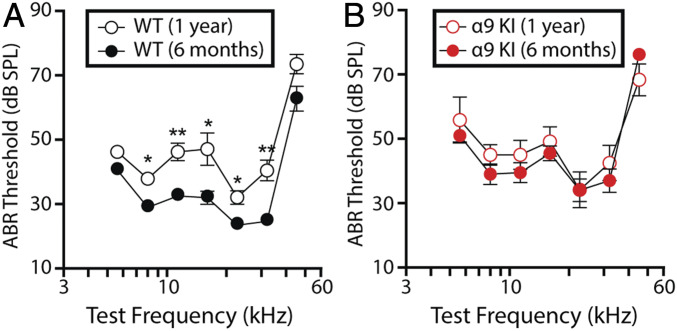
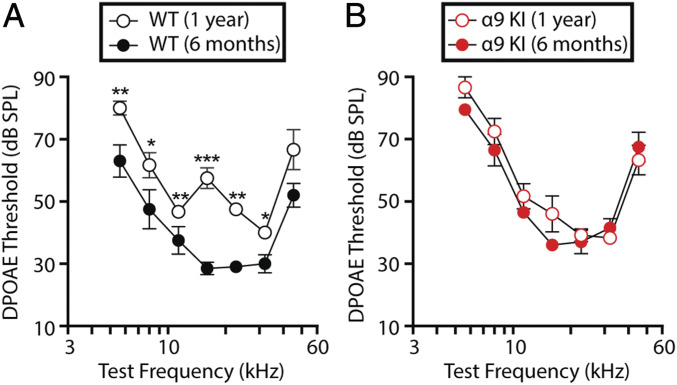
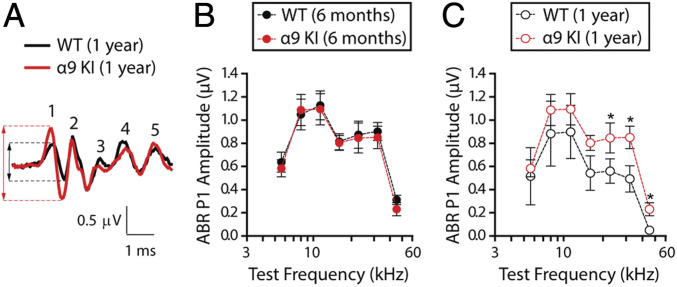
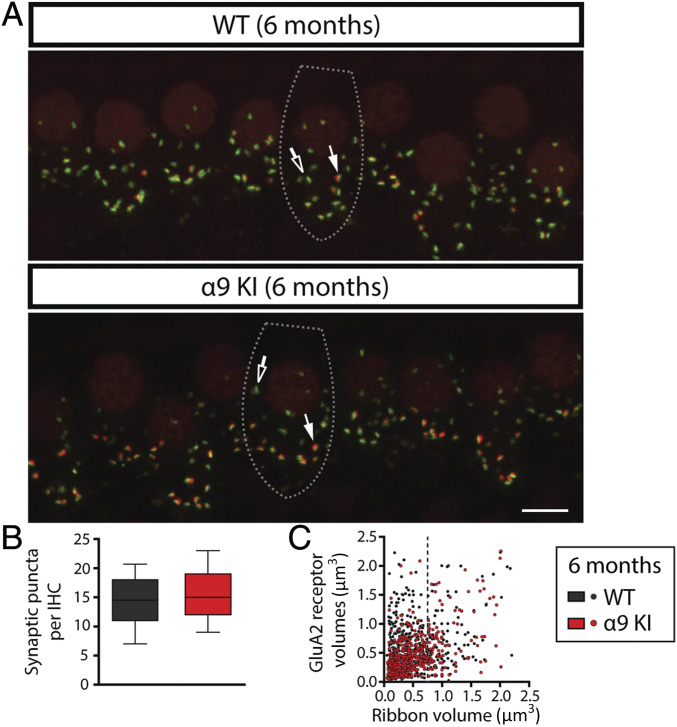
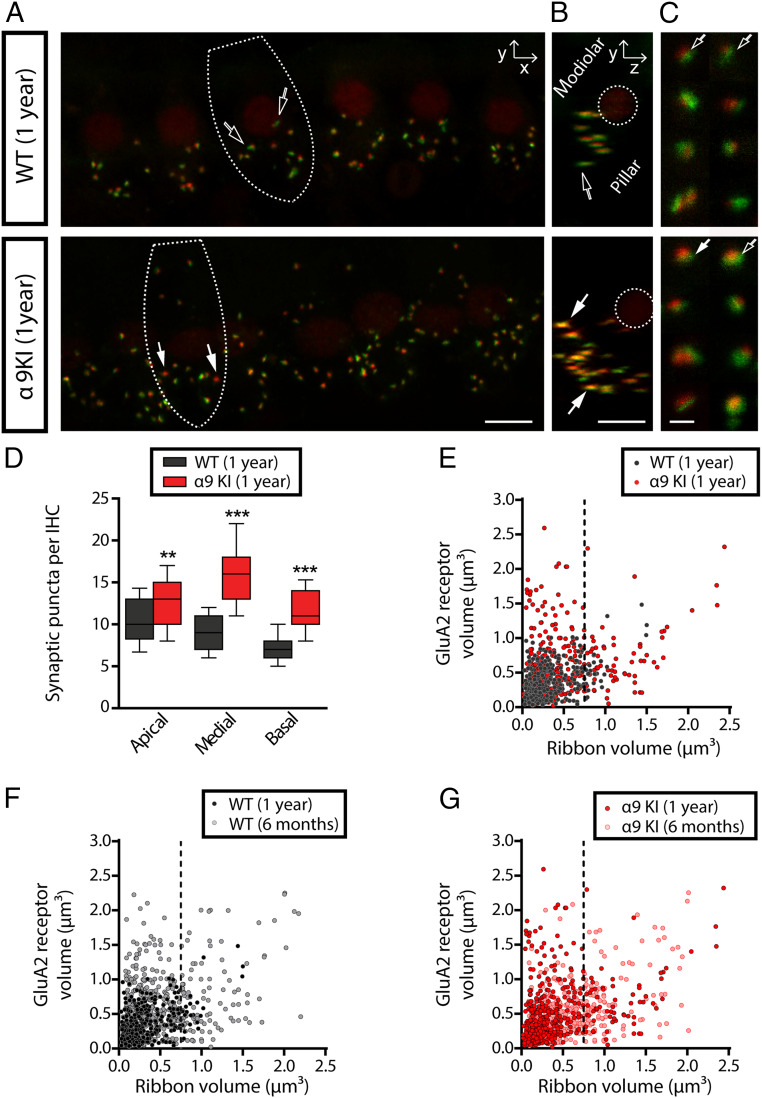
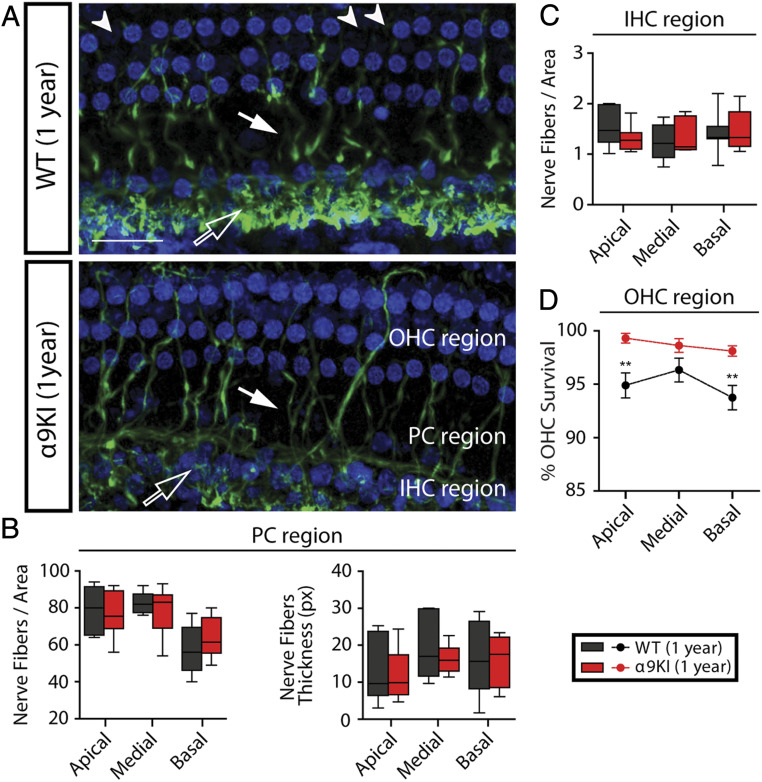
"Growing old" is the most common cause of hearing loss. Age-related hearing loss (ARHL) (presbycusis) first affects the ability to understand speech in background noise, even when auditory thresholds in quiet are normal. It has been suggested that cochlear denervation ("synaptopathy") is an early contributor to age-related auditory decline. In the present work, we characterized age-related cochlear synaptic degeneration and hair cell loss in mice with enhanced α9α10 cholinergic nicotinic receptors gating kinetics ("gain of function" nAChRs). These mediate inhibitory olivocochlear feedback through the activation of associated calcium-gated potassium channels. Cochlear function was assessed via distortion product otoacoustic emissions and auditory brainstem responses. Cochlear structure was characterized in immunolabeled organ of Corti whole mounts using confocal microscopy to quantify hair cells, auditory neurons, presynaptic ribbons, and postsynaptic glutamate receptors. Aged wild-type mice had elevated acoustic thresholds and synaptic loss. Afferent synapses were lost from inner hair cells throughout the aged cochlea, together with some loss of outer hair cells. In contrast, cochlear structure and function were preserved in aged mice with gain-of-function nAChRs that provide enhanced olivocochlear inhibition, suggesting that efferent feedback is important for long-term maintenance of inner ear function. Our work provides evidence that olivocochlear-mediated resistance to presbycusis-ARHL occurs via the α9α10 nAChR complexes on outer hair cells. Thus, enhancement of the medial olivocochlear system could be a viable strategy to prevent age-related hearing loss.

Keywords: aging; cochlear synaptopathy; hearing loss; medial olivocochlear system.


Conflict of interest statement

The authors declare no competing interest.

Figures

Fig. 1.
Fig. 1.
Auditory function in young and aged WT and α9KI mice. (A) ABR thresholds for WT mice at 6 mo (n = 10) and 1 y of age (n = 6). (B) ABR thresholds for α9KI mice at 6 mo (n = 10) and 1 y of age (n = 6). At 1 y of age, cochlear thresholds were elevated in WT but not in α9KI mice. Group means ± SEM are shown. Asterisks represent the statistical significance (Friedman test, *P < 0.05 and **P < 0.01).
Fig. 2.
Fig. 2.
Evaluation of OHC functional integrity in young and aged WT and α9KI mice. (A) DPOAE thresholds for WT mice at 6 mo (n = 10) and 1 y of age (n = 6). (B) DPOAE thresholds for α9KI mice at 6 mo (n = 10) and 1 y of age (n = 6). DPOAE thresholds showed a significant increase at 1 y of age in WT but not in α9KI mice. Group means ± SEM are shown. Asterisks represent the statistical significance (Friedman test *P < 0.05, **P < 0.01, and ***P < 0.001).
Fig. 3.
Fig. 3.
Suprathreshold response amplitude for ABR peak 1 in young and aged WT and α9KI mice. (A) Representative ABR waveforms (32 kHz, 80 dB SPL) from WT (black) and α9KI (red) mice at 1 y of age showed a large reduction in wave 1 amplitudes. Dashed lines mark peak 1 amplitude from aged WT (black) and α9KI (red) mice. (B) ABR peak 1 amplitudes at 80 dB SPL in WT (n = 10) and α9KI (n = 10) mice at 6 mo of age at different test frequencies. (C) ABR peak 1 amplitudes at 80 dB SPL in WT (n = 6) and α9KI (n = 6) mice at 1 y of age. Aged WT ears displayed a significant reduction in peak 1 amplitudes at high frequencies. Group means ± SEM. Asterisks represent the statistical significance (Mann–Whitney U test, *P < 0.05).
Fig. 4.
Fig. 4.
Analysis of IHC ribbon synapses in young WT and α9KI mice. (A) Representative confocal images of IHC synapses from the middle region of cochleae immunolabeled for presynaptic ribbons (CtBP2-red) and postsynaptic receptor patches (GluA2-green) from WT (Top) and α9KI (Bottom) mice at 6 mo of age. (Scale bar: 10 μm.) The dashed lines show the approximate outline of one IHC. Afferent synapses in IHC show opposite gradients in the size of the presynaptic and postsynaptic elements: synapses with large ribbons and small AMPAR patches (filled arrows) and those with large AMPAR patches and small ribbons (open arrows). CtBP2 antibody also weakly stains IHC nuclei. (B) Quantitative data obtained from young WT and α9KI mice at the midbasal cochlear turn. For each IHC, the number of putative ribbon synapses was analyzed: i.e., colocalized CtBP2 and GluA2 puncta (WT = 185 IHCs from 10 animals; α9KI = 306 IHCs from 10 animals). Horizontal lines inside the box plots represent the median, and whiskers correspond to percentiles 10 to 90. Comparisons were made by a Mann–Whitney U test. (C) Scatter plots comparing the volumes of fluorescence staining for ribbons (CtBP2 volume, x axis) and receptors (GluA2 volume, y axis) for each of the synaptic pairs from young WT (517 synaptic pairs from five animals, slope = 0.41 ± 0.03) and α9KI tissues (508 synaptic pairs from five animals, slope = 0.49 ± 0.05) spanning the whole region of the cochlea. Comparisons were made by F test.
Fig. 5.
Fig. 5.
Analysis of IHC ribbon synapses in aged WT and α9KI mice. (A) Representative confocal images in the xy projection of IHCs’ synapses from the medial region of cochleae immunolabeled for presynaptic ribbons (CtBP2-red) and postsynaptic receptor patches (GluA2-green) from WT (Top) and α9KI (Bottom) mice at 1 y of age. (Scale bar: 10 μm.) The dashed lines show the approximate outline of one IHC. (B) Cochlear whole mount yz projection of one IHC. In WT mice, the largest AMPAR labels are on the pillar side, with fewer synapses on the modiolar/basal pole side of the IHC (scale bar: 10 μm). The dashed lines show the outline of the nucleus of one IHC. (C) Shown are 4× zoom images of afferent synapses from aged WT (Top) and α9KI (Bottom) mice. WT ears showed mainly a population of ribbon synapses with bigger AMPAR patches while α9KI ears showed both populations of ribbon synapses. (Scale bar: 0.5 μm.) Filled arrows indicate synapses with large ribbons and small AMPAR patches while unfilled ones show synapses with the smallest ribbons and largest AMPAR patches (AC). (D) Quantitative data obtained from aged WT and α9KI mice. For each IHC, the number of putative ribbon synapses was analyzed: i.e., colocalized CtBP2 and GluA2 puncta (WT: 76 IHCs at the apical, 103 IHCs at the medial, and 102 IHCs at the basal region from 10 animals; α9KI: 208 IHCs at the apical, 108 IHCs at the medial, and 116 IHCs at the basal region from 10 animals). Horizontal lines inside the box plots represent the median, and whiskers correspond to percentiles 10 to 90. Asterisks represent the statistical significance (Mann–Whitney U test, **P < 0.01 and ***P < 0.001). (E) Scatter plots comparing the volumes of fluorescence staining for ribbons (CtBP2 volume, x axis) and AMPAR (GluA2 volume, y axis) for each of the synaptic pairs from aged WT (412 synaptic pairs from four animals, slope = 0.23 ± 0.05) and α9KI tissues (553 synaptic pairs from five animals, slope = 0.42 ± 0.03) spanning the whole region of the cochlea. The dashed line (at ribbon volume of 0.75 μm3) shows the reduction of synaptic pairs with bigger ribbons and smaller AMPAR patches in aged WT mice. Comparisons were made by F test. (F) Scatter plots comparing the volumes of fluorescence staining for ribbons and AMPAR for each of the synaptic pairs from young (517 synaptic pairs from four animals, slope = 0.49 ± 0.07) and aged (412 synaptic pairs from four animals, slope = 0.26 ± 0.07) WT mice. The dashed line (at ribbon volume of 0.75 μm3) shows the reduction of synaptic pairs with bigger ribbons and smaller AMPAR patches in aged compared to young WT mice. Comparisons were made by F test. (G) Scatter plots comparing the volumes of fluorescence staining for ribbons and AMPAR for each of the synaptic pairs from young (508 synaptic pairs from four animals, slope = 0.37 ± 0.05) and aged (553 synaptic pairs from five animals, slope = 0.43 ± 0.07) α9KI tissues. The dashed line (at ribbon volume of 0.75 μm3) shows that there is no alteration of synaptic pairs in aged compared to young α9KI mice. Comparisons were made by F test.
Fig. 6.
Fig. 6.
OHCs and nerve fibers’ quantification in aged WT and α9KI mice. (A) Representative confocal images of whole mounts organ of Corti immunolabeled for antineurofilament (green) and the nuclear dye Draq5 (blue) from WT (n = 10) and α9KI (n = 10) mice at 1 y of age (scale bar: 30 μm). Unfilled arrows indicate the thin fibers spiraling under the IHCs. MOC fibers projecting to OHCs and type II afferent neurons are indicated by filled arrows. Arrowheads point to lost OHCs. (B) Quantification of nerve fiber density and thickness at the PC region: nerve fiber density (Left) and thickness (Right) at the apical, medial, and basal portions of the cochlea. px, pixels. (C) Quantification of nerve fiber density at the IHCs’ region in basal, medial, and apical portions of the cochlea. Horizontal lines inside the box plots (B and C) represent the median, and whiskers correspond to percentiles 10 to 90. (D) Mean OHC survival ± SEM is plotted as a function of cochlear location from WT and α9KI mice at 1 y of age. In aged WT, there was some loss of OHCs compared to α9KI ears that was significant at the apical and basal cochlear region. Asterisks represent the statistical significance (Mann–Whitney U test, **P < 0.01).

References

    1. Fu B., et al. , Age-related synaptic loss of the medial olivocochlear efferent innervation. Mol. Neurodegener. 5, 53 (2010). - PMC - PubMed
    1. Gates G. A., Mills J. H., Presbycusis. Lancet 366, 1111–1120 (2005). - PubMed
    1. Deal J. A., et al. , Hearing treatment for reducing cognitive decline: Design and methods of the Aging and Cognitive Health Evaluation in Elders randomized controlled trial. Alzheimers Dement. (N. Y.) 4, 499–507 (2018). - PMC - PubMed
    1. Loughrey D. G., Kelly M. E., Kelley G. A., Brennan S., Lawlor B. A., Association of age-related hearing loss with cognitive function, cognitive impairment, and dementia: A systematic review and meta-analysis. JAMA Otolaryngol. Head Neck Surg. 144, 115–126 (2018). - PMC - PubMed
    1. Livingston G., et al. , Dementia prevention, intervention, and care. Lancet 390, 2673–2734 (2017). - PubMed

Publication types

MeSH terms

LinkOut - more resources