

Patterns of longitudinal cortical atrophy over 3 years in empirically derived MCI subtypes
- PMID: 32393648
- PMCID: PMC7455336
- DOI: 10.1212/WNL.0000000000009462
Patterns of longitudinal cortical atrophy over 3 years in empirically derived MCI subtypes
Abstract
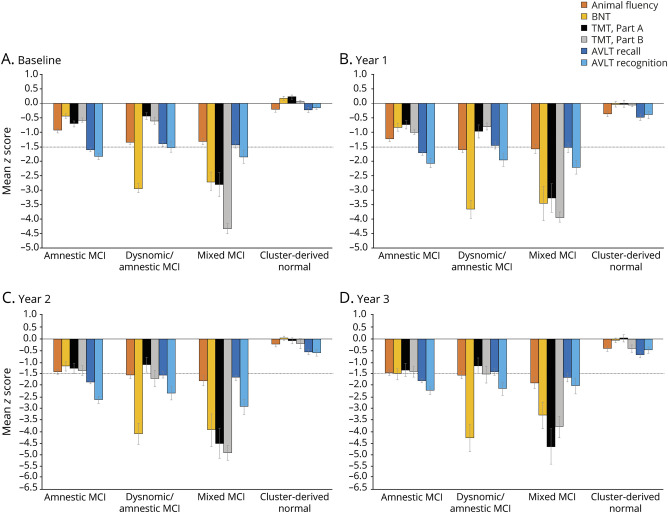
Objective: We previously identified 4 empirically derived mild cognitive impairment (MCI) subtypes via cluster analysis within the Alzheimer's Disease Neuroimaging Initiative (ADNI) and demonstrated high correspondence between patterns of cortical thinning at baseline and each cognitive subtype. We aimed to determine whether our MCI subtypes demonstrate unique longitudinal atrophy patterns.
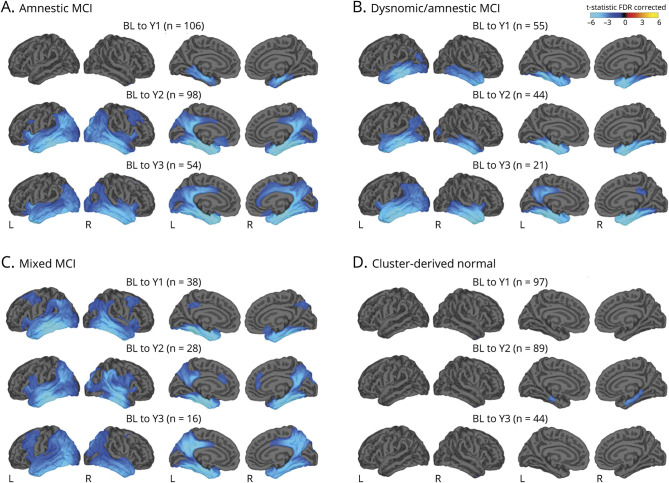
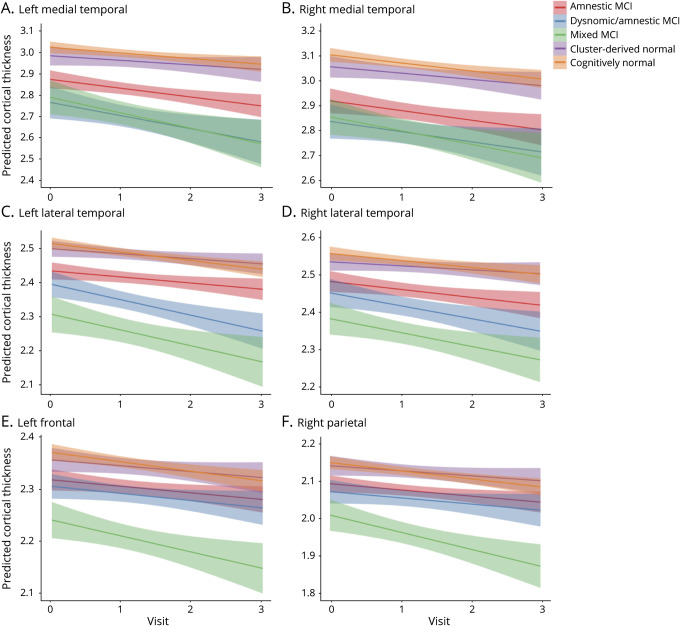
Methods: ADNI participants (295 with MCI and 134 cognitively normal [CN]) underwent annual structural MRI and neuropsychological assessments. General linear modeling compared vertex-wise differences in cortical atrophy rates between each MCI subtype and the CN group. Linear mixed models examined trajectories of cortical atrophy over 3 years within lobar regions of interest.
Results: Compared to the CN group, those with amnestic MCI (memory deficit) initially demonstrated greater atrophy rates within medial temporal lobe regions that became more widespread over time. Those with dysnomic/amnestic MCI (naming/memory deficits) showed greater atrophy rates largely localized to temporal lobe regions. The mixed MCI (impairment in all cognitive domains) group showed greater atrophy rates in widespread regions at all time points. The cluster-derived normal group, who had intact neuropsychological performance and normal cortical thickness at baseline despite their MCI diagnosis via conventional diagnostic criteria, continued to show normal cognition and minimal cortical atrophy over 3 years.
Conclusions: ADNI's purported amnestic MCI sample produced more refined cognitive subtypes with unique longitudinal cortical atrophy rates. These novel MCI subtypes reliably reflect underlying atrophy, reduce false-positive diagnostic errors, and improve prediction of clinical course. Such improvements have implications for the selection of participants for clinical trials and for providing more precise risk assessment for individuals diagnosed with MCI.
© 2020 American Academy of Neurology.
Figures
References
-
- Petersen RC, Smith GE, Waring SC, Ivnik RJ, Tangalos EG, Kokmen E. Mild cognitive impairment: clinical characterization and outcome. Arch Neurol 1999;56:303–308. - PubMed
-
- Petersen RC. Mild cognitive impairment as a diagnostic entity. J Intern Med 2004;256:183–194. - PubMed
-
- Petersen RC, Morris JC. Mild cognitive impairment as a clinical entity and treatment target. Arch Neurol 2005;62:1160–1163. - PubMed
-
- Winblad B, Palmer K, Kivipelto M, et al. Mild cognitive impairment: beyond controversies, towards a consensus: report of the International Working Group on Mild Cognitive Impairment. J Intern Med 2004;256:240–246. - PubMed