

Nucleoside Reverse Transcriptase Inhibitor Interaction with Human Equilibrative Nucleoside Transporters 1 and 2
- PMID: 32393653
- PMCID: PMC7318791
- DOI: 10.1124/dmd.120.090720
Nucleoside Reverse Transcriptase Inhibitor Interaction with Human Equilibrative Nucleoside Transporters 1 and 2
Abstract
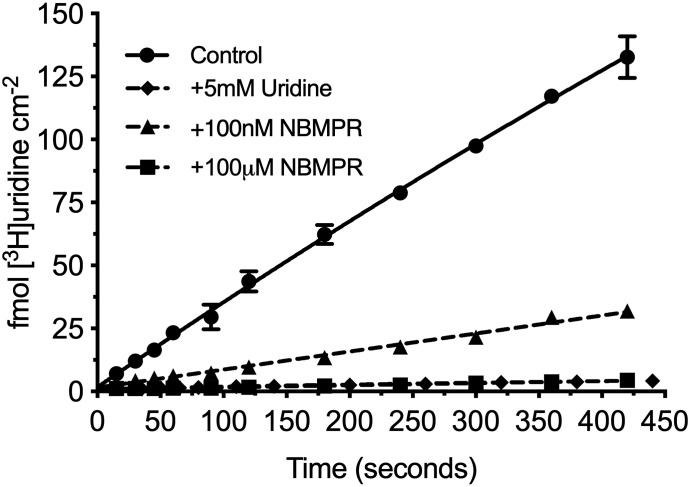
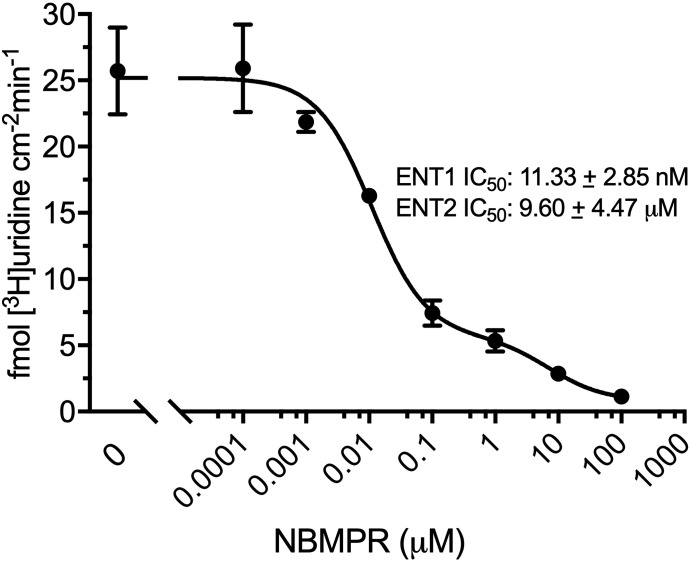
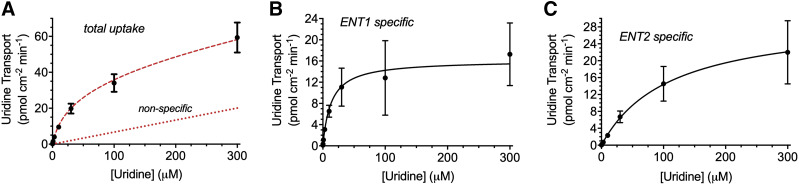
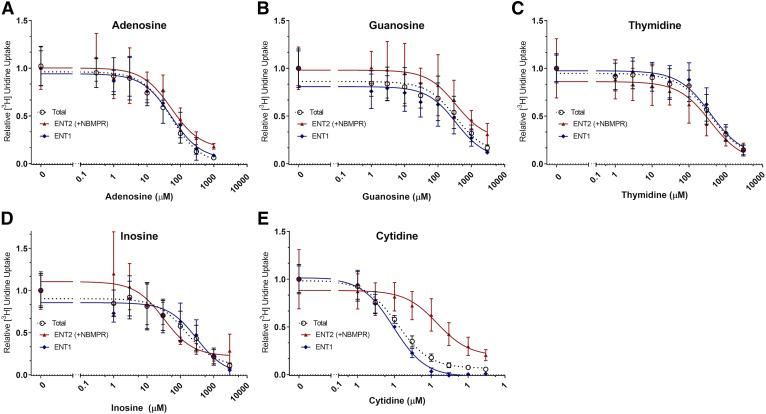
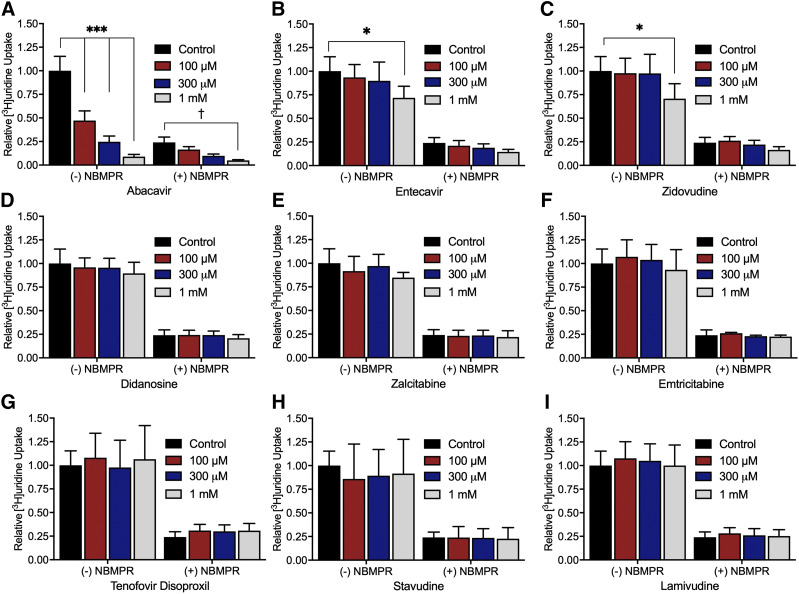
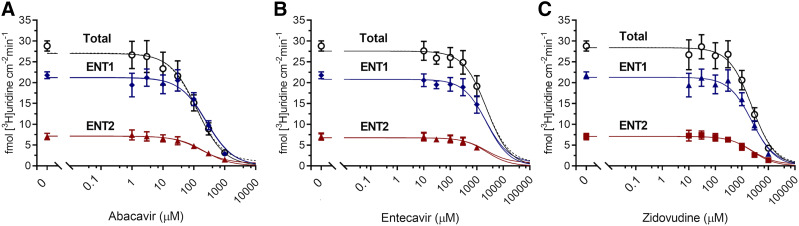
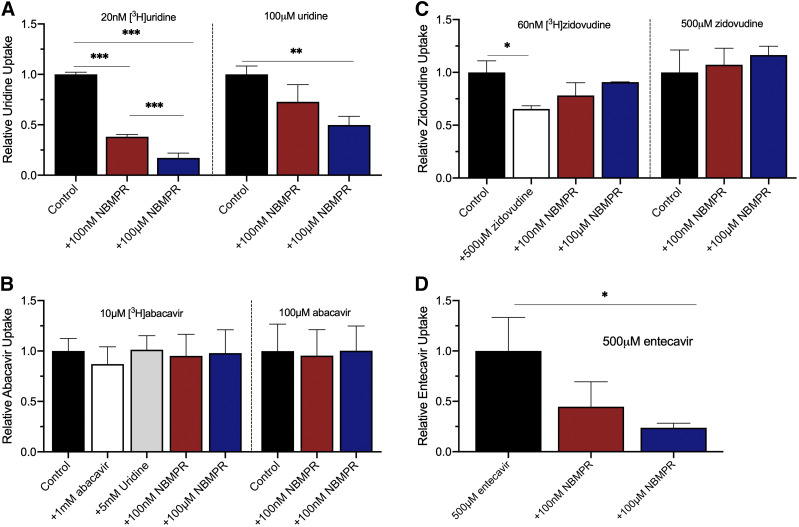
Equilibrative nucleoside transporters (ENTs) transport nucleosides across the blood-testis barrier (BTB). ENTs are of interest to study the disposition of nucleoside reverse-transcriptase inhibitors (NRTIs) in the human male genital tract because of their similarity in structure to nucleosides. HeLa S3 cells express ENT1 and ENT2 and were used to compare relative interactions of these transporters with selected NRTIs. Inhibition of [3H]uridine uptake by NBMPR was biphasic, with IC50 values of 11.3 nM for ENT1 and 9.6 μM for ENT2. Uptake measured with 100 nM NBMPR represented ENT2-mediated transport; subtracting that from total uptake represented ENT1-mediated transport. The kinetics of ENT1- and ENT2-mediated [3H]uridine uptake revealed no difference in Jmax (16.53 and 30.40 pmol cm-2 min-1) and an eightfold difference in Kt (13.6 and 108.9 μM). The resulting fivefold difference in intrinsic clearance (Jmax/Kt) for ENT1- and ENT2 transport accounted for observed inhibition of [3H]uridine uptake by 100 nM NBMPR. Millimolar concentrations of the NRTIs emtricitabine, didanosine, lamivudine, stavudine, tenofovir disoproxil, and zalcitabine had no effect on ENT transport activity, whereas abacavir, entecavir, and zidovudine inhibited both transporters with IC50 values of ∼200 µM, 2.5 mM, and 2 mM, respectively. Using liquid chromatography-tandem mass spectrometry and [3H] compounds, the data suggest that entecavir is an ENT substrate, abacavir is an ENT inhibitor, and zidovudine uptake is carrier-mediated, although not an ENT substrate. These data show that HeLa S3 cells can be used to explore complex transporter selectivity and are an adequate model for studying ENTs present at the BTB. SIGNIFICANCE STATEMENT: This study characterizes an in vitro model using S-[(4-nitrophenyl)methyl]-6-thioinosine to differentiate between equilibrative nucleoside transporter (ENT) 1- and ENT2-mediated uridine transport in HeLa cells. This provides a method to assess the influence of nucleoside reverse-transcriptase inhibitors on natively expressed transporter function. Determining substrate selectivity of the ENTs in HeLa cells can be effectively translated into the activity of these transporters in Sertoli cells that comprise the blood-testis barrier, thereby assisting targeted drug development of compounds capable of circumventing the blood-testis barrier.
U.S. Government work not protected by U.S. copyright.
Figures
Similar articles
-
Addressing the Clinical Importance of Equilibrative Nucleoside Transporters in Drug Discovery and Development.Clin Pharmacol Ther. 2023 Oct;114(4):780-794. doi: 10.1002/cpt.2984. Epub 2023 Jul 21. Clin Pharmacol Ther. 2023. PMID: 37404197 Free PMC article. Review.
-
Predicting Drug Interactions with Human Equilibrative Nucleoside Transporters 1 and 2 Using Functional Knockout Cell Lines and Bayesian Modeling.Mol Pharmacol. 2021 Feb;99(2):147-162. doi: 10.1124/molpharm.120.000169. Epub 2020 Dec 1. Mol Pharmacol. 2021. PMID: 33262250 Free PMC article.
-
Basolateral uptake of nucleosides by Sertoli cells is mediated primarily by equilibrative nucleoside transporter 1.J Pharmacol Exp Ther. 2013 Jul;346(1):121-9. doi: 10.1124/jpet.113.203265. Epub 2013 May 2. J Pharmacol Exp Ther. 2013. PMID: 23639800 Free PMC article.
-
Remdesivir and EIDD-1931 Interact with Human Equilibrative Nucleoside Transporters 1 and 2: Implications for Reaching SARS-CoV-2 Viral Sanctuary Sites.Mol Pharmacol. 2021 Dec;100(6):548-557. doi: 10.1124/molpharm.121.000333. Epub 2021 Sep 9. Mol Pharmacol. 2021. PMID: 34503974 Free PMC article.
-
Regulation of equilibrative nucleoside uptake by protein kinase inhibitors.Nucleosides Nucleotides Nucleic Acids. 2004 Oct;23(8-9):1445-50. doi: 10.1081/NCN-200027667. Nucleosides Nucleotides Nucleic Acids. 2004. PMID: 15571274 Review.
Cited by
-
Addressing the Clinical Importance of Equilibrative Nucleoside Transporters in Drug Discovery and Development.Clin Pharmacol Ther. 2023 Oct;114(4):780-794. doi: 10.1002/cpt.2984. Epub 2023 Jul 21. Clin Pharmacol Ther. 2023. PMID: 37404197 Free PMC article. Review.
-
Bile acids inhibit equilibrative adenosine transport to alter adenosine receptor signaling in cholestasis.J Biol Chem. 2025 Jun;301(6):108563. doi: 10.1016/j.jbc.2025.108563. Epub 2025 Apr 30. J Biol Chem. 2025. PMID: 40316019 Free PMC article.
-
Nucleoside transporters and immunosuppressive adenosine signaling in the tumor microenvironment: Potential therapeutic opportunities.Pharmacol Ther. 2022 Dec;240:108300. doi: 10.1016/j.pharmthera.2022.108300. Epub 2022 Oct 22. Pharmacol Ther. 2022. PMID: 36283452 Free PMC article. Review.
-
ENT1 blockade by CNX-774 overcomes resistance to DHODH inhibition in pancreatic cancer.Cancer Lett. 2023 Jan 1;552:215981. doi: 10.1016/j.canlet.2022.215981. Epub 2022 Oct 27. Cancer Lett. 2023. PMID: 36341997 Free PMC article.
-
Generation of a hTERT-Immortalized Human Sertoli Cell Model to Study Transporter Dynamics at the Blood-Testis Barrier.Pharmaceutics. 2020 Oct 22;12(11):1005. doi: 10.3390/pharmaceutics12111005. Pharmaceutics. 2020. PMID: 33105674 Free PMC article.
References
-
- Baldwin SA, Beal PR, Yao SYM, King AE, Cass CE, Young JD. (2004) The equilibrative nucleoside transporter family, SLC29. Pflugers Arch 447:735–743. - PubMed
-
- Baraclude (2005) Package insert. Bristol-Myers Squibb, New York.
-
- Boleti H, Coe IR, Baldwin SA, Young JD, Cass CE. (1997) Molecular identification of the equilibrative NBMPR-sensitive (es) nucleoside transporter and demonstration of an equilibrative NBMPR-insensitive (ei) transport activity in human erythroleukemia (K562) cells. Neuropharmacology 36:1167–1179. - PubMed
-
- Cerveny L, Ptackova Z, Ceckova M, Karahoda R, Karbanova S, Jiraskova L, Greenwood SL, Glazier JD, Staud F. (2018) Equilibrative nucleoside transporter 1 (ENT1, SLC29A1) facilitates transfer of the antiretroviral drug abacavir across the placenta. Drug Metab Dispos 46:1817–1826. - PubMed
Publication types
MeSH terms
Substances
Grants and funding
LinkOut - more resources
Full Text Sources
Research Materials
Miscellaneous
