. 2020 May 11;11(5):341.
doi: 10.1038/s41419-020-2529-6.

Transgelin is a poor prognostic factor associated with advanced colorectal cancer (CRC) stage promoting tumor growth and migration in a TGFβ-dependent manner

Affiliations

Transgelin is a poor prognostic factor associated with advanced colorectal cancer (CRC) stage promoting tumor growth and migration in a TGFβ-dependent manner

Mona Elsafadi et al. Cell Death Dis. .

Abstract

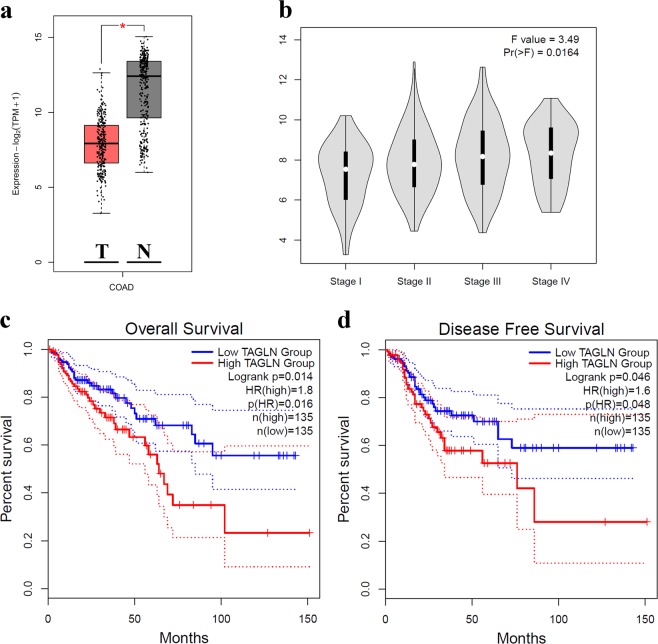
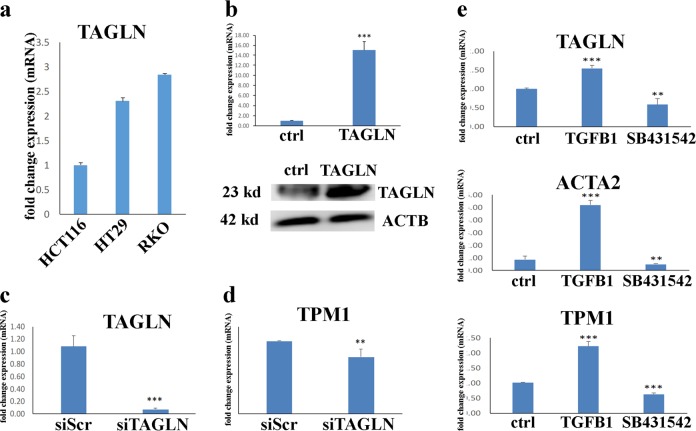
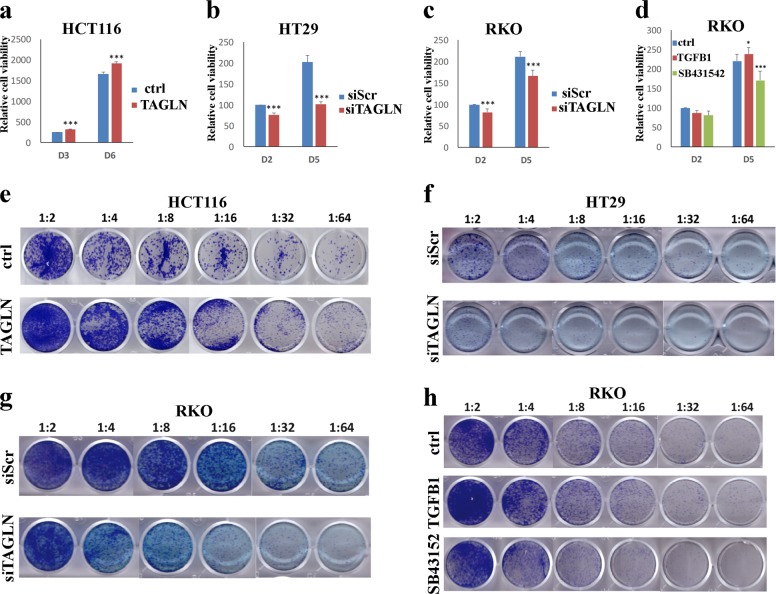
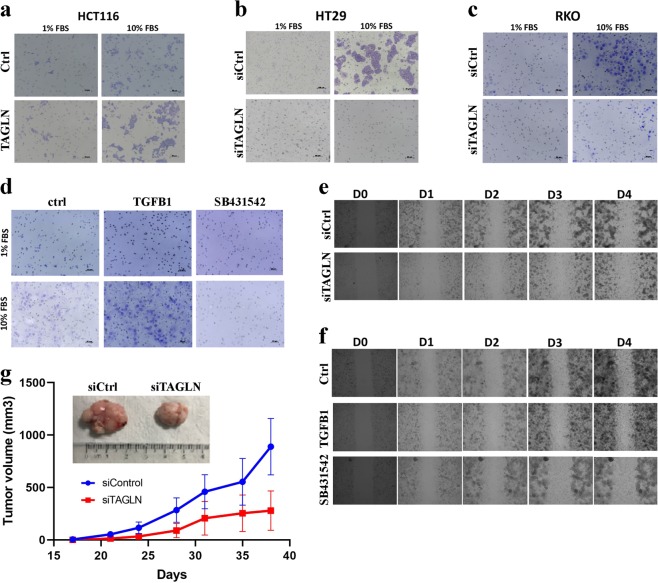
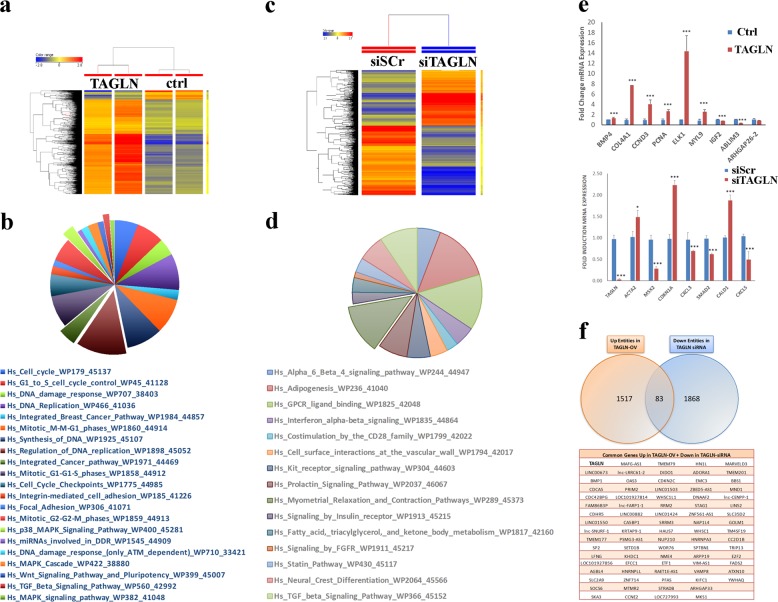
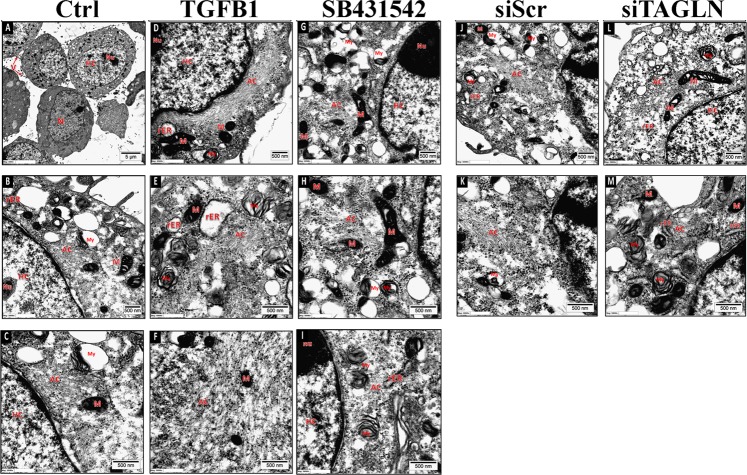
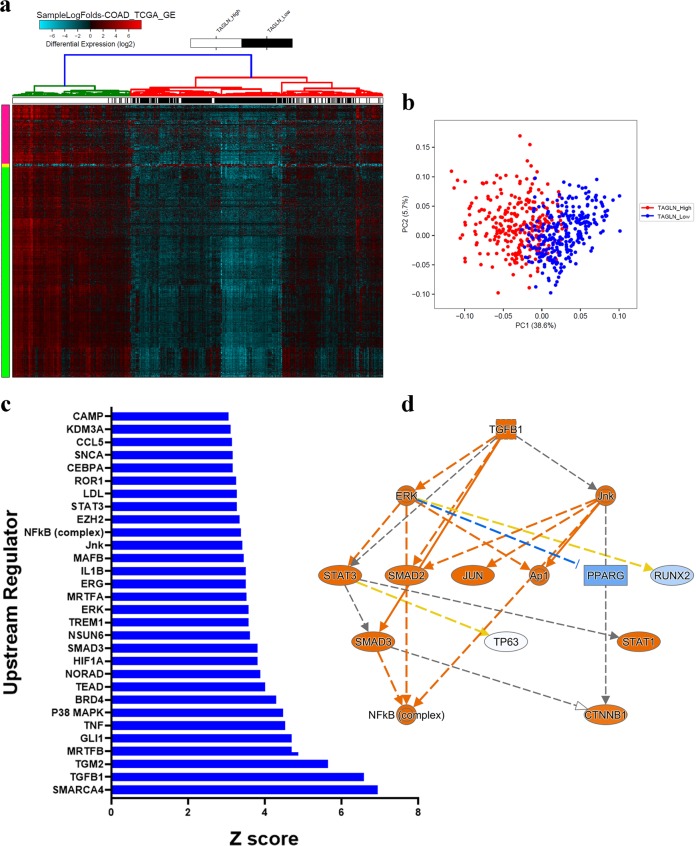
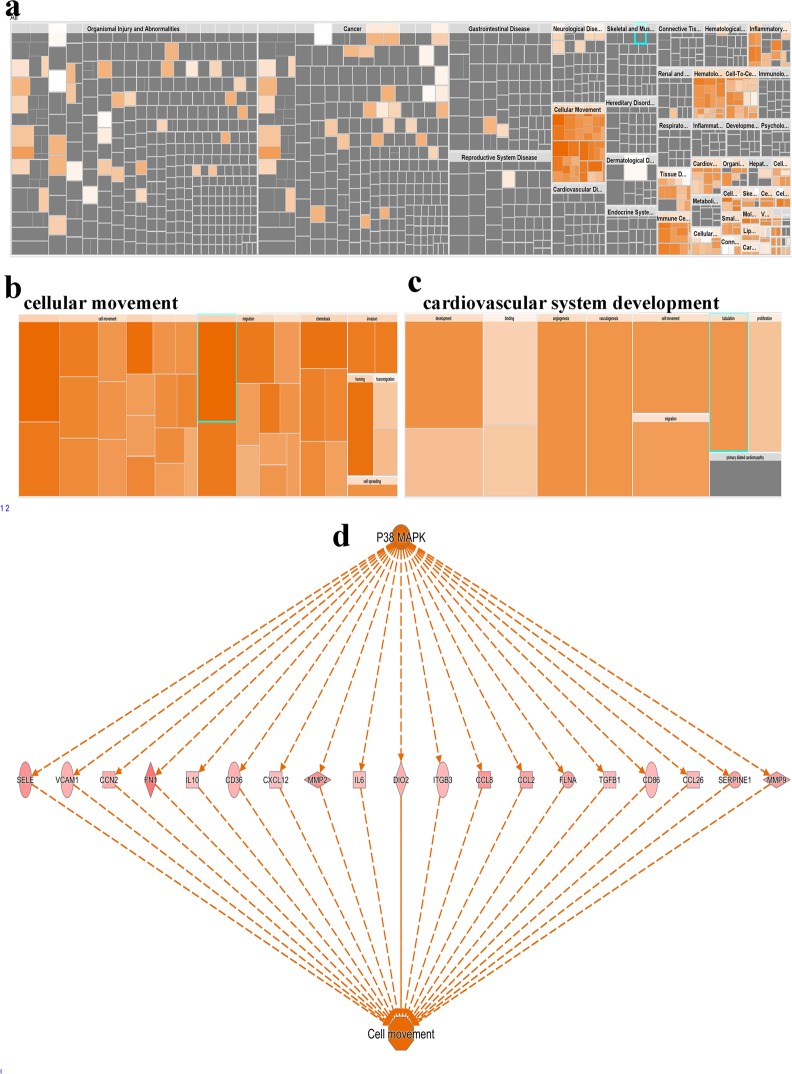
Colorectal cancer (CRC) is the fourth most common cancer type globally. Investigating the signaling pathways that maintain cancer cell phenotype can identify new biomarkers for targeted therapy. Aberrant transforming growth factor-β (TGFβ) signaling has been implicated in CRC progression, however, the exact mechanism by which TGFβ exerts its function is still being unraveled. Herein, we investigated TAGLN expression, prognostic value, and its regulation by TGFβ in CRC. While TAGLN was generally found to be downregulated in CRC, elevated expression of TAGLN was associated with advanced CRC stage and predicted poor overall survival (hazard ratio (HR) = 1.8, log-rank test P-value = 0.014) and disease-free survival (HR = 1.6, log-rank test P-value = 0.046), hence implicating TAGLN as poor prognostic factor in CRC. Forced expression of TAGLN was associated with enhanced CRC cell proliferation, clonogenic growth, cell migration and in vivo tumor formation in immunocompromised mice, while targeted depletion of TAGLN exhibited opposing biological effects. Global gene expression profiling of TAGLN-overexpressing or TAGLN-deficient CRC cell lines revealed deregulation of multiple cancer-related genes and signaling pathways. Transmission electron microscopy (TEM) revealed ultrastructural changes due to loss of TAGLN, including disruption of actin cytoskeleton organization and aberrant actin filament distribution. Hierarchical clustering, principle component, and ingenuity pathway analyses revealed distinct molecular profile associated with TAGLNhigh CRC patients with remarkable activation of a number of mechanistic networks, including SMARCA4, TGFβ1, and P38 MAPK. The P38 MAPK was the top predicted upstream regulator network promoting cell movement through regulation of several intermediate molecules, including TGFβ1. Concordantly, functional categories associated with cellular movement and angiogenesis were also enriched in TAGLNhigh CRC, supporting a model for the molecular mechanisms linking TGFβ-induced upregulation of TAGLN and CRC tumor progression and suggesting TAGLN as potential prognostic marker associated with advanced CRC pathological stage.


Conflict of interest statement

The authors declare that they have no conflict of interest.

Figures

Fig. 1
Fig. 1. TAGLN expression is associated with advanced tumor stage and predicts worse clinical outcome.
a Boxplot comparing the expression of TAGLN in a cohort of colon adenocarcinoma (COAD), n = 275 compared to normal colon tissue (n = 349) from the TCGA and GTEx data sets. b Stage plot demonstrating TAGLN expression as a function of pathological stage in COAD. Kaplan–Meier overall survival (OS, c) and disease-free survival (DFS, d) as function of median TAGLN expression in COAD.
Fig. 2
Fig. 2. TAGLN is a TGFβ responsive gene in CRC.
a TAGLN mRNA expression in three different CRC cell lines based on the CCLE database: HCT116, HT-29, and RKO. Expression level is compared to TAGLN expression in HCT116 cells. b qRT-PCR of TAGLN expression in HCT116 control cells or cells transduced with TAGLN-overexpressing lentiviral vector (upper panel). Western blotting for TAGLN (upper panel) in HCT116-TAGLN vs. control cells. β-Actin was used as the loading control. QRT-PCR for TAGLN (c) or TPM1 (d) gene expression 3 days post transfection of RKO cells with TAGLN-siRNA (siTAGLN) or scrambled-siRNA (siScr). Data are presented as fold change in mRNA expresion. e qRT-PCR of TAGLN, TPM1, and ACTA2 gene expression in RKO cells treated with TGFβ1 (10 ng/µl) or SB431542 (10 µM), compared to control cells. The two-tailed t-test was used to compare different treatment groups. **P < 0.005, ***P < 0.0005.
Fig. 3
Fig. 3. TAGLN induces CRC cell proliferation and colony formation.
Alamar blue assay showing cell viability in HCT116 overexpressing TAGLN compared to control cells (a) and in TAGLN-depleted HT-29 (b) or RKO (c) cells at the indicated time points. d Effect of exogenous TGFβ (10 ng/mL) and TGFβ inhibition using SB431542 (10 µM) on RKO cell viability. Data are shown as mean ± S.D. of at least two independent experiments. *P < 0.05, ***P < 0.0005. e Representative clonogenic assay showing clonogenicity of HCT116 cells overexpressing TAGLN or TAGLN-depleted HT-29 (f) and RKO (g) cells. h Effects of TGFβ (10 ng/mL) and TGFβ inhibition using SB431542 (10 µM) on RKO colony formation ability. Plates were stained with Diff-Quik stain set on day 6. Wells are representative of at least two independent experiments for each condition.
Fig. 4
Fig. 4. TAGLN promotes CRC cell migration and in vivo tumor formation.
a Transwell migration assay showing increase of cell migration in HCT116 overexpressing TAGLN in response to 10% FBS attractant. Effects of TAGLN depletion on HT-29 (b) and RKO (c) cell migration using transwell migration system. d Effect of exogenous TGFβ (10 ng/mL) and TGFβ inhibition using SB431542 (10 µM) on RKO cell migration using the transwell migration system. Effects of TAGLN depletion (e) and exogenous TGFβ (10 ng/mL) and TGFβ inhibition using SB431542 (10 µM) (f) on RKO cell migration using wound-healing assay. Time-lapse microscopy was conducted using EVOS FL Auto Cell Imaging System where images were taken every 30 min over 4 days. g Subcutaneous tumor formation of control (siControl) and TAGLN-depleted (siTAGLN) RKO cells in nude mice. Data are presented as mean (tumor volume) ± S.E., n = 5 per group. Representative tumors at the end of experiment is shown (upper panel).
Fig. 5
Fig. 5. TAGLN regulates several functional categories and signaling pathways in CRC.
a Hierarchical clustering of TAGLN-overexpressing or control HCT116 cells based on differentially expressed mRNA levels. Each row represents one replica sample and each column represents an mRNA. Expression level of each gene in a single sample is depicted according to the color scale. b Pie chart illustrating the distribution of the top pathway designations for the upregulated genes in TAGLN-overexpressing HCT116 cells. c Hierarchical clustering of TAGLN-depleted (siTAGLN) and control (siScr) RKO cells based on differentially expressed mRNA levels. d Pie chart illustrating the distribution of the top pathway designations for the downregulated genes in siTAGLN transfected RKO cells. e qRT-PCR validation of selected genes from microarray, n = 2, *P < 0.05, **P < 0.005, ***P < 0.005. f Venn-diagram depicting the overlap between the upregulated genes in TAGLN-overexpressing HCT116 and the downregulated genes in TAGLN-depleted RKO cells.
Fig. 6
Fig. 6. Transmission electron microscopy (TEM) illustrating the ultrastructural characteristics of RKO cells under different treatment conditions.
RKO cells were treated with exogenous TGFβ (10 ng/mL), TGFβ inhibition using SB431542 (10 µM), or TAGLN depletion using siTAGLN. N nucleus, Nu nucleolus, AC actin filaments, V microvilli, M mitochondria, rER rough endoplasmic reticulum, V microvilli, HC heterochromatin, AC actin filaments, my myelin figure.
Fig. 7
Fig. 7. Molecular signature of TAGLNhigh COAD.
a Heat map clustering of TAGLNhigh (m = 296) and TAGLNlow (n = 296) COAD. Samples were stratified into TAGLNhigh and TAGLNlow based on median TAGLN expression. Each row represents expression level of an mRNA (log2). mRNA expression level in a single sample is depicted according to the color scale. b Principal component analysis (PCA) for TAGLNhigh (m = 296) and TAGLNlow COAD. c Bar-graph depicting the top thirty significantly activated upstream regulator networks in TAGLNhigh vs TAGLNlow COAD. Activation Z-score is indicated on the x-axis. d Illustration of the TGFβ1 mechanistic network.
Fig. 8
Fig. 8. TAGLNhigh COAD is enriched in functional categories promoting cell migration, angiogenesis, and P38 MAPK signaling.
a Disease and function heat map depicting enrichment in the indicated functional and disease categories in the differentially expressed genes in TAGLNhigh vs. TAGLNlow COAD patients’ data based on IPA analysis. Heat map-illustrating enrichment in cellular movement (b) and cardiovascular system development (c) functional categories. d Illustration of the predicted P38 MAPK regulator network and its predicted effects of cell movement.

References

    1. Brenner H, Kloor M, Pox CP. Colorectal cancer. Lancet. 2014;383:1490–1502. - PubMed
    1. Erstad DJ, Tumusiime G, Cusack JC., Jr. Prognostic and predictive biomarkers in colorectal cancer: implications for the clinical surgeon. Ann. Surgical Oncol. 2015;22:3433–3450. doi: 10.1245/s10434-015-4706-x. - DOI - PubMed
    1. Alajez NM. Large-scale analysis of gene expression data reveals a novel gene expression signature associated with colorectal cancer distant recurrence. PLoS ONE. 2016;11:e0167455. doi: 10.1371/journal.pone.0167455. - DOI - PMC - PubMed
    1. Shaath, H., Toor, S. M., Nair, V. S., Elkord, E. & Alajez, N. M. Transcriptomic analyses revealed systemic alterations in gene expression in circulation and tumor microenvironment of colorectal cancer patients. Cancers1, 1–19 (2019). - PMC - PubMed
    1. Sanz-Garcia E, Grasselli J, Argiles G, Elez ME, Tabernero J. Current and advancing treatments for metastatic colorectal cancer. Expert Opin. Biol. Ther. 2016;16:93–110. doi: 10.1517/14712598.2016.1108405. - DOI - PubMed

Publication types

MeSH terms