. 2020 May 11;11(1):2332.
doi: 10.1038/s41467-020-16243-3.

Synergistic effect of fasting-mimicking diet and vitamin C against KRAS mutated cancers

Affiliations

Synergistic effect of fasting-mimicking diet and vitamin C against KRAS mutated cancers

Maira Di Tano et al. Nat Commun. .

Abstract

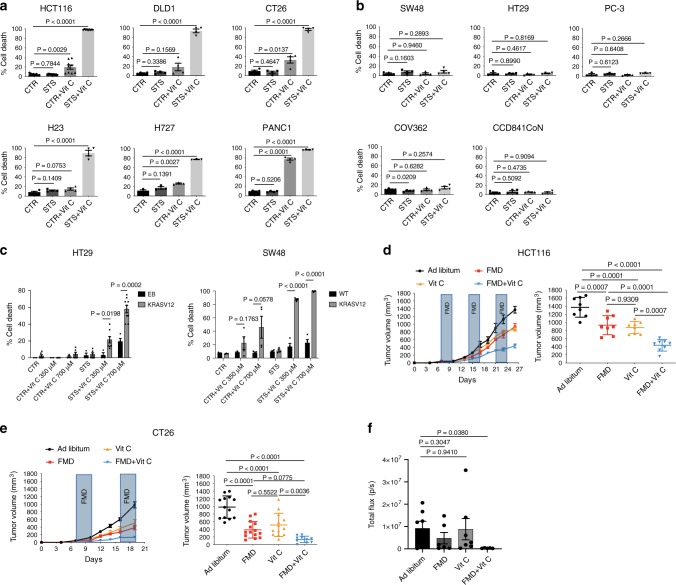
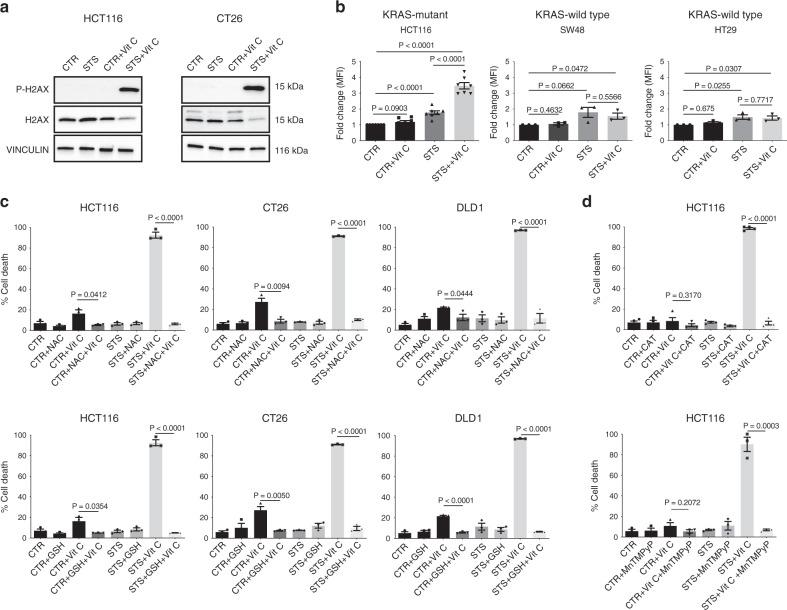
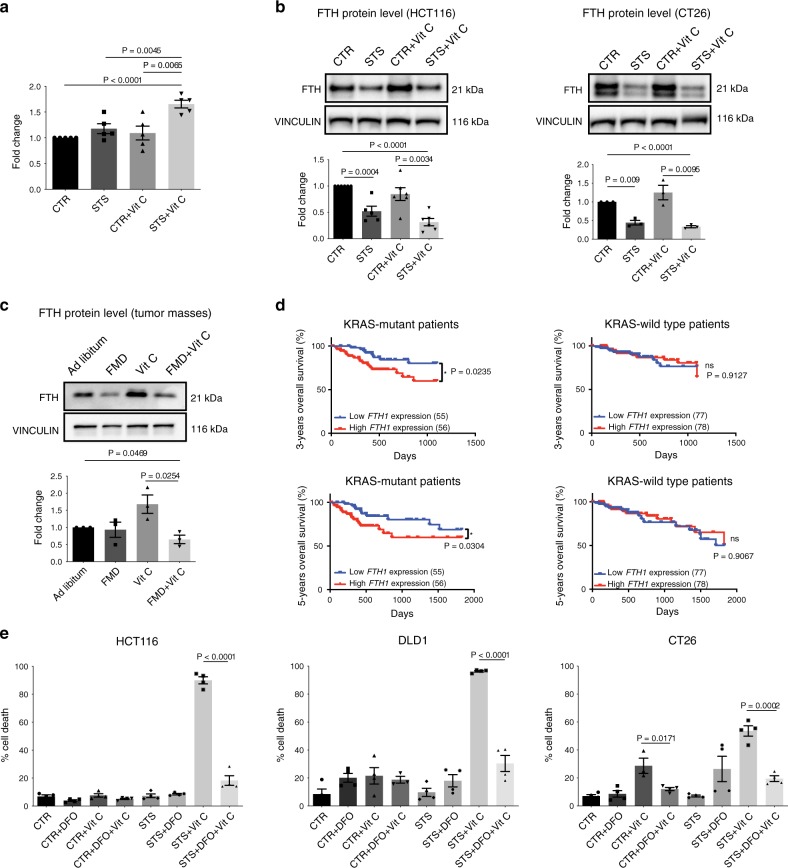
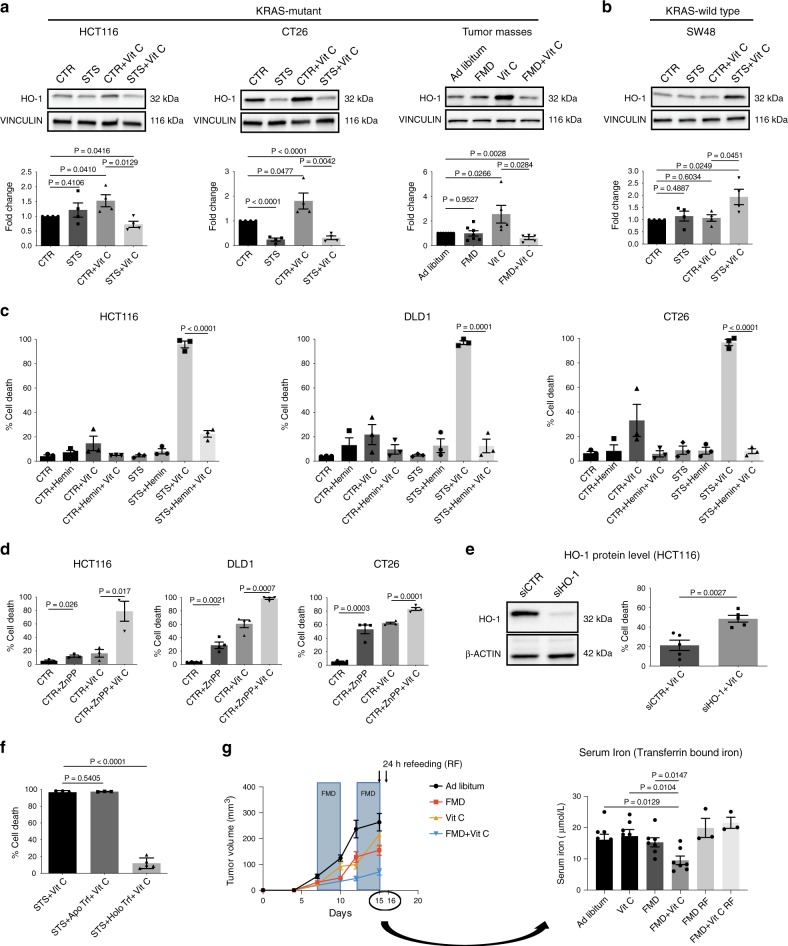
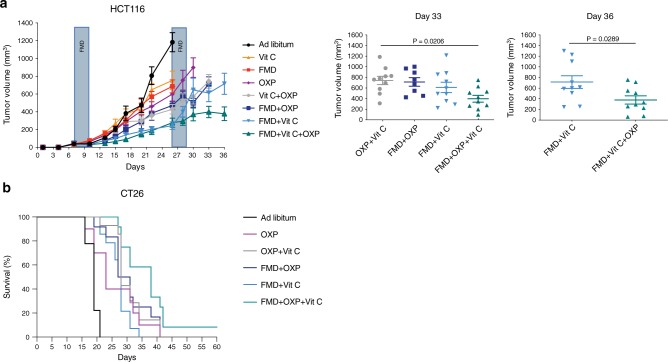
Fasting-mimicking diets delay tumor progression and sensitize a wide range of tumors to chemotherapy, but their therapeutic potential in combination with non-cytotoxic compounds is poorly understood. Here we show that vitamin C anticancer activity is limited by the up-regulation of the stress-inducible protein heme-oxygenase-1. The fasting-mimicking diet selectivity reverses vitamin C-induced up-regulation of heme-oxygenase-1 and ferritin in KRAS-mutant cancer cells, consequently increasing reactive iron, oxygen species, and cell death; an effect further potentiated by chemotherapy. In support of a potential role of ferritin in colorectal cancer progression, an analysis of The Cancer Genome Atlas Database indicates that KRAS mutated colorectal cancer patients with low intratumor ferritin mRNA levels display longer 3- and 5-year overall survival. Collectively, our data indicate that the combination of a fasting-mimicking diet and vitamin C represents a promising low toxicity intervention to be tested in randomized clinical trials against colorectal cancer and possibly other KRAS mutated tumors.


Conflict of interest statement

V.D.L. has equity interest in L-Nutra, a company that develops medical food. A.N. and I.C. are inventors of three patents of methods for treating cancer by fasting-mimicking diets that were licenced to L-Nutra. All the other authors declare no competing interest.

Figures

Fig. 1
Fig. 1. FMD/STS enhances vitamin C anticancer activity in KRAS-mutant tumors.
a Viability of KRAS-mutant and b KRAS-wild-type cancer cells treated for 48 h with STS with or without vitamin C; HCT116 (n = 9); DLD1, CT26, H23, and PANC1 (n = 4); H727 (n = 3); SW48 and HT29 (n = 4); PC-3 (n = 3); COV362 and CCD841CoN cells (n = 4). P values were determined by two-sided unpaired t-test. DLD1: exact P value = 0.0000005; CT26: exact P value = 0.00000009; H23: exact P value = 0.00001; H727: exact P value = 0.000005; PANC1: exact P values = 0.0000001 (CTR vs CTR + Vit C), 0.00000000004 (CTR vs STS + Vit C). c Viability of HT29 cells infected with empty backbone (EB; n = 3, n = 4 in STS + Vit C 700 µM) or KRASV12 vector (n = 6, n = 7 in STS + Vit C 125 µM, n = 8 in CTR + Vit C 700 µM and STS + Vit C 350 µM, n = 9 in STS + Vit C 700 µM); SW48 WT (n = 4) and SW48 KRASV12 (n = 4, n = 3 in CTR and STS) treated for 48 h with STS with or without vitamin C. P values were determined by two-sided unpaired t-test. SW48: exact P values= 0.000008 (STS + Vit C 350 µM wt vs STS + Vit C 350 µM KRASV12), 0.000005 (STS + Vit C 700 µM wt vs STS + Vit C 700 µM KRASV12). d Tumor growth of HCT116-derived xenograft (n = 8) and e CT26-derived allografts (n = 13 in Ad libitum and Vit C, n = 14 in FMD and n = 10 in FMD + Vit C). Tumor volumes at multiple time points (left) and before euthanasia (right) are presented. P values were determined by One-way ANOVA with Tukey’s post analysis. HCT116: exact P value = 0.000000002 (Ad libitum vs FMD + Vit C); CT26: exact P values = 0.0000000001 (Ad libitum vs FMD + Vit C), 0.00008 (Ad libitum vs Vit C), 0.0000007 (Ad libitum vs FMD). f Tumor growth of CT26-luc-derived orthotopic model (n = 7 in Ad libitum and Vit C, n = 6 in FMD and n = 5 in FMD + Vit C). Total photon effluxes over tumor regions were measured. P values were determined by two-sided unpaired t-test. All data are represented as mean ± SEM, n = independent experiments.
Fig. 2
Fig. 2. ROS mediate KRAS-mutant cancer cell sensitization to vitamin C via STS.
a Detection of phosphorylated H2AX levels in HCT116 and CT26 by western blotting, total H2AX and VINCULIN as loading control (n = 3). b CellROX-Deep-Red ROS detection by flow cytometry in HCT116 (n = 7), SW48 and HT29 (n = 3). MFI: mean fluorescence intensity. P values were determined by two-sided unpaired t-test. HCT116: exact p value = 0.00000004 (CTR vs STS + Vit C), 0.00003 (CTR vs STS), 0.00001 (STS vs STS + Vit C). c Viability of HCT116 (n = 3), CT26 (n = 3), DLD1 (n = 3) cells treated for 48 h with STS with or without vitamin C, glutathione (GSH), N-acetyl cysteine (NAC) and d catalase (CAT, n = 4) or the superoxide dismutase (SOD)/catalase mimetic MnTMPyP (HCT116, n = 3). P values were determined by two-sided unpaired t-test. HCT116 in (c): exact P values= 0.000009 (STS + Vit C vs STS + NAC + Vit C), 0.000007 (STS + Vit C vs STS + GSH + Vit C); CT26: exact P values = 0.00000007 (STS + Vit C vs STS + NAC + Vit C), 0.000002 (STS + Vit C vs STS + GSH + Vit C); DLD1: exact P values = 0.00005 (STS + Vit C vs STS + NAC + Vit C), 0.000000003 (STS + Vit C vs STS + GSH + Vit C), 0.00008 (CTR + Vit C vs CTR + GSH + Vit C). HCT116 in (d): exact P value = 0.000000007 (STS + Vit C vs STS + Vit C + CAT). All data are represented as mean ± SEM, n = independent experiments.
Fig. 3
Fig. 3. Iron is involved in FMD + vitamin C toxicity selectively in KRAS mutated cancer cells.
a Intracellular free iron (Fe2+) measurement, relative to CTR cells, of HCT116 treated with STS with or without vitamin C (n = 5). P values were determined by two-sided unpaired t-test. Exact P value= 0.00002 (CTR vs STS + Vit C). b Detection of ferritin (FTH) protein expression by western blot in HCT116 (n = 6, n = 5 in STS), CT26 cells (n = 3) and c HCT116-derived tumor masses (n = 3). VINCULIN as loading control. P values were determined by two-sided unpaired t-test. HCT116 exact P value = 0.000002 (CTR vs STS + Vit C); CT26 exact P value = 0.00002 (CTR vs STS + Vit C). d Three-year (left panel) and 5-year (right panel) overall survival of patient bearing KRAS-mutant (left) and KRAS-wild-type (right) tumors collected from The Cancer Genome Atlas Database (TCGA) and stratified according to intratumor FTH1 mRNA expression levels. P values were determined by Wilcoxon matched-pairs signed rank test. e Viability of HCT116, DLD1 and CT26 cells in response to STS, vitamin C, or their combination with or without desferrioxamine (DFO) (n = 4, n = 3 in DLD1- CTR + DFO + Vit C and CT26- CTR + Vit C). P values were determined by two-sided unpaired t-test. HCT116: exact P value = 0.000003 (STS + Vit C vs STS + DFO + Vit C); DLD1: exact P value = 0.00003 (STS + Vit C vs STS + DFO + Vit C). All data are represented as mean ± SEM, n = independent experiments.
Fig. 4
Fig. 4. HO-1 modulation and iron-bound transferrin are the key players in FMD-dependent sensitization to Vitamin C.
a, b Western blotting detection of HO-1 expression level in KRAS-mutant HCT116 (n = 4), CT26 (n = 4) and HCT116-derived tumor masses (n = 5 in Vit C and FMD + Vit C, n = 7 in Ad libitum and FMD) and KRAS-wild-type SW48 cancer cells (n = 4). VINCULIN as loading control. Representative blots and quantifications are shown. P values were determined by two-sided unpaired t-test. CT26: exact P values = 0.00002 (CTR vs STS), 0.00009 (CTR vs STS + Vit C). c Viability of DLD1, HCT116, and CT26 cells treated with STS with or without vitamin C, hemin (n = 3) or d zinc protoporphyrin (ZnPP; HCT116, n = 3; DLD1 and CT26, n = 4). P values were determined by two-sided unpaired t-test. HCT116 in (c): exact P value = 0.00005 (STS + Vit C vs STS + Hemin + Vit C), CT26 in (c): exact P value= 0.00001 (STS + Vit C vs STS + Hemin + Vit C). e Western blot (left) and viability (right) of HCT116 cells transfected with control siRNAs (siCTR) or anti-HO-1 siRNAs (siHO-1), n = 5. P values were determined by two-sided unpaired t-test. f Viability of HCT116 cells grown in STS medium with apo-transferrin (ApoTrf) or holo-transferrin (HoloTrf) with or without vitamin C (n = 4 in STS, n = 3 in ApoTrf and n = 5 in HoloTrf). P values were determined by two-sided unpaired t-test. Exact P value = 0.00000003 (STS + Vit C vs STS + HoloTrf + Vit C). g Quantification of transferrin bound iron in mouse blood serum (right) of HCT116-engrafted NSG mice fed ad libitum or subjected to FMD cycles, and treated with or without vitamin C (tumor growth, left). Black arrows indicate blood serum collection: upon the last FMD cycle and 24 h after refeeding (RF). P values were determined by two-sided unpaired t-test (n = 8 mice in Ad libitum, n = 7 in FMD, FMD + Vit C, Vit C, n = 3 in FMD RF, FMD + Vit C RF). All data are represented as mean ± SEM, n = independent experiments.
Fig. 5
Fig. 5. FMD, vitamin C and OXP triple treatment delays tumor progression and extends survival.
NSG and BALB/c mice were subcutaneously injected with HCT116 cells and CT26 cells, respectively. Mice were fed ad libitum or subjected to FMD cycles, and treated with or without vitamin C or oxaliplatin (10 mg/kg). a HCT116 tumor progression (left) and volume at day 33 and 36 (right), respectively (n = 10 in Ad libitum, FMD, FMD + Vit C, Vit C + OXP, FMD + Vit C + OXP, n = 8 in FMD + OXP, n = 9 in OXP, n = 11 in Vit C). P values were determined by One-way ANOVA with Tukey’s post analysis (day 33) and two-sided unpaired t-test (day 36). Data are represented as mean ± SEM. b BALB/c with CT26 survival curves (n = 9 in Ad libitum, n = 10 in OXP, n = 12 in FMD + OXP and FMD + OXP + Vit C, n = 14 in OXP + Vit C and FMD + Vit C). P values were determined by Log-rank (Mantel-Cox) test (Ad libitum vs OXP, p = 0.0040; OXP vs FMD + Vit C, p = 0.7177; OXP vs FMD + OXP + VitC, p = 0.0114; FMD + OXP vs FMD + OXP + Vit C, p = 0.0488; OXP + Vit C vs FMD + OXP + Vit C, p = 0.0345; FMD + OXP + Vit C vs FMD + Vit C, p = 0.0003).

References

    1. Hoffer LJ, et al. Phase I clinical trial of i.v. ascorbic acid in advanced malignancy. Ann. Oncol. 2008;19:1969–1974. doi: 10.1093/annonc/mdn377. - DOI - PubMed
    1. Ma Y, et al. High-dose parenteral ascorbate enhanced chemosensitivity of ovarian cancer and reduced toxicity of chemotherapy. Sci. Transl. Med. 2014;6:222ra18. doi: 10.1126/scitranslmed.3007154. - DOI - PubMed
    1. Schoenfeld JD, et al. O2⋅- and H2O2-mediated disruption of Fe metabolism causes the differential susceptibility of NSCLC and GBM cancer cells to pharmacological ascorbate. Cancer Cell. 2017;32:268. doi: 10.1016/j.ccell.2017.07.008. - DOI - PubMed
    1. Yun J, et al. Vitamin C selectively kills KRAS and BRAF mutant colorectal cancer cells by targeting GAPDH. Science. 2015;350:1391–1396. doi: 10.1126/science.aaa5004. - DOI - PMC - PubMed
    1. Aguilera O, et al. Vitamin C uncouples the Warburg metabolic switch in KRAS mutant colon cancer. Oncotarget. 2016;7:47954–47965. doi: 10.18632/oncotarget.10087. - DOI - PMC - PubMed

Publication types