. 2020 May 11;11(1):2354.
doi: 10.1038/s41467-020-15545-w.

Fecal microbiota transplant rescues mice from human pathogen mediated sepsis by restoring systemic immunity

Affiliations

Fecal microbiota transplant rescues mice from human pathogen mediated sepsis by restoring systemic immunity

Sangman M Kim et al. Nat Commun. .

Abstract

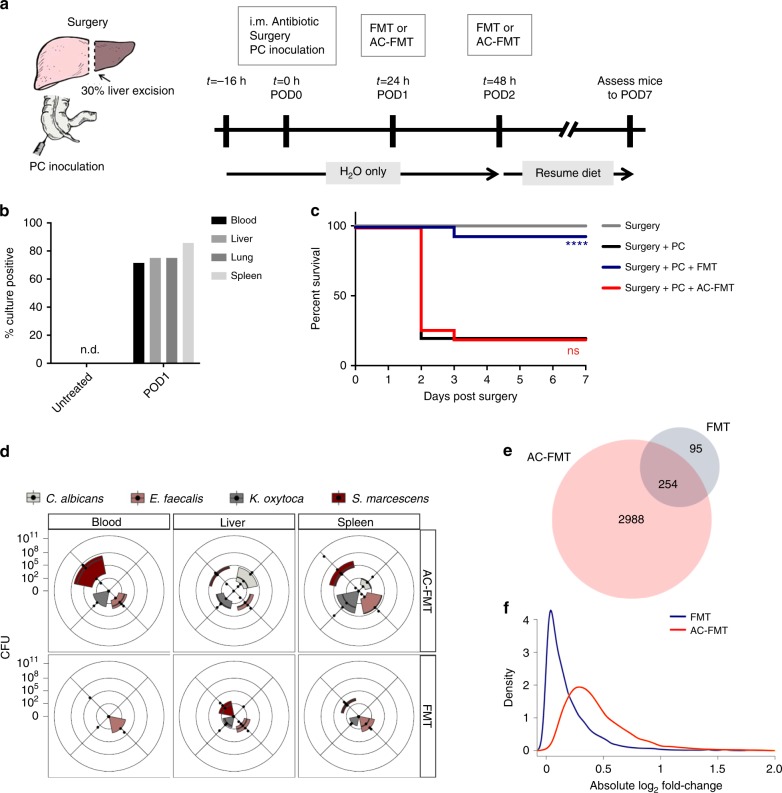
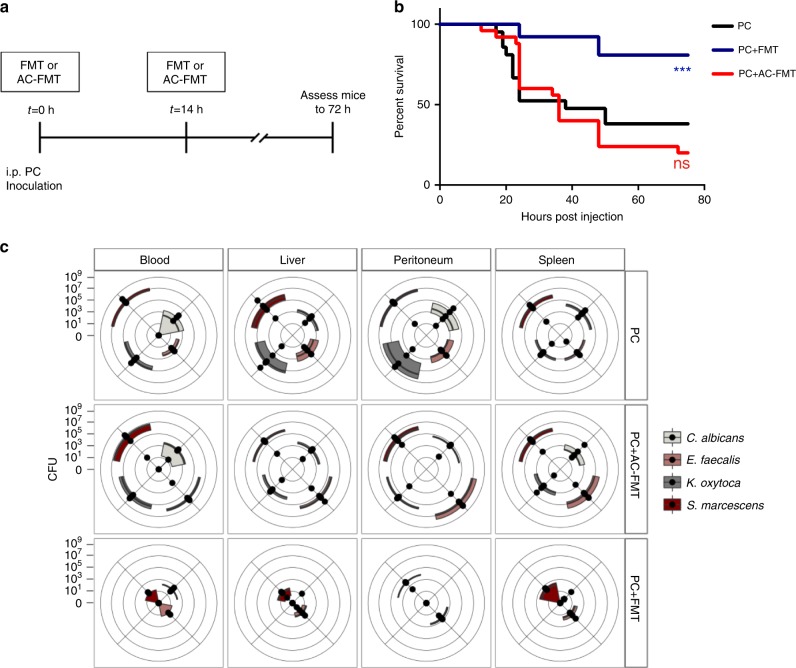
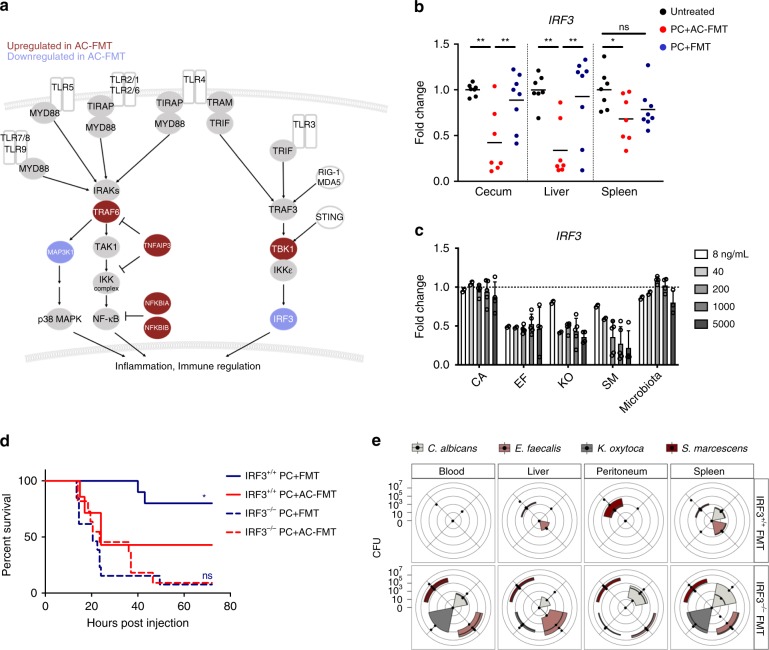
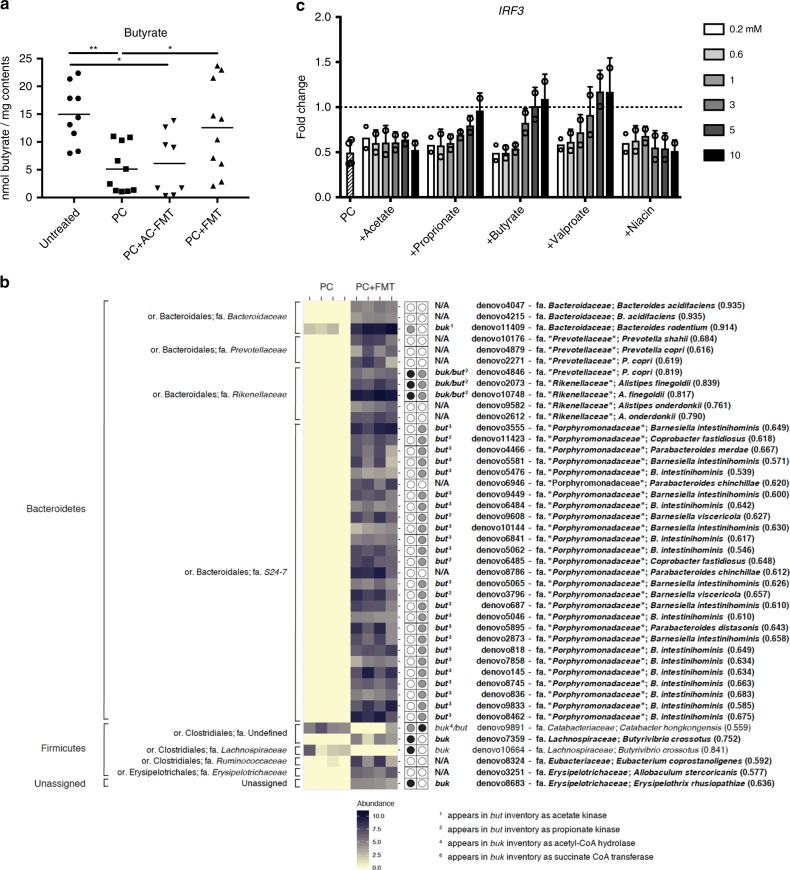
Death due to sepsis remains a persistent threat to critically ill patients confined to the intensive care unit and is characterized by colonization with multi-drug-resistant healthcare-associated pathogens. Here we report that sepsis in mice caused by a defined four-member pathogen community isolated from a patient with lethal sepsis is associated with the systemic suppression of key elements of the host transcriptome required for pathogen clearance and decreased butyrate expression. More specifically, these pathogens directly suppress interferon regulatory factor 3. Fecal microbiota transplant (FMT) reverses the course of otherwise lethal sepsis by enhancing pathogen clearance via the restoration of host immunity in an interferon regulatory factor 3-dependent manner. This protective effect is linked to the expansion of butyrate-producing Bacteroidetes. Taken together these results suggest that fecal microbiota transplantation may be a treatment option in sepsis associated with immunosuppression.


Conflict of interest statement

The authors declare no competing interests.

Figures

Fig. 1
Fig. 1. FMT rescues mice from lethal infection due to a four-member pathogen community isolated from a patient with lethal sepsis.
a–f To mimic the development of sepsis following major surgery, C57BL/6 mice were starved and received a single-intramuscular injection of cefoxitin, after which they were opened, subjected to 30% hepatectomy, and inoculated with the PC directly into their cecum. To test the protective effects of FMT, 24 h (POD1) and 48 h (POD2) after surgery, FMT or AC-FMT was administered via enema. a Sketch and timeline of the gut-derived sepsis model. b The percentage of mice with microbes present on POD1 in the indicated sites was measured by homogenizing organs and culturing them on TSB agar plates. The percentage of mice that had positive cultures out of all of the mice assessed are graphed for the groups indicated (n = 5, 7, and 8 mice for untreated, POD1 blood and spleen, and POD1 liver and lung, respectively). c Kaplan–Meier survival curves for indicated groups. “Surgery” are control mice that had starvation, antibiotics, and surgery without pathogen inoculation (n = 15 mice/group; Log-rank (Mantel–Cox) test; P < 0.0001 between Surgery + PC/Surgery + PC + FMT, P = 0.9554 between Surgery + PC/Surgery + PC + AC-FMT, P < 0.0001 between Surgery + PC + FMT/Surgery + PC + AC-FMT). d Quantitative culture results of indicated sites comparing the PC burden of Surgery + PC + FMT and Surgery + PC + AC-FMT-treated mice at POD2. Each of the four PC members were assessed separately using selective culture plates. On radar plot, each dot along the axes represents the CFU/mL of blood or CFU/mg of liver and spleen of one mouse, the further the distance from the center of the plot, the higher the pathogen burden. The third and first quartiles and the median are indicated with the edges of the colored boxes and the thick black line respectively (n = 5 mice/group; Mann–Whitney test; PC burden significantly different between AC-FMT/FMT in the blood [SM*], liver [CA*], spleen [CA*], *P ≤ 0.05). e, f The cecum, liver, and spleen of Surgery + PC + FMT or Surgery + PC + AC-FMT-treated mice was harvested on POD2, mRNA was extracted from whole tissues, and gene expression was measured using whole-genome microarray. Gene expression was compared against the baseline of untreated control mice (denoted “Untreated”; n = 3 mice/group). e Venn diagram showing the number of genes differently expressed (FDR ≤ 0.01) across all organs on POD2 in FMT and AC-FMT-treated mice. f Distribution of the absolute log2-fold change in FMT and AC-FMT-treated mice on POD2 among genes differently expressed in either condition (Mann–Whitney test; P < 1 × 10−15).
Fig. 2
Fig. 2. FMT drives the clearance of systemically disseminated pathogens.
a–c In order to cause immediate systemic dissemination, the PC was injected directly into the peritoneum (IP) of mice. In the IP model, mice were not subjected to starvation, antibiotic treatment, or hepatectomy. To test the protective effects of FMT in this model, immediately upon injection of PC and then once more 14 h post injection, FMT or an AC-FMT was administered via enema. a Timeline of the IP sepsis model. b Kaplan–Meier survival curves (n = 21, 26, and 25 for PC, PC + FMT, and PC + AC-FMT-treated mice, respectively; Log-rank (Mantel–Cox) test; P = 0.001 between PC/PC + FMT, P = 0.4905 between PC/PC + AC-FMT, P < 0.0001 between PC + FMT/PC + AC-FMT). c Quantitative culture results of indicated sites comparing the PC burden of PC, PC + FMT, and PC + AC-FMT mice ~20 h post injection of PC. On radar plot, each dot along the axes represents the CFU/mL of blood and peritoneal fluid or CFU/mg of liver and spleen of one mouse, the further the distance from the center of the plot, the higher the pathogen burden. The third and first quartiles and the median are indicated with the edges of the colored boxes and the thick black line respectively (n = 5 mice/group); Kruskal–Wallis test/Dunn’s multiple comparisons test; PC burden significantly different between PC/PC + FMT in the blood [SM*], liver [KO**, SM*], peritoneum [CA*, KO*, SM*], and spleen [CA**, KO*]. PC burden significantly different between PC + AC-FMT/PC + FMT in the blood [EF**, KO*], liver [CA**, EF**, SM*], peritoneum [CA**, EF**, KO*], and spleen [EF*, KO*, SM*]. No significant differences between PC/PC + AC-FMT. *P ≤ 0.05, **P ≤ 0.01.
Fig. 3
Fig. 3. Clearance of systemically disseminated pathogens by FMT requires intact IRF3.
a Summary of transcriptional changes in the NF-κB/IRF3 signaling pathway downstream of various pattern recognition receptors in the cecum, liver, and spleen of PC + Surgery + AC-FMT mice on POD2. Red shaded circles are genes that are significantly upregulated, blue shaded circles are genes that are significantly downregulated. b Mice were injected i.p. with PC and treated with FMT or AC-FMT as before. RNA was isolated from indicated organs ~20 h post injection of PC and qPCR for IRF3 was performed. (Fold change compared with the mean of untreated group IRF3 relative expression for each organ; n = 7, 7, and 8 for untreated, PC + AC-FMT, and PC + FMT-treated mice, respectively; center is mean; one-way ANOVA/Tukey’s multiple comparison; *P ≤ 0.05, **P ≤ 0.01). c MEFs were cultured for 12 h in culture media containing filtered lysates made from cultured individual PC members, or from cecal contents of untreated mice at the indicated concentrations. MEF RNA was isolated and IRF3 expression was measured by qPCR. (Fold change compared with the baseline of untreated MEF IRF3 relative expression [highlighted with the dotted line at y = 1] shown; 3 independent experiments; n ≥ 3 for all conditions; mean + SD). d, e To assess the requirement for IRF3 in FMT-mediated protection, IRF3+/+ and IRF3−/− littermates were injected i.p. with PC and treated with FMT or AC-FMT as before. d Kaplan–Meier survival curves for genotypes and treatments indicated (n = 10, 7, 13, and 11 for IRF3+/+ mice with PC + FMT, IRF3+/+ mice with PC + AC-FMT, IRF3−/− mice with PC + FMT, and IRF3−/− mice with PC + AC-FMT, respectively; Log-rank (Mantel–Cox) test; P = 0.0469 between IRF3+/+ PC + FMT/IRF3+/+ PC + AC-FMT, P = 0.5440 between IRF3−/− PC + FMT/IRF3−/− PC + AC-FMT). e Quantitative culture results of indicated sites comparing the PC burden of PC + FMT-treated IRF3+/+ and IRF3−/− mice ~20 h post injection of PC. On radar plot, each dot along the axes represents the CFU/mL of blood and peritoneal fluid or CFU/mg of liver and spleen of one mouse, the further the distance from the center of the plot, the higher the pathogen burden. The third and first quartiles and the median are indicated with the edges of the colored boxes and the thick black line respectively (n = 5 mice/group; Mann–Whitney test; PC burden significantly different between IRF3+/+ PC + FMT/IRF3−/− PC + FMT in the blood [EF*, SM*], liver [EF*, KO*, SM**], peritoneum [CA*, KO*, SM*], and spleen [EF*, KO*]. *P ≤ 0.05, **P ≤ 0.01).
Fig. 4
Fig. 4. Pathogen infection drives butyrate deficiency and butyrate can restore IRF3 in vitro.
a Mice were injected IP with PC and treated with FMT or AC-FMT as before. Cecal contents were collected ~20 h post injection of PC and butyrate levels were measured by GC–MS. (One-way ANOVA/Tukey’s multiple comparison, *P ≤ 0.05, **P ≤ 0.01). b Analysis of the OTUs found in the datasets reveals that FMT increases the presence and abundance of butyrate-producing bacteria. Changes in specific OTUs between mice treated with or without FMT were detected using the R packages phyloseq and DESeq2,. The figure depicts significant log2-fold changes based on an FDR (Benjamini–Hochberg) significance threshold of 0.01 in the relative abundance of specific OTUs between PC and PC + FMT mice as heatmaps. Representative sequences for each of these OTUs were then used to search the Ribosomal Database Project’s set of quality-controlled, aligned, and annotated bacterial 16S rRNA sequences using SeqMatch in order to obtain nearest neighbor matches with cultured representatives at the genus-species level. On the left are the phylum and family classifications of the OTUs and on the right are the putative genus/species designation (numbers in parentheses indicate SeqMatch score [Sab]). The panel to the right of the heatmaps indicate whether butyrate kinase (buk) or butyryl-CoA:acetate CoA-transferase (but) encoding genes have been detected in the genomes of the SeqMatch genus/species assignments based on the buk and but entries in the RDP FunGene functional gene pipeline and repository. A closed black circle indicates the presence of a buk or but gene in that genome, whereas a closed gray circle indicates an alternate annotation (defined at the bottom of the figure). An open circle indicates that no match was found in the RDP FunGene. Those listed in bold on the right are enriched in the PC + FMT mice. c MEFs were treated with of equal concentrations of filtered lysates from all four PC members (250 ng/mL) in the absence (striped) or presence of indicated amounts of compounds for 12 h. MEF RNA was isolated and qPCR was performed to measure the effect of PC members on IRF3 expression in vitro (fold change compared with the baseline of untreated MEF IRF3 relative expression [highlighted with the dotted line at y = 1] shown; three independent experiments; n ≥ 3 for all conditions; mean + SD).

References

    1. Laxminarayan R, et al. Antibiotic resistance-the need for global solutions. Lancet Infect. Dis. 2013;13:1057–1098. doi: 10.1016/S1473-3099(13)70318-9. - DOI - PubMed
    1. WHO. Antimicrobial resistance: global report on surveillance 2014. WHO. http://www.who.int/drugresistance/documents/surveillancereport/en/. (Accessed: 28th June 2018).
    1. Alverdy JC, Krezalek MA. Collapse of the microbiome, emergence of the pathobiome, and the immunopathology of sepsis. Crit. Care Med. 2017;45:337–347. doi: 10.1097/CCM.0000000000002172. - DOI - PMC - PubMed
    1. Zaborin A, et al. Membership and behavior of ultra-low-diversity pathogen communities present in the gut of humans during prolonged critical illness. MBio. 2014;5:e01361-01314. doi: 10.1128/mBio.01361-14. - DOI - PMC - PubMed
    1. Sommer MOA, Dantas G, Church GM. Functional characterization of the antibiotic resistance reservoir in the human microflora. Science. 2009;325:1128–1131. doi: 10.1126/science.1176950. - DOI - PMC - PubMed

Publication types