. 2020 Jun;26(6):932-940.
doi: 10.1038/s41591-020-0858-8. Epub 2020 May 11.

T cell-inducing vaccine durably prevents mucosal SHIV infection even with lower neutralizing antibody titers

Affiliations

T cell-inducing vaccine durably prevents mucosal SHIV infection even with lower neutralizing antibody titers

Prabhu S Arunachalam et al. Nat Med. 2020 Jun.

Abstract

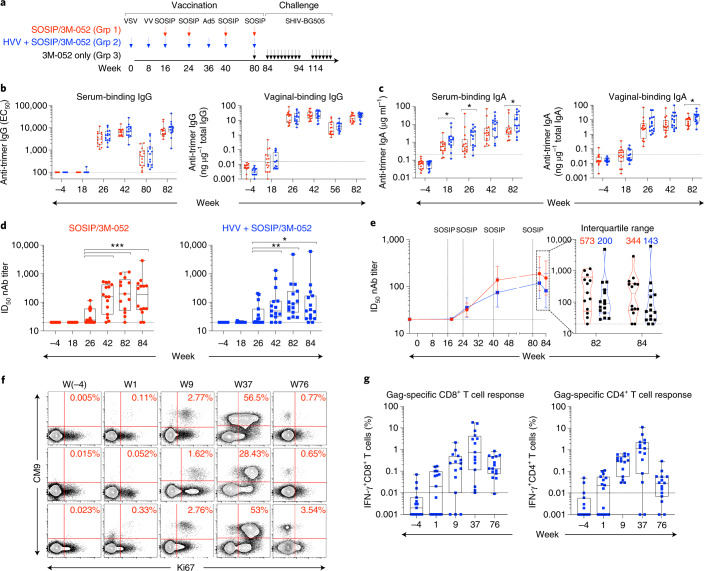
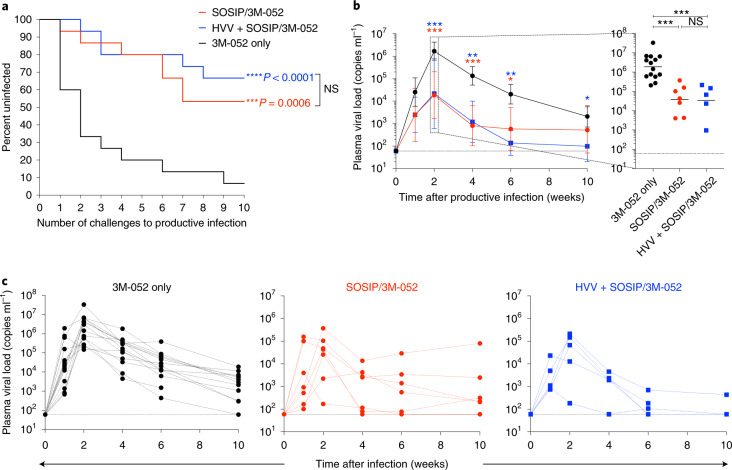
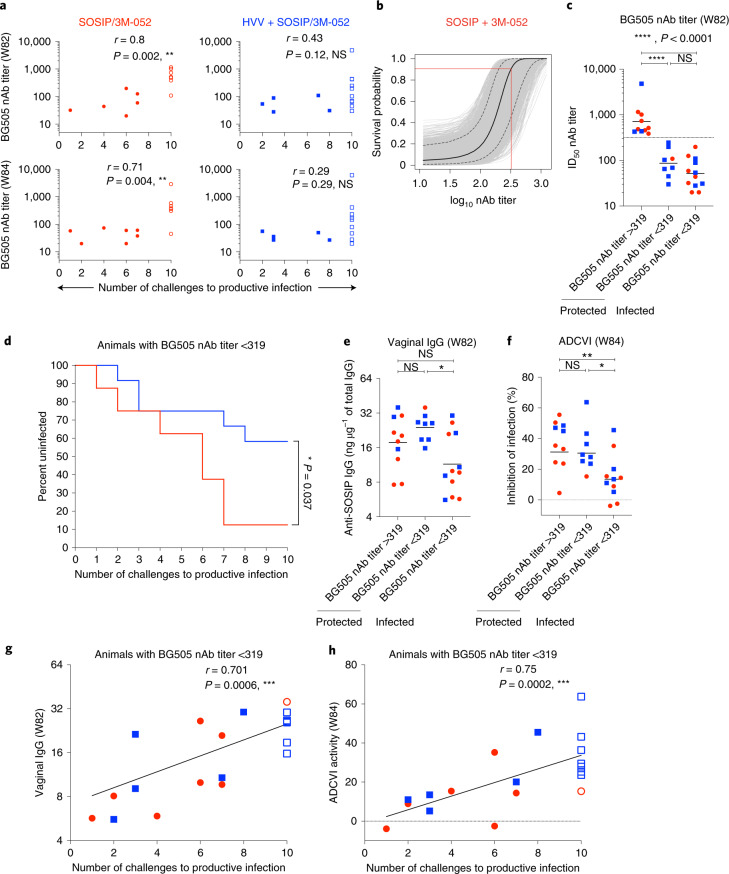
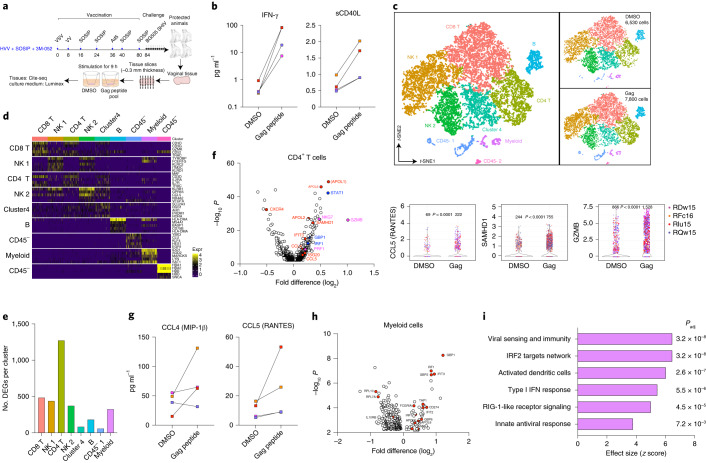
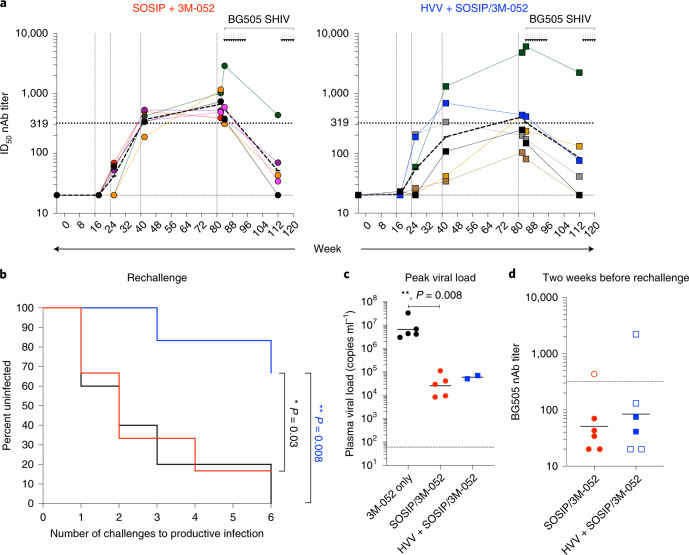
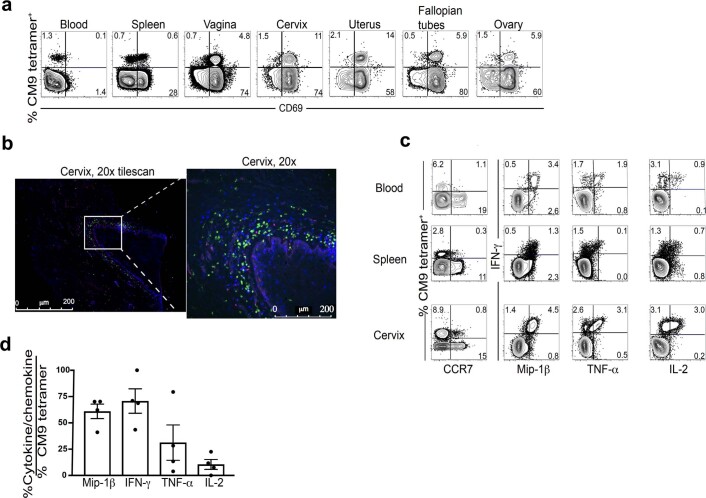
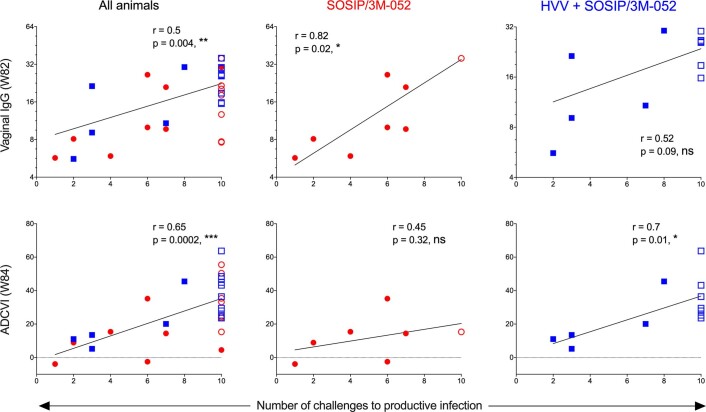
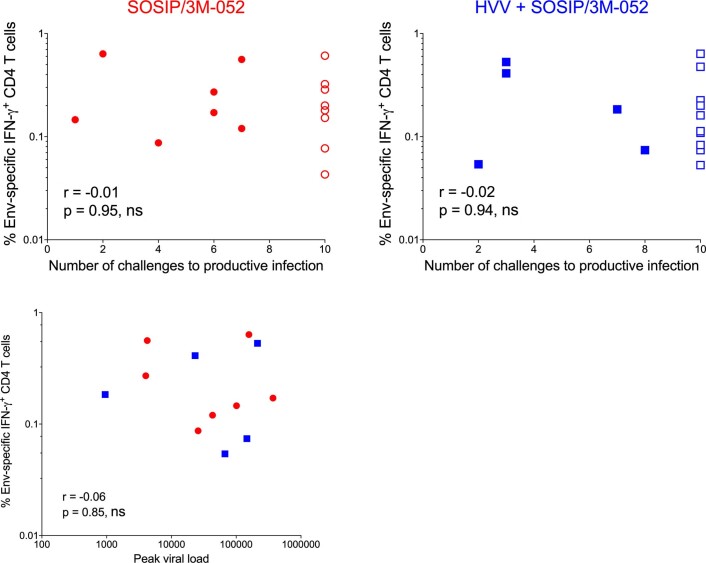
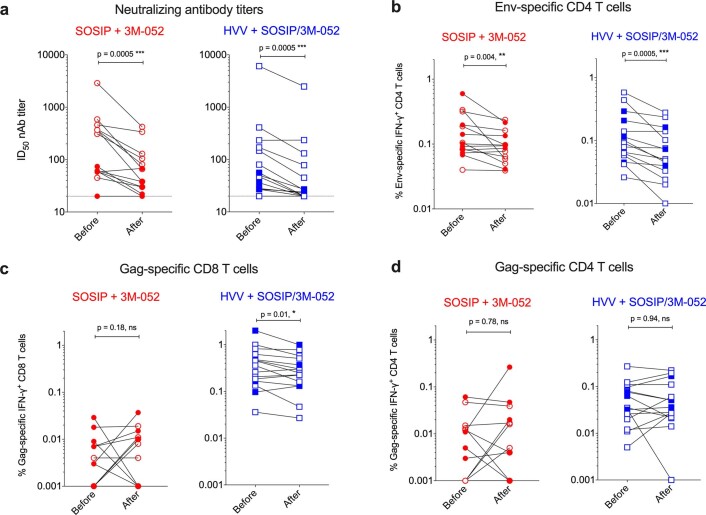
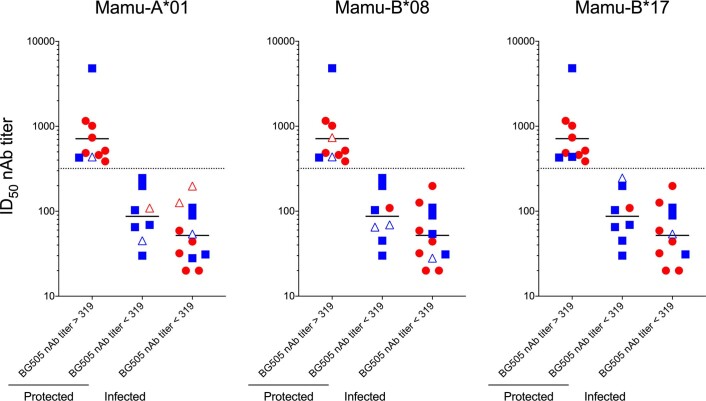
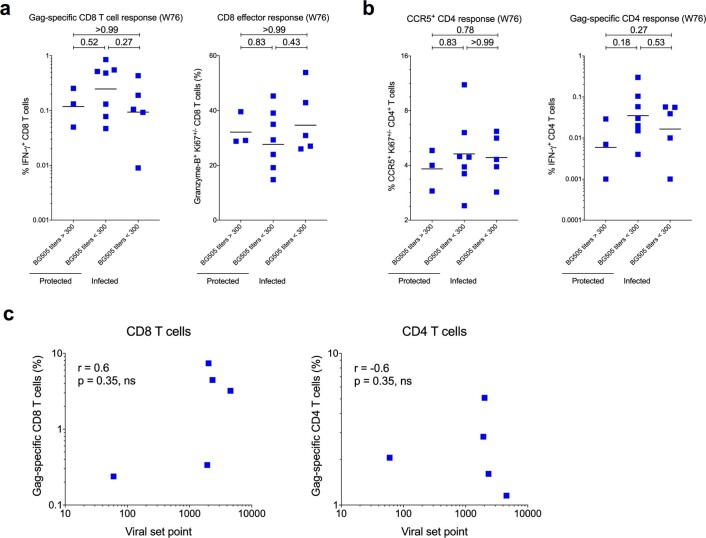
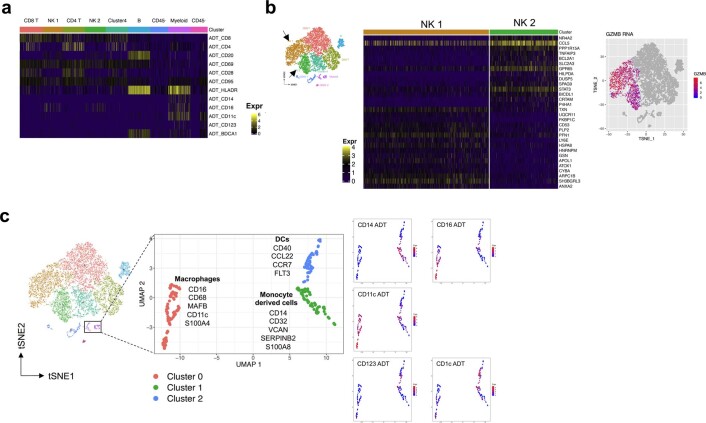
Recent efforts toward an HIV vaccine focus on inducing broadly neutralizing antibodies, but eliciting both neutralizing antibodies (nAbs) and cellular responses may be superior. Here, we immunized macaques with an HIV envelope trimer, either alone to induce nAbs, or together with a heterologous viral vector regimen to elicit nAbs and cellular immunity, including CD8+ tissue-resident memory T cells. After ten vaginal challenges with autologous virus, protection was observed in both vaccine groups at 53.3% and 66.7%, respectively. A nAb titer >300 was generally associated with protection but in the heterologous viral vector + nAb group, titers <300 were sufficient. In this group, protection was durable as the animals resisted six more challenges 5 months later. Antigen stimulation of T cells in ex vivo vaginal tissue cultures triggered antiviral responses in myeloid and CD4+ T cells. We propose that cellular immune responses reduce the threshold of nAbs required to confer superior and durable protection.


Conflict of interest statement

M.T. and J.V. are employees of 3M, the manufacturer of 3M-052 used as an adjuvant in this study.

Figures

Fig. 1
Fig. 1. Immunization with SOSIP/3M-052 induces robust antibody responses.
a, Schematic representation of immunization groups (Grp) and regimens. The arrows (color coded as indicated) denote when various immunizations were given, with the time in weeks also recorded. b,c, Anti-trimer IgG- and IgA-binding antibodies measured in serum and vaginal secretions of vaccinated animals collected at the indicated time points. The asterisks represent significant differences between the groups at a time point as measured by Mann–Whitney rank-sum test (two-tailed, *P < 0.05). EC50, half-maximum effective concentration. d, Serum nAb ID50 titers to BG505.T332N pseudovirus. The asterisks represent statistically significant differences between time points as measured by a Wilcoxon matched-pairs signed-rank test (two-tailed, *P < 0.05, **P < 0.01 and ***P < 0.001). e, A line plot to compare the magnitude of autologous nAb ID50 titers between SOSIP/3M-052 and HVV + SOSIP/3M-052 groups. The violin plots on the right show the distribution of responses at 2 and 4 weeks after the last SOSIP/3M-052 immunization (at weeks 82 and 84). Each symbol represents an individual animal and the median values are indicated by black dotted horizontal lines. The 25th and 75th percentiles are indicated by the colored (red or blue) dashed lines. f, Flow cytometry plots representing Gag-CM9 tetramer and Ki67 expression by CD8+ T cells (gated as live CD3+CD8+ singlets) in blood collected at time points indicated on the top. Data from the three Mamu-A*01 animals in the HVV + SOSIP/3M-052 group are shown. g, Gag-specific CD8+ and CD4+ T cell responses measured in blood at the time points (baseline, 1 week after each vaccination and 8 weeks before challenge) indicated on the x axis are plotted. The percentage Gag-specific IFN-γ response was calculated by subtracting the frequency of IFN-γ+ T cells in the DMSO-treated cells from the values recorded after stimulation with the Gag peptide pool. In bg, sample sizes were n = 15 per group at all time points, except week 82; at week 82, n = 13 in the SOSIP/3M-052 group because serum could not be collected from two animals. In box plots, each symbol represents an animal. The box shows median, upper and lower quartiles. The whiskers show 5th to 95th percentiles. Red and blue colors indicate immunization groups 1 and 2, respectively.
Fig. 2
Fig. 2. Protection against intravaginal low-dose autologous SHIV challenge.
a, Kaplan–Meier survival curves showing the fraction of uninfected animals following each challenge (n = 15 in each group). The ‘number of challenges to productive infection’ used in the x axis was defined as the time point 2 weeks before the first detection of viremia. P values (two-tailed) denote statistically significant differences calculated by log-rank (Mantel–Cox) test (NS, not significant, P = 0.56). b, Plasma viral load at various time points after infection (geometric mean ± s.e.m.), n = 14, 7 and 5 in 3M-052 only, SOSIP/3M-052 and HVV + SOSIP/3M-052 groups, respectively. The week before the first detection of viremia was considered as W0. The peak viral load for each of the infected animals is shown on the right. Asterisks denote statistically significant differences in comparison to the 3M-052 control (black) group, as measured by Mann–Whitney rank-sum test (two-tailed, ***P < 0.001, **P < 0.01 and *P < 0.05). c, Longitudinal viral load profile for each infected animal is shown.
Fig. 3
Fig. 3. Immune correlates of protection.
a, Spearman’s correlation between serum autologous nAb ID50 titers at 2 weeks before (top) and on (bottom) the day of first challenge (weeks 82 and 84, respectively) and the rate of acquisition of infection in the SOSIP/3M-052 (red circles) and HVV + SOSIP/3M-052 (blue squares) immunization groups, as indicated (n = 15 in each group at both time points except n = 13 in SOSIP/3M-052 group at week 82). Open symbols indicate animals uninfected at the end of ten challenges. b, The probability of survival defined by logistic regression analysis of autologous nAb ID50 titers at 2 weeks before the day of first challenge and rate of acquisition of infection in the SOSIP/3M-052 group (n = 13). The median probability (black curve) and the 5% and 95% confidence limits (dotted curves) are shown. Red lines extrapolate the neutralization titer (319) associated with 90% survival probability. c, Autologous nAb titers in animals (groups indicated by red and blue as in a, n = 15 in each group) clustered by infection status and nAb cutoff value of 319 identified in b. Geometric means are shown. Statistical differences were analyzed using two-tailed Mann–Whitney rank-sum test (NS, P = 0.16). d, Kaplan–Meier survival curve comparing only the animals with autologous nAb titers <319 (n = 7 in SOSIP/3M-052 group and n = 12 in HVV + SOSIP/3M-052 group). P value (two-tailed) denotes statistically significant difference calculated by log-rank (Mantel–Cox) test. e,f, Anti-SOSIP vaginal IgG quantity at week 82 and ADCVI activity measured in week 84 serum, respectively, are plotted for animals clustered by infection status and nAb titer (n = 15 in each immunization group). The ADCVI data represent the average of two independent assays using two different PBMC donors. Medians are shown. Statistical differences were analyzed using a Mann–Whitney rank-sum test (**P = 0.006, *P < 0.05). g,h, Spearman’s correlation between the rate of acquisition of infection and anti-SOSIP vaginal IgG at 2 weeks before challenge (week 82) or ADCVI activity on the day of challenge (week 84) in animals with autologous nAb titers <319 (n = 7 in SOSIP/3M-052 group and n = 12 in HVV + SOSIP/3M-052 group). In all correlation plots, r and P represent Spearman’s r and two-tailed P values.
Fig. 4
Fig. 4. Single-cell RNA-seq analysis of vaginal tissues stimulated ex vivo with Gag peptide pool.
a, A schematic representation of the analysis of four protected animals in the HVV + SOSIP/3M-052 group. b, Concentration of IFN-γ and sCD40L in culture supernatants as measured by Luminex assay. Each symbol represents an individual animal. c, Transcriptome-based clustering of 14,571 CITE-seq single-cell expression profiles visualized by t-SNE in two-dimensional space. The smaller clusters on the right show distribution of cells from DMSO or Gag peptide pool stimulation conditions. d, Heat map reporting scaled and log-transformed expression (Expr) of transcripts; discriminative markers are indicated on the right of each cluster indicated on the left and top. Expression levels are plotted in 100 cells randomly selected per cluster. e, Number of significantly induced genes per cluster following stimulation with Gag peptide pool, compared to DMSO control, are plotted. f, Volcano plot showing DEGs in the CD4+ T cell cluster (n = 2,394 cells). Genes highlighted in blue are prototype IFN-induced genes, markers of cytolytic activity are highlighted in magenta and well-known HIV-restriction factors are highlighted in red. Violin plots on the right show number of cells in each condition that express the markers indicated. Statistical differences were analyzed using two-tailed Mann–Whitney rank-sum test. g, Concentration of MIP-1β and RANTES in culture supernatants measured using Luminex and ELISA, respectively. h, Volcano plot showing DEGs between cells treated with DMSO or the Gag peptide pool in the myeloid cell cluster (n = 288 cells). IFN-induced antiviral genes are highlighted in red. i, Pathway analysis showing blood transcriptional modules that were significantly upregulated following stimulation with the Gag peptide pool. False discovery rate-corrected P values are indicated on the right. All DEGs and pathways in e,f,h and i are defined by two-tailed Mann–Whitney rank-sum test with false discovery rate-corrected P < 0.05.
Fig. 5
Fig. 5. Durability of vaccine-induced protection.
a, Kinetics of nAb titers in animals re-challenged (second set of six arrows) after surviving initial challenges (first set of ten arrows), for each immunization group. Each color represents an individual animal. The dark discontinuous lines indicate geometric mean titers for each group. b, Kaplan–Meier survival curves showing the fraction of uninfected animals following each challenge. Six animals from SOSIP/3M-052 (red) and HVV + SOSIP/3M-052 (blue) groups that survived the initial ten challenges were re-challenged a further six times (see a). The black curve indicates five control animals that were challenged six times over the same period. P values (two-tailed) denote statistically significant differences calculated by log-rank (Mantel–Cox) test. c, The peak plasma viral loads of animals infected during the re-challenge. Geometric means are indicated. Statistical differences were analyzed using a two-tailed Mann–Whitney rank-sum test (**P = 0.008). d, Autologous nAb titers measured 2 weeks before re-challenge (at week −112). Closed and open symbols indicate animals that were infected and uninfected, respectively, after the six additional challenges (n = 6). Geometric means are indicated by horizontal lines.
Extended Data Fig. 1
Extended Data Fig. 1. Assessment of serum autologous nAb titers.
a, Kinetics of serum nAb titers measured against BG505.T332N pseudovirus measured in the Duke Central Laboratory. Each symbol represents an individual animal. The dark discontinuous lines show geometric mean titers. The asterisks represent statistically significant differences between time points as measured by the Wilcoxon matched-pairs signed rank test (two-tailed, ***p = 0.0006 and ****p < 0.0001). b, Spearman’s correlation between autologous nAb titers measured in week 82 sera by the Duke and Emory laboratories. In correlation plots, r and p represent Spearman’s r and two-tailed p values. c, NAb ID50 titers in week 84 sera measured against replication-competent SHIV-BG505 (Emory laboratory) produced in HEK293T cells. Geometric means are indicated. Statistical differences were analyzed using two-tailed Mann-Whitney rank sum test (ns, p = 0.96). n = 15 per group in all the panels except week 82 at which n = 13 in the SOSIP/3M-052 group).
Extended Data Fig. 2
Extended Data Fig. 2. Env-specific CD4 T cell responses.
a, Env-specific CD4+ T cell responses measured in blood at the time points (Baseline and 1 week after each vaccination) indicated on the X-axis are plotted. Each symbol represents an animal. The box shows median, upper and lower quartiles, and the whiskers represent 5–95 percentiles (n = 15 in each group). The %Env-specific IFN-γ response was calculated by subtracting the frequency of IFN-γ+ T cells in the DMSO-treated cells from the values recorded after stimulation with the Env peptide pool. b, Spearman’s correlation between serum autologous nAb ID50 titers and Env-specific IFN-γ+ CD4 T cells. The red circles and blue squares represent SOSIP/3M-052 (n = 13) and HVV + SOSIP/3M-052 (n = 15) groups, respectively. The r and p values represent Spearman’s r and two-tailed p values.
Extended Data Fig. 3
Extended Data Fig. 3. Correlation of serum nAb titers with serum and vaginal trimer-binding titers.
Spearman’s correlation between serum autologous nAb ID50 titers at week 82, the peak time point of the response, and serum binding IgG titers (upper panels) and vaginal binding IgG titers (lower panels), at the corresponding time points. SOSIP/3M-052 (n = 13) and HVV + SOSIP/3M-052 (n = 15) immunization groups are indicated by red circles and blue squares, respectively. The r and p values represent Spearman’s r and two-tailed p values.
Extended Data Fig. 4
Extended Data Fig. 4. HVV vaccination establishes abundant, functional Gag-specific CD8+ T cells with a resident memory phenotype in the female genital tract.
a, Four Mamu-A*01+ animals receiving HVV vaccinations (from the previous study) were necropsied >100 days post Ad5-Gag vector administration. Lymphocytes isolated from blood, spleen, vagina, cervix, uterus, fallopian tubes and ovaries were analyzed by flow cytometry. CD8+ T cells were gated as CD20, CD3+, CD4, CD8+ cells. b, Immunohistochemical staining of fresh cervical tissue as in a was incubated with Gag-CM9 tetramer, snap frozen and sectioned. The sections were stained with CD8 and CD4 antibodies. Gag-CM9 tetramer is shown in red, CD8 in blue and CD4 in green. c, Representative flow cytometry plots of direct ex vivo Gag-CM9 tetramer staining (left column) and in vitro cytokine stimulation with CM9 peptide (right three columns) of blood, spleen and female genital tract lamina propria CD8+ T cells gated as in a. Analyses in panels b and c were a representative of analysis from 4 independent animals. d, Ratio of frequency of cytokine+ or chemokine+ cells (mean ± SEM) after in vitro peptide stimulation to Gag-CM9+ cells after direct ex vivo stain from all animals as in a.
Extended Data Fig. 5
Extended Data Fig. 5. Correlation of vaginal binding IgG and ADCVI responses with protection.
Spearman’s correlation between vaginal IgG response at week 82 (top panels) and ADCVI at week 84 (bottom panels) with rate of acquisition of infection. The analysis included all animals (n = 15 per group) from both vaccine groups irrespective of the nAb titers (left panel), animals with nAb titers < 319 in the SOSIP/3M-052 group (middle panel, n = 8) or HVV + SOSIP/3M-052 group (right panel, n = 12). SOSIP/3M-052 and HVV + SOSIP/3M-052 immunization groups are indicated by red circles and blue squares, respectively. Open symbols indicate animals uninfected at the end of 10 challenges. The r and p values represent Spearman’s r and two-tailed p values.
Extended Data Fig. 6
Extended Data Fig. 6. Correlation of Env-specific CD4 T cell responses with protection.
Spearman’s correlation between Env-specific CD4 T cell frequencies at week 81 (3 weeks prior to challenge, n = 15) and rate of acquisition of infection (a), and peak viral load, n = 12 infected animals in total (b). SOSIP/3M-052 and HVV + SOSIP/3M-052 immunization groups are indicated by red circles and blue squares, respectively. Open symbols indicate animals uninfected at the end of 10 challenges. The r and p values represent Spearman’s r and two-tailed p values.
Extended Data Fig. 7
Extended Data Fig. 7. Autologous nAb and T cell responses before and after challenge.
a, Autologous nAb titers in animals (SOSIP + 3M-052 and HVV + SOSIP/3M-052 groups indicated by red and blue) measured at weeks 84 and 94, the day of the first and last of the ten challenges. For animals infected before week 94, we used sera collected two weeks before the detection of viremia, the predicted actual day of infection. Env-specific CD4 T cell (b); Gag-specific CD8 (c) and CD4 T cell (d) responses in PBMCs harvested before and after the first 10 challenges. For animals infected before week 94, PBMCs harvested at a time point before actual infection were used. Open and closed symbols indicate animals uninfected or infected after the 10 challenges. Wilcoxon paired test was used for statistical analysis of all panels. All p-values are based on two-tailed tests. N = 15 per group in all the panels.
Extended Data Fig. 8
Extended Data Fig. 8. Classification of animals based on the magnitude of autologous nAb titers and infection status.
Autologous nAb titers in animals (SOSIP + 3M-052 and HVV + SOSIP/3M-052 groups indicated by red and blue) classified by infection status. The open triangles represent animals expressing restrictive MHC alleles mentioned in the headings. N = 15 per immunization group in all the panels.
Extended Data Fig. 9
Extended Data Fig. 9. Correlates of protection in the HVV + SOSIP/3M-052 group.
a, Gag-specific IFN-γ+ CD8+ T cell and granzyme B+ effector CD8+ T cell responses in group 2 animals classified by infection status. b, Frequencies of Gag-specific IFN-γ+ CD4+ T cells or CCR5+ CD4+ T cells at week 76, the available time point closest to the challenge, in animals classified by infection status and nAb titers. N = 15 in panels a and b. The horizontal lines indicate geometric means. c, Spearman’s correlation between Gag-specific IFN-γ+ CD8 (left panel) or CD4 (right panel) T cells and viral set point (n = 5 infected animals). The r and p values represent Spearman’s r and two-tailed p values.
Extended Data Fig. 10
Extended Data Fig. 10. Analysis of single-cell clusters identified by gene expression profiles.
a, Heat-map reporting scaled and log-transformed expression of ADTs by the cell clusters indicated on the top. Expression levels are plotted in 100 cells randomly selected per cluster. b, Heat-map showing expression of genes discriminative of NK cell clusters 1 and 2 (3,099 and 1,688 cells, respectively). c, Sub-clustering of myeloid cells (288 cells) by hierarchical clustering of ADT expression. The myeloid cell clusters are visualized by UMAP and the genes discriminative of each cluster is shown. The expression levels of ADT signals are plotted on the right.

Similar articles

Cited by

References

    1. Rerks-Ngarm S, et al. Vaccination with ALVAC and AIDSVAX to prevent HIV-1 infection in Thailand. N. Engl. J. Med. 2009;361:2209–2220. - PubMed
    1. Gautam R, et al. A single injection of anti-HIV-1 antibodies protects against repeated SHIV challenges. Nature. 2016;533:105–109. - PMC - PubMed
    1. Shingai M, et al. Passive transfer of modest titers of potent and broadly neutralizing anti-HIV monoclonal antibodies block SHIV infection in macaques. J. Exp. Med. 2014;211:2061–2074. - PMC - PubMed
    1. Pegu A, et al. A meta-analysis of passive immunization studies shows that serum-neutralizing antibody titer associates with protection against SHIV challenge. Cell Host Microbe. 2019;26:336–346. - PMC - PubMed
    1. Bar KJ, et al. Effect of HIV antibody VRC01 on viral rebound after treatment interruption. N. Engl. J. Med. 2016;375:2037–2050. - PMC - PubMed

Publication types

MeSH terms