

Structure of a cyanobacterial photosystem I surrounded by octadecameric IsiA antenna proteins
- PMID: 32393811
- PMCID: PMC7214436
- DOI: 10.1038/s42003-020-0949-6
Structure of a cyanobacterial photosystem I surrounded by octadecameric IsiA antenna proteins
Abstract
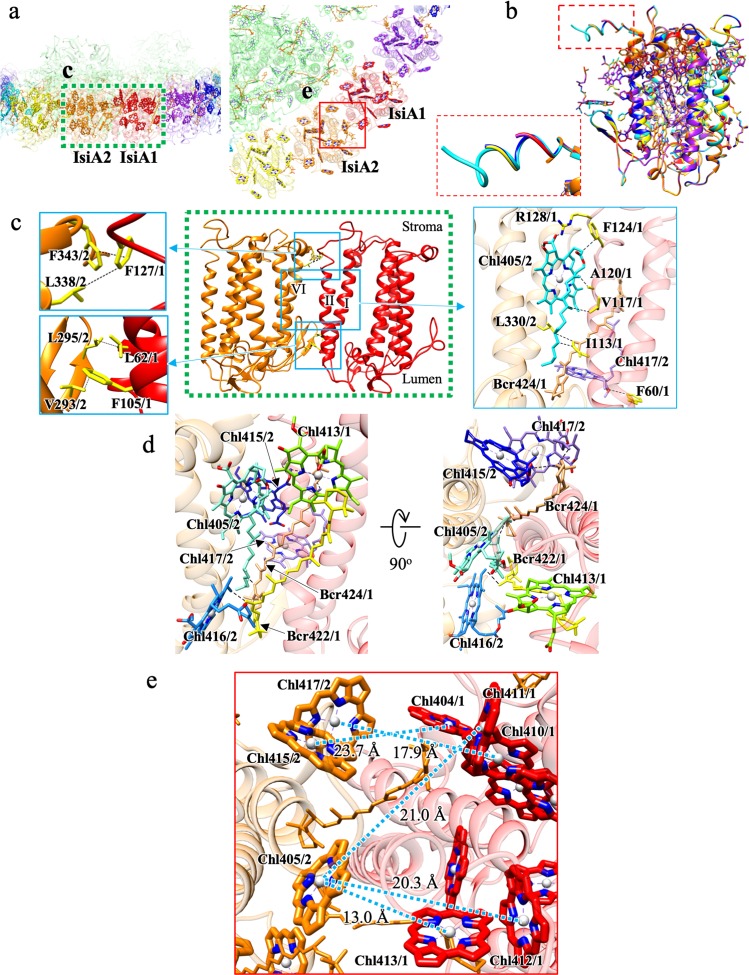
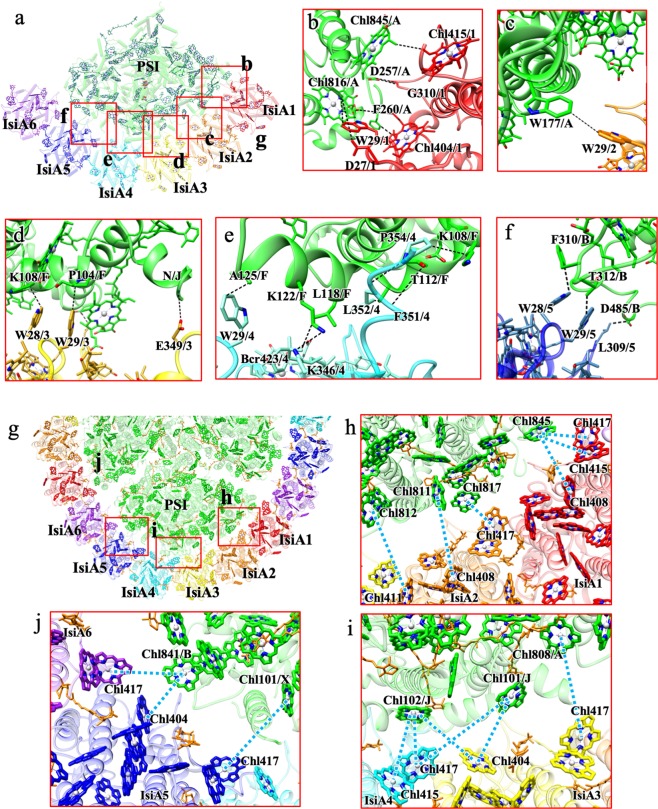
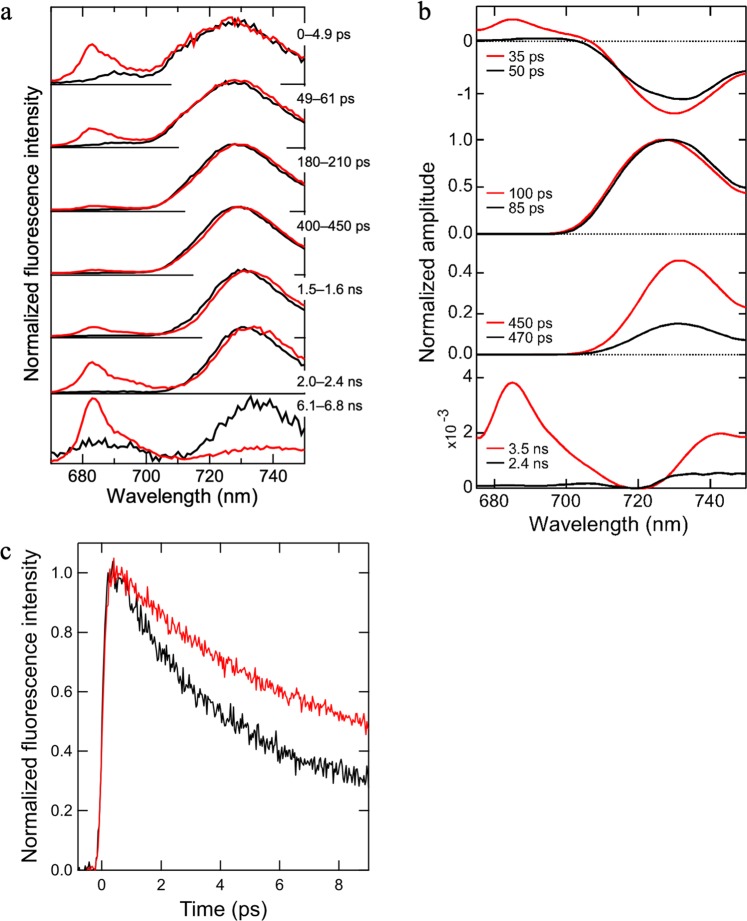
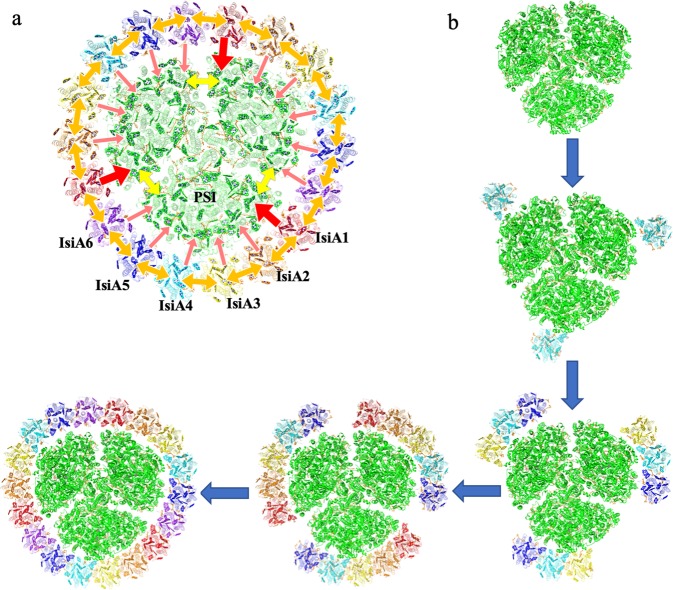
Iron-stress induced protein A (IsiA) is a chlorophyll-binding membrane-spanning protein in photosynthetic prokaryote cyanobacteria, and is associated with photosystem I (PSI) trimer cores, but its structural and functional significance in light harvesting remains unclear. Here we report a 2.7-Å resolution cryo-electron microscopic structure of a supercomplex between PSI core trimer and IsiA from a thermophilic cyanobacterium Thermosynechococcus vulcanus. The structure showed that 18 IsiA subunits form a closed ring surrounding a PSI trimer core. Detailed arrangement of pigments within the supercomplex, as well as molecular interactions between PSI and IsiA and among IsiAs, were resolved. Time-resolved fluorescence spectra of the PSI-IsiA supercomplex showed clear excitation-energy transfer from IsiA to PSI, strongly indicating that IsiA functions as an energy donor, but not an energy quencher, in the supercomplex. These structural and spectroscopic findings provide important insights into the excitation-energy-transfer and subunit assembly mechanisms in the PSI-IsiA supercomplex.
Conflict of interest statement
The authors declare no competing interests.
Figures


Similar articles
-
The molecular structure of the IsiA-Photosystem I supercomplex, modelled from high-resolution, crystal structures of Photosystem I and the CP43 protein.Biochim Biophys Acta. 2010 Apr;1797(4):457-65. doi: 10.1016/j.bbabio.2010.01.002. Epub 2010 Jan 11. Biochim Biophys Acta. 2010. PMID: 20064486
-
Structural basis for energy and electron transfer of the photosystem I-IsiA-flavodoxin supercomplex.Nat Plants. 2020 Feb;6(2):167-176. doi: 10.1038/s41477-020-0593-7. Epub 2020 Feb 10. Nat Plants. 2020. PMID: 32042157
-
Energy transfer and trapping in the Photosystem I complex of Synechococcus PCC 7942 and in its supercomplex with IsiA.Biochim Biophys Acta. 2004 Jun 7;1656(2-3):104-13. doi: 10.1016/j.bbabio.2004.02.002. Biochim Biophys Acta. 2004. PMID: 15178472
-
Structure and functional role of supercomplexes of IsiA and Photosystem I in cyanobacterial photosynthesis.FEBS Lett. 2005 Jun 13;579(15):3253-7. doi: 10.1016/j.febslet.2005.03.051. Epub 2005 Apr 7. FEBS Lett. 2005. PMID: 15943969 Review.
-
Structure and energy transfer pathways of the plant photosystem I-LHCI supercomplex.Curr Opin Struct Biol. 2016 Aug;39:46-53. doi: 10.1016/j.sbi.2016.04.004. Epub 2016 Apr 28. Curr Opin Struct Biol. 2016. PMID: 27131043 Review.
Cited by
-
Structure-based Hamiltonian model for IsiA uncovers a highly robust pigment-protein complex.J R Soc Interface. 2020 Aug;17(169):20200399. doi: 10.1098/rsif.2020.0399. Epub 2020 Aug 26. J R Soc Interface. 2020. PMID: 32842892 Free PMC article.
-
Trimeric photosystem I facilitates energy transfer from phycobilisomes in Synechocystis sp. PCC 6803.Plant Physiol. 2022 Jun 1;189(2):827-838. doi: 10.1093/plphys/kiac130. Plant Physiol. 2022. PMID: 35302607 Free PMC article.
-
Structural insights into a unique PSI-LHCI-LHCII-Lhcb9 supercomplex from moss Physcomitrium patens.Nat Plants. 2023 May;9(5):832-846. doi: 10.1038/s41477-023-01401-4. Epub 2023 Apr 24. Nat Plants. 2023. PMID: 37095225
-
A Novel Mode of Photoprotection Mediated by a Cysteine Residue in the Chlorophyll Protein IsiA.mBio. 2021 Feb 16;12(1):e03663-20. doi: 10.1128/mBio.03663-20. mBio. 2021. PMID: 33593975 Free PMC article.
-
Photosystem I: A Paradigm for Understanding Biological Environmental Adaptation Mechanisms in Cyanobacteria and Algae.Int J Mol Sci. 2024 Aug 12;25(16):8767. doi: 10.3390/ijms25168767. Int J Mol Sci. 2024. PMID: 39201454 Free PMC article. Review.
References
Publication types
MeSH terms
Substances
Supplementary concepts
LinkOut - more resources
Full Text Sources
