. 2020 Aug;4(8):832-843.
doi: 10.1038/s41562-020-0867-0. Epub 2020 May 11.

Predictors of risky foraging behaviour in healthy young people

Collaborators, Affiliations

Predictors of risky foraging behaviour in healthy young people

Dominik R Bach et al. Nat Hum Behav. 2020 Aug.

Abstract

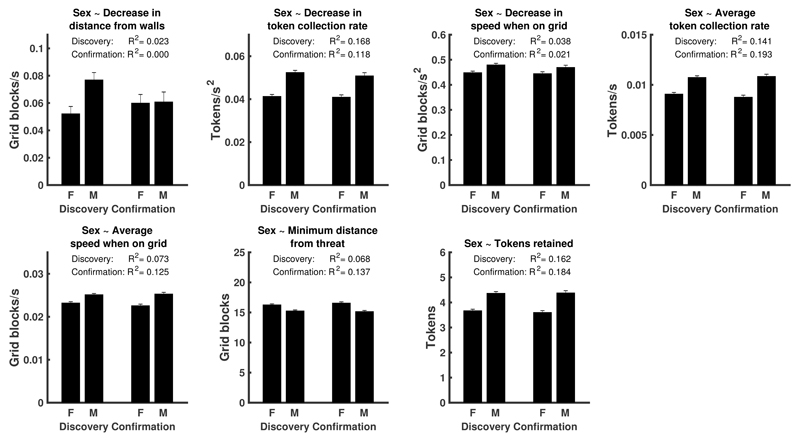
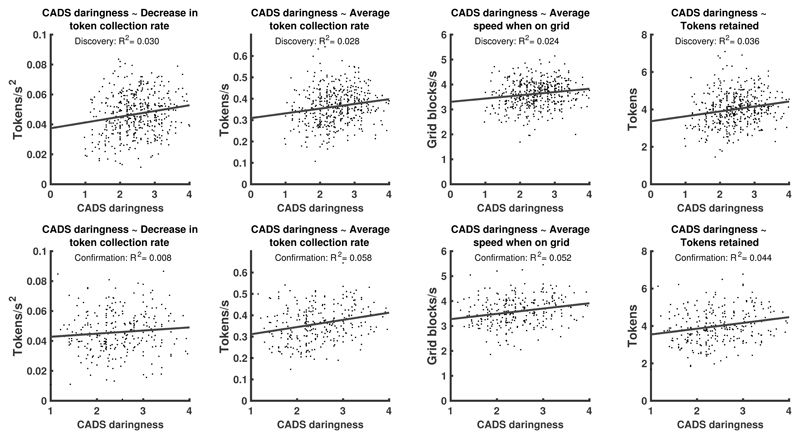
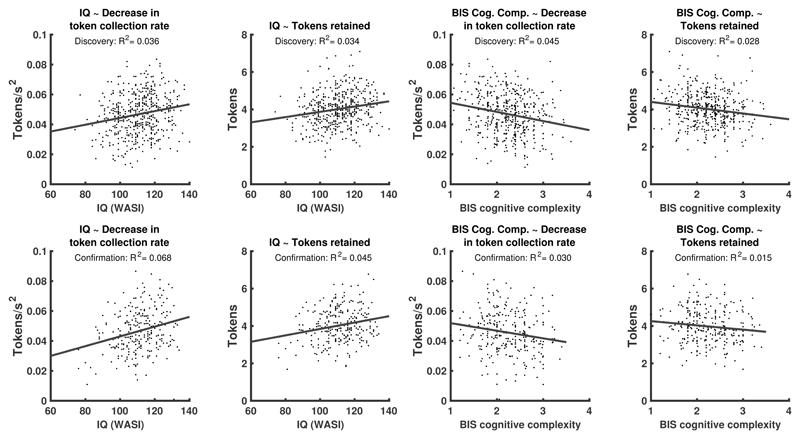
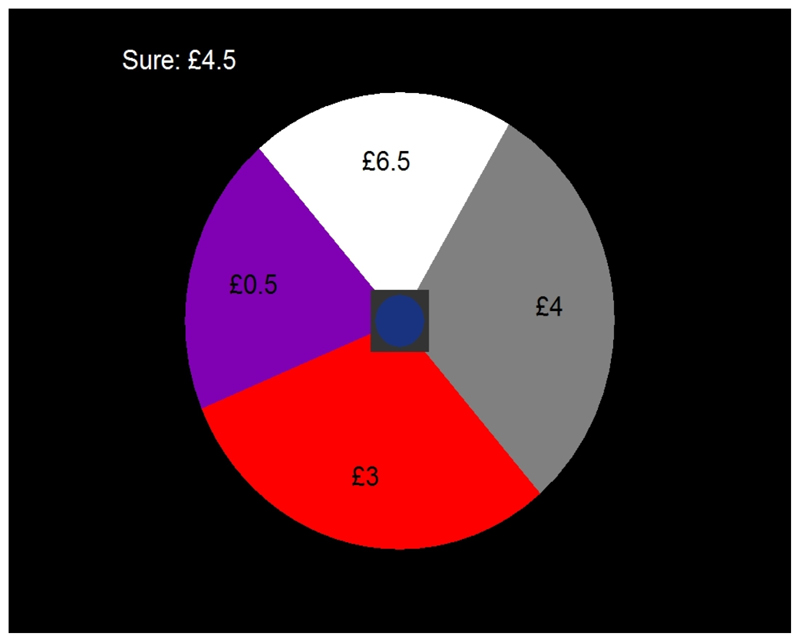
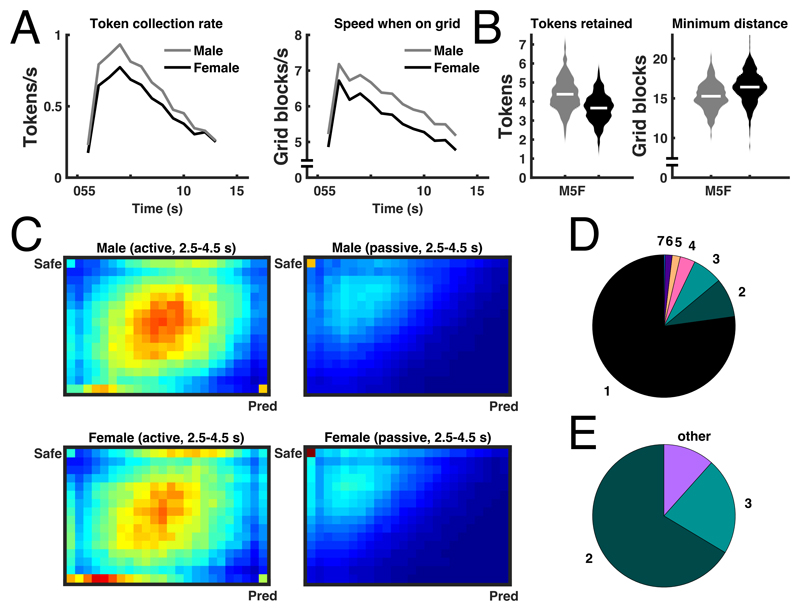
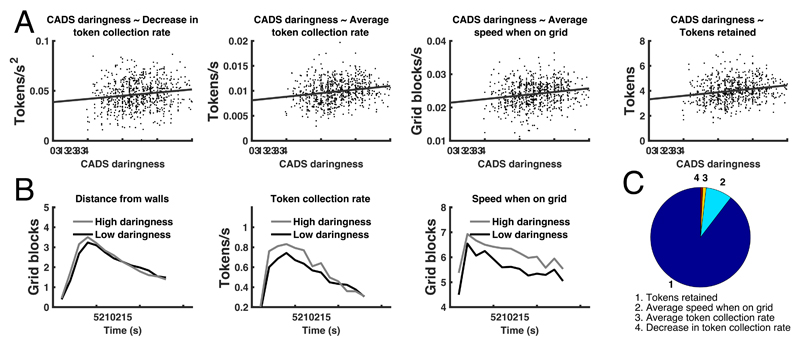
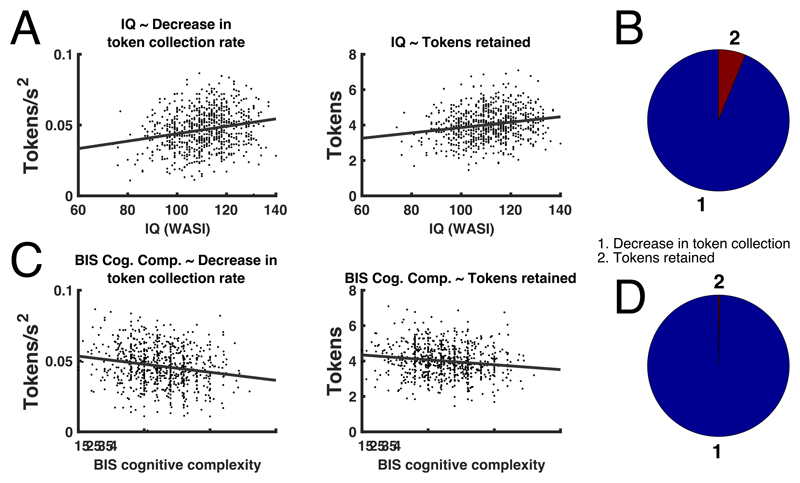
During adolescence and early adulthood, learning when to avoid threats and when to pursue rewards becomes crucial. Using a risky foraging task, we investigated individual differences in this dynamic across 781 individuals aged 14-24 years who were split into a hypothesis-generating discovery sample and a hold-out confirmation sample. Sex was the most important predictor of cautious behaviour and performance. Males earned one standard deviation (or 20%) more reward than females, collected more reward when there was little to lose and reduced foraging to the same level as females when potential losses became high. Other independent predictors of cautiousness and performance were self-reported daringness, IQ and self-reported cognitive complexity. We found no evidence for an impact of age or maturation. Thus, maleness, a high IQ or self-reported cognitive complexity, and self-reported daringness predicted greater success in risky foraging, possibly due to better exploitation of low-risk opportunities in high-risk environments.


Conflict of interest statement

Competing interests

The authors declare no competing interests.

Figures

Extended Data Fig. 1
Extended Data Fig. 1. Extraction of summary statistics from time-dependent variables.
Four summary statistics are extracted for each of 7 time-dependent task measures, and for their time-dependent weighted sum (example data). Blue: low threat probability; orange: high threat probability. Example data are averaged over the active/passive (ie. starting position) factor
Extended Data Fig. 2
Extended Data Fig. 2. Association of individual task variables with sex.
Results from linear regressions fitted separately on discovery and confirmation sample. See supplementary table 2 for statistical tests of the individual relations. To confirm these associations collectively, we fitted a multiple logistic regression on the discovery data (registered hypothesis H1), which was confirmed. See table 2 in main text for hypothesis summary and discovery/confirmation results. A multiple logistic regression across the entire sample weakly favoured a model with common regression weights over one with separate weights for discovery and confirmation sample (LBF = 2.8).
Extended Data Fig. 3
Extended Data Fig. 3. Association of individual task variables with CADS daringness.
Results from linear regressions fitted separately on discovery and confirmation sample. See supplementary table 2 for statistical tests of the individual relations. To confirm these associations collectively, we computed a multiple regression model on the discovery data (registered hypothesis H4), which was confirmed. See table 2 in main text for hypothesis summary and discovery/confirmation results. A multiple logistic regression across the entire sample favoured a model with common regression weights over one with separate weights for discovery and confirmation sample (LBF = 3.2). For the association of CADS with intra-epoch trajectories shown in figure 3 and Supplementary Table 2, we computed a multiple regression model with these three measures on the discovery data (registered hypothesis H7), which was confirmed (see table 2). A multiple logistic regression across the entire sample weakly favoured a model with common regression weights over one with separate weights for discovery and confirmation sample (LBF = 2.3).
Extended Data Fig. 4
Extended Data Fig. 4. Association of individual task variables with IQ and BIS cognitive complexity.
Results from linear regressions fitted separately on discovery and confirmation sample. See supplementary table 2 for statistical tests of the individual relations. To confirm the associations with IQ collectively, we computed a multiple regression model on the discovery data (registered hypothesis H3), which was confirmed. See table 2 in main text for hypothesis summary and discovery/confirmation results. A multiple logistic regression across the entire sample weakly favoured a model with common regression weights over one with separate weights for discovery and confirmation sample (LBF = 2.5). For BIS cognitive complexity, the multiple regression model (registered hypothesis H6) was confirmed as well (see table 2). A multiple logistic regression across the entire sample weakly favoured a model with common regression weights over one with separate weights for discovery and confirmation sample (LBF = 2.7).
Extended Data Fig. 5
Extended Data Fig. 5. Lottery (revealed economic preference) task.
The roulette task involved a choice between the sure amount (upper left) and a four-sector roulette, just complex enough to define an Expectation, Variance and Skewness over roulette outcomes. The square in the middle of the roulette indicated a timer to maintain a reasonable pace of trials.
Figure 1
Figure 1. Risky foraging task, building on rodent approach/avoidance conflict tests.
In each of 81 game 'epochs', the participant forages for monetary tokens on a grid, where a virtual predator can wake-up and give chase at any time. If caught, the player loses all tokens. Each epoch starts with a fresh 'life' and zero tokens. The result from randomly selected epochs is paid out in money at the end. Thus, players are incentivized to retain as many token as possible on each epoch.
Figure 2
Figure 2. Relation between sex and task measures.
A: Intra-epoch trajectories of token collection rate and speed when on grid, illustrating the sex differences in derived summary statistics (corresponding to measures 2-3, 5, 7 in panel D). B: Distribution of time-independent statistics for males and females: tokens retained (i.e. performance), and minimum distance from threat (corresponding to measures 1 and 4 in panel D). White lines: mean. Standard errors are smaller than line width and not displayed. C: Heat maps illustrating the probability of being in each position on the grid during 2.5-4.5 s after epoch start, for epochs in which the player starts in the predator position ('active') or in the safe place ('passive'). Females stay closer to the safe place and to the walls than males. D: Proportion of additionally explained variance by each task measure, after residualising already explained variance, and normalized for the overall explained variance. Labels for pie segments: 1. Tokens retained, 2. Average token collection rate, 3. Decrease in token collection rate, 4. Minimum distance from threat, 5. Decrease in speed when on grid, 6. Decrease in distance from walls, 7. Average speed when on grid. In terms of bivariate relations, sex explained in the combined sample 17.0% (12.4%-22.0%), 15.9% (11.5%-20.8%), 14.7% (10.4%-19.5%), 9.0% (5.5%-13.2%), 3.0% (1.1%-5.8%), 1.0% (0.1%-2.8%), and 9.1% (5.6%-13.3%) variance (parametric 95%-CI) of these task measures. E: Proportion of mediation of the sex effect on performance. Numeric pie segment labels are the same as in D; other: remaining proportion in the sex effect on performance, explained by variables that were not part of the mediation analysis and not included in 2-7. Supplementary Table 2 and Extended Data Figure 2 show results separately for discovery and confirmation sample.
Figure 3
Figure 3. Relation of self-reported daringness (CADS questionnaire) with task measures.
A: Individual task measures that relate to daringness. B: Average trajectories of the 20 highest-scoring and the 20 lowest-scoring individuals in the discovery sample for those measures in which daringness predicted trajectory similarity. C: Proportion of additionally explained variance by each task measure, after residualizing already explained variance, and normalized for the overall explained variance. In terms of bivariate relations, daringness explained, across the entire sample 3.9% (1.6%-7.1%), 3.4% (1.3%-6.4%), 3.9% (1.6%-7.0%), and 2.0% (0.5%-4.5%) variance (parametric 95%-CI) in the task measures as listed in C. Supplementary Table 2 and Extended Data Figure 3 show results separately for discovery and confirmation sample.
Figure 4
Figure 4. Relation of IQ (measured with WASI) and self-reported cognitive complexity (BIS questionnaire) with task measures.
A: Individual task measures that relate to IQ. B: Proportion of additionally explained variance by each task measure, after residualizing already explained variance, and normalized for the overall explained variance. In terms of bivariate relations, IQ explained, across the entire sample, 4.6% (2.1%-7.9%) and 3.8% (1.6%-6.9%) variance (parameteric 95%-CI) in the task measures as listed in B. C: Individual task measures that relate to self-reported cognitive complexity. D: Proportion of additionally explained variance by each task measure, after residualizing already explained variance, and normalized for the overall explained variance. In terms of bivariate relations, self-reported cognitive complexity explained, across the entire sample, 3,8% (1.5%-6.9%) and 2.2% (0.6%-4.8%) variance (95%-CI) in the task measures as listed in B. Supplementary Table 2 and Extended Data Figure 4 show results separately for discovery and confirmation sample.

References

    1. Lima SL, Dill LM. Behavioral decisions made under the risk of predation: a review and prospectus. Canadian journal of zoology. 1990;68:619–640.
    1. Cook C, Diamond R, Hall J, List JA, Oyer P. The gender earnings gap in the gig economy: Evidence from over a million rideshare drivers. National Bureau of Economic Research; 2018.
    1. Steinberg L. Risk taking in adolescence: what changes, and why? Annals of the New York Academy of Sciences. 2004;1021:51–58. - PubMed
    1. Schwebel DC, Severson J, Ball KK, Rizzo M. Individual difference factors in risky driving: the roles of anger/hostility, conscientiousness, and sensation-seeking. Accid Anal Prev. 2006;38:801–810. - PubMed
    1. Eaton DK, et al. Youth risk behavior surveillance--United States, 2007. MMWR Surveill Summ. 2008;57:1–131. - PubMed

Publication types