. 2020 Jun;52(6):615-625.
doi: 10.1038/s41588-020-0618-1. Epub 2020 May 11.

Uncoupling histone H3K4 trimethylation from developmental gene expression via an equilibrium of COMPASS, Polycomb and DNA methylation

Affiliations

Uncoupling histone H3K4 trimethylation from developmental gene expression via an equilibrium of COMPASS, Polycomb and DNA methylation

Delphine Douillet et al. Nat Genet. 2020 Jun.

Abstract

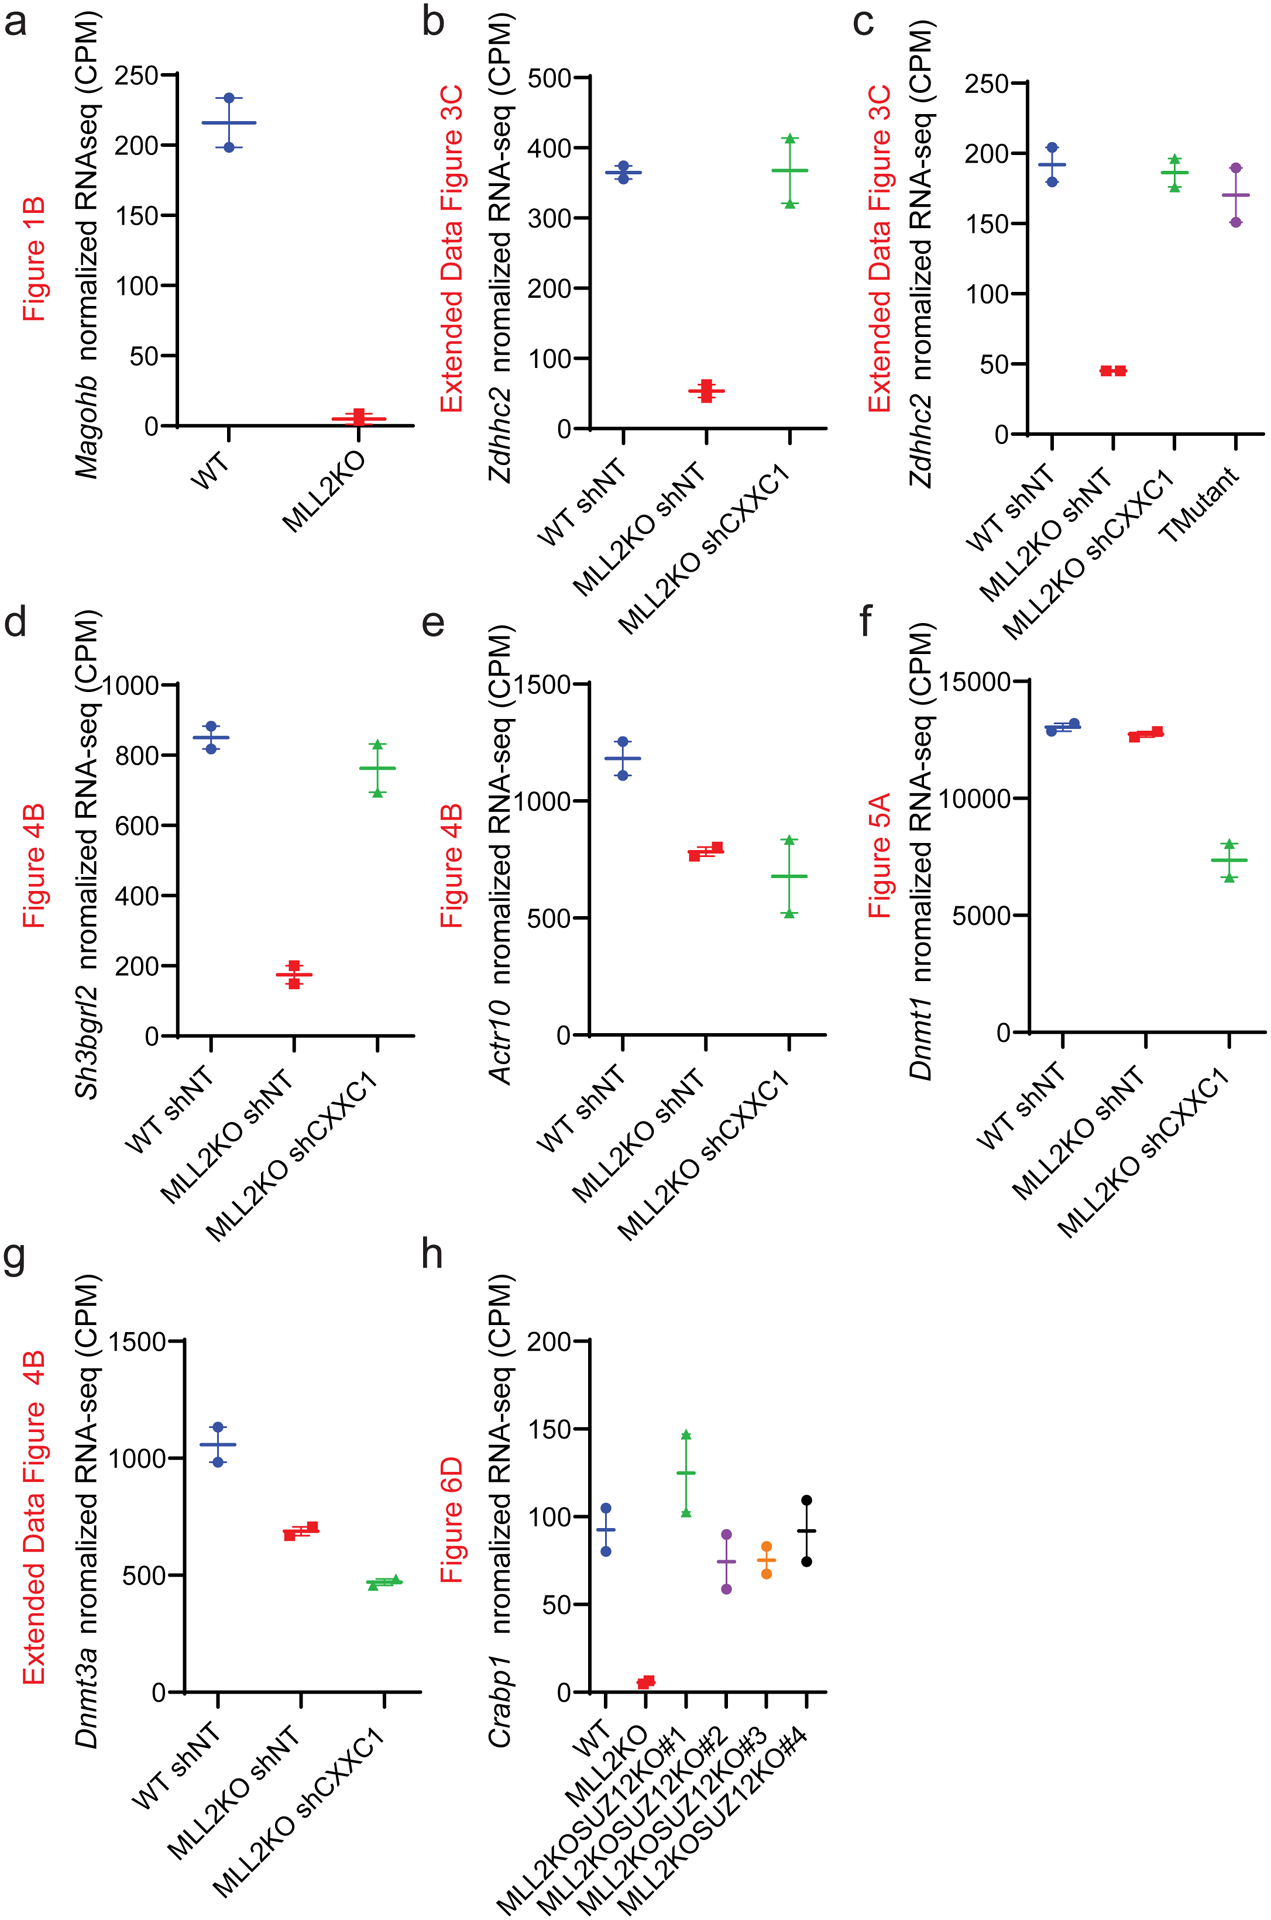
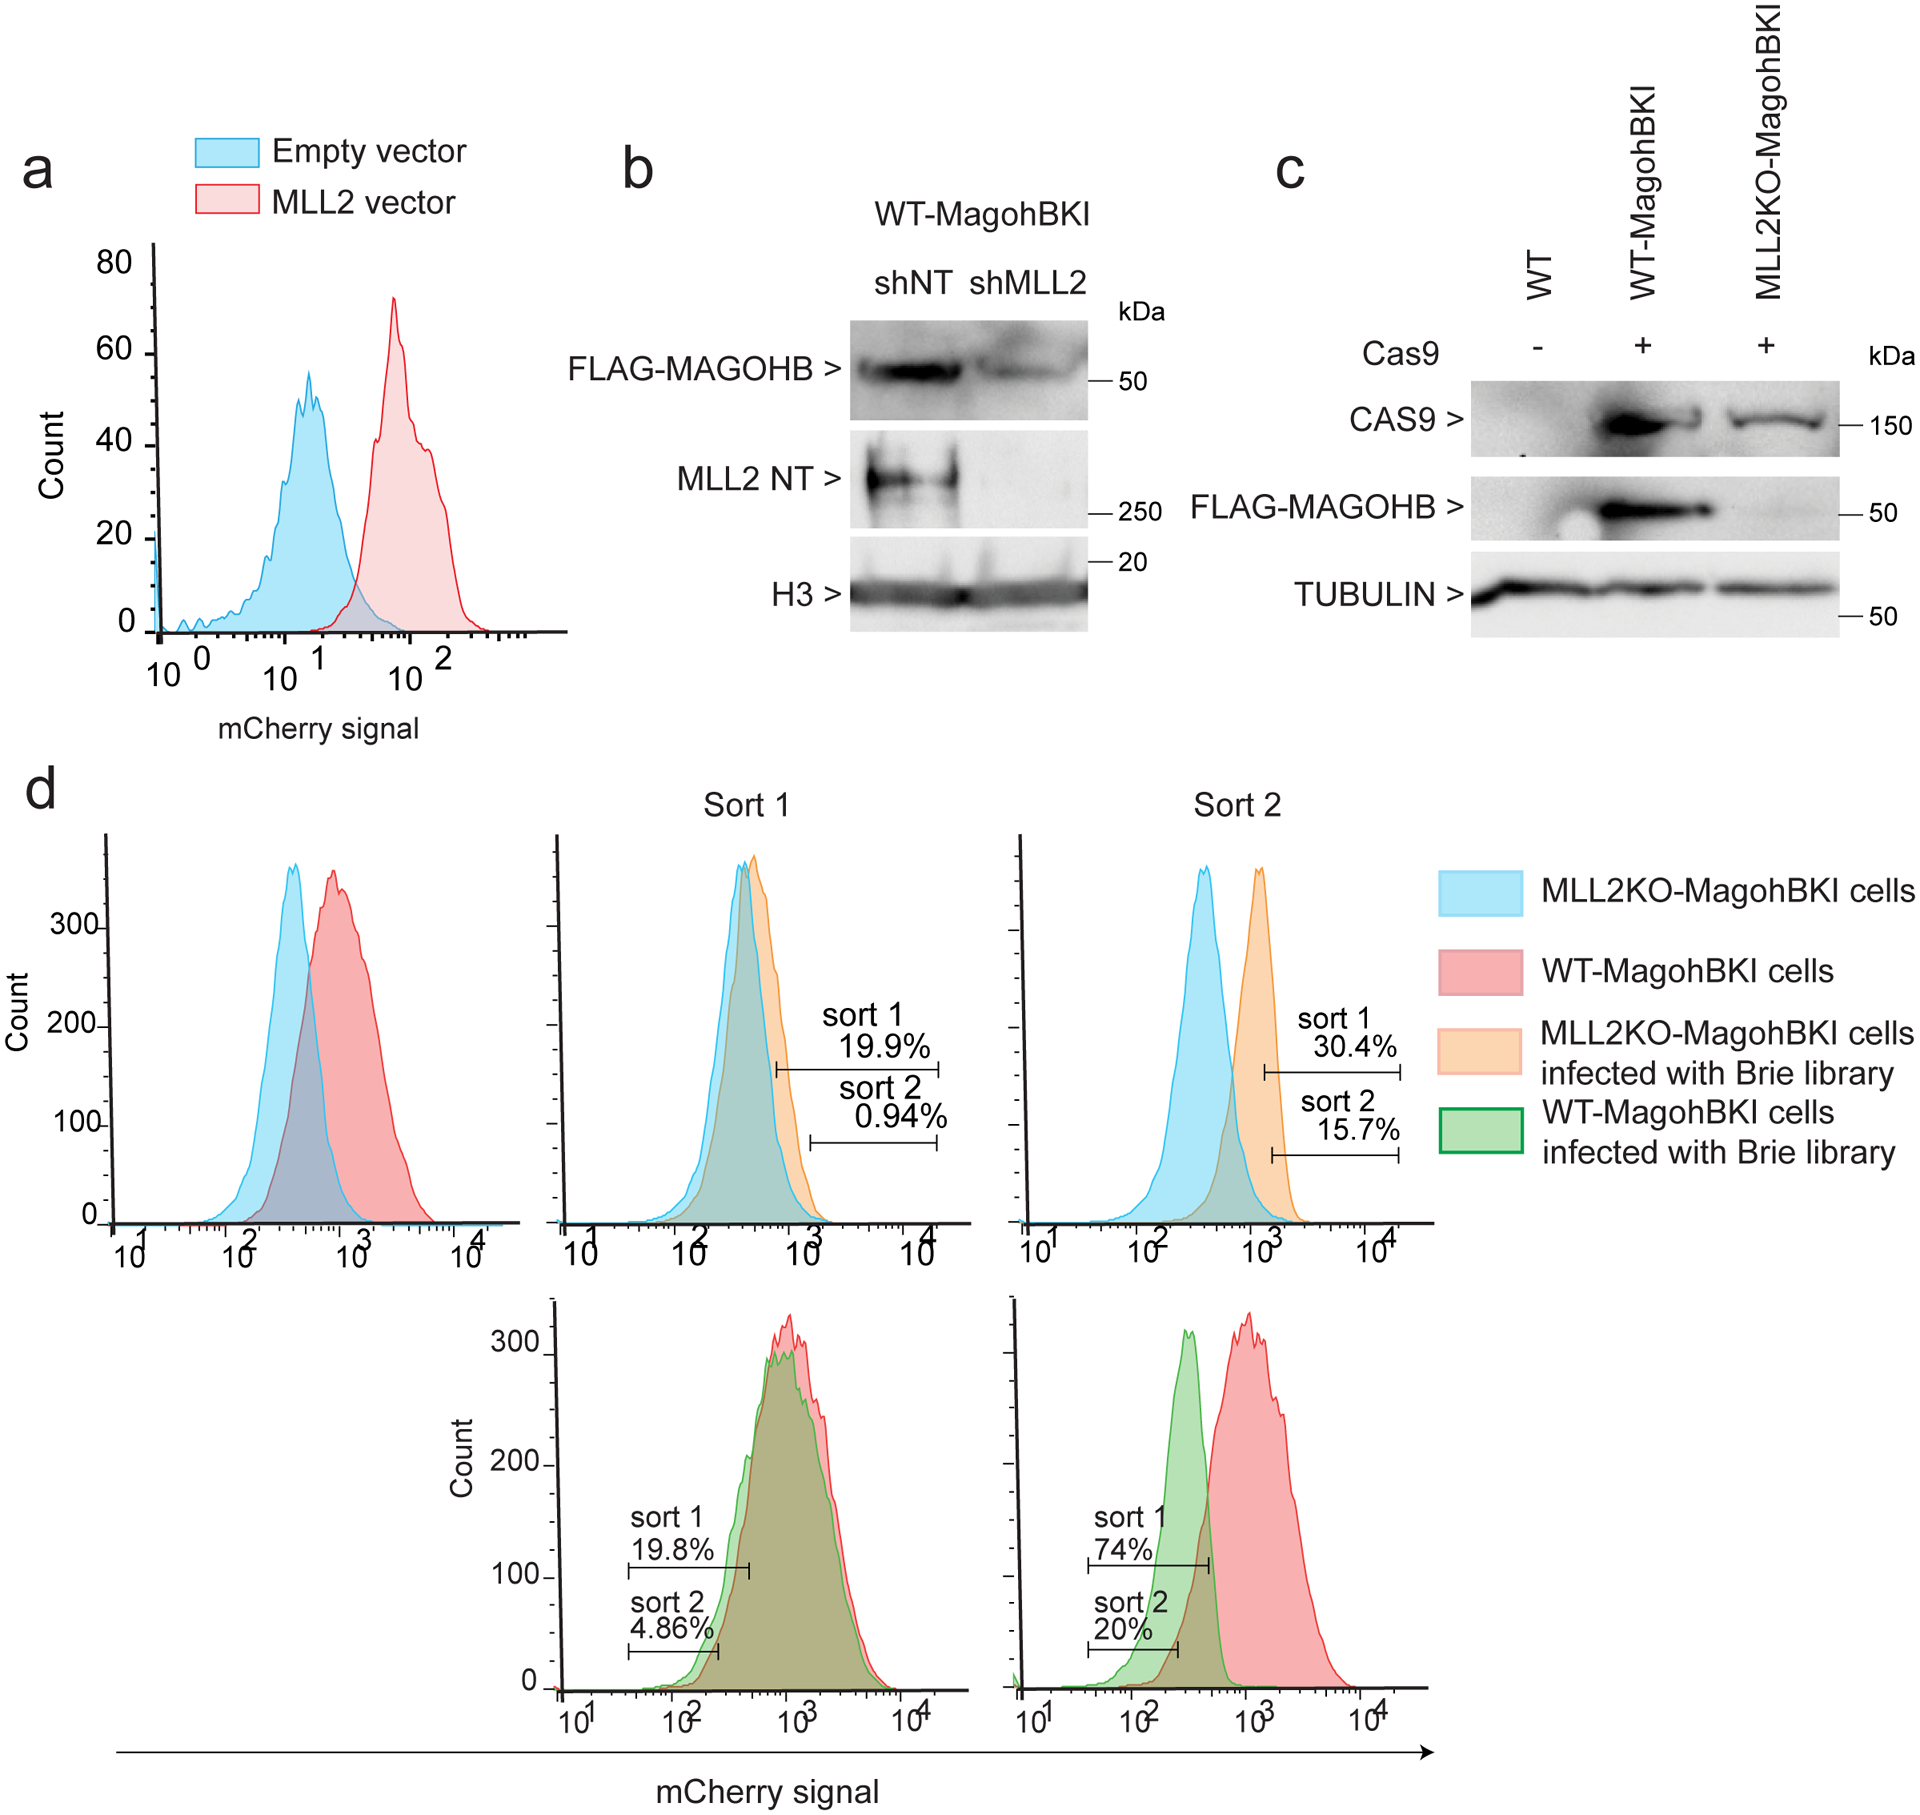
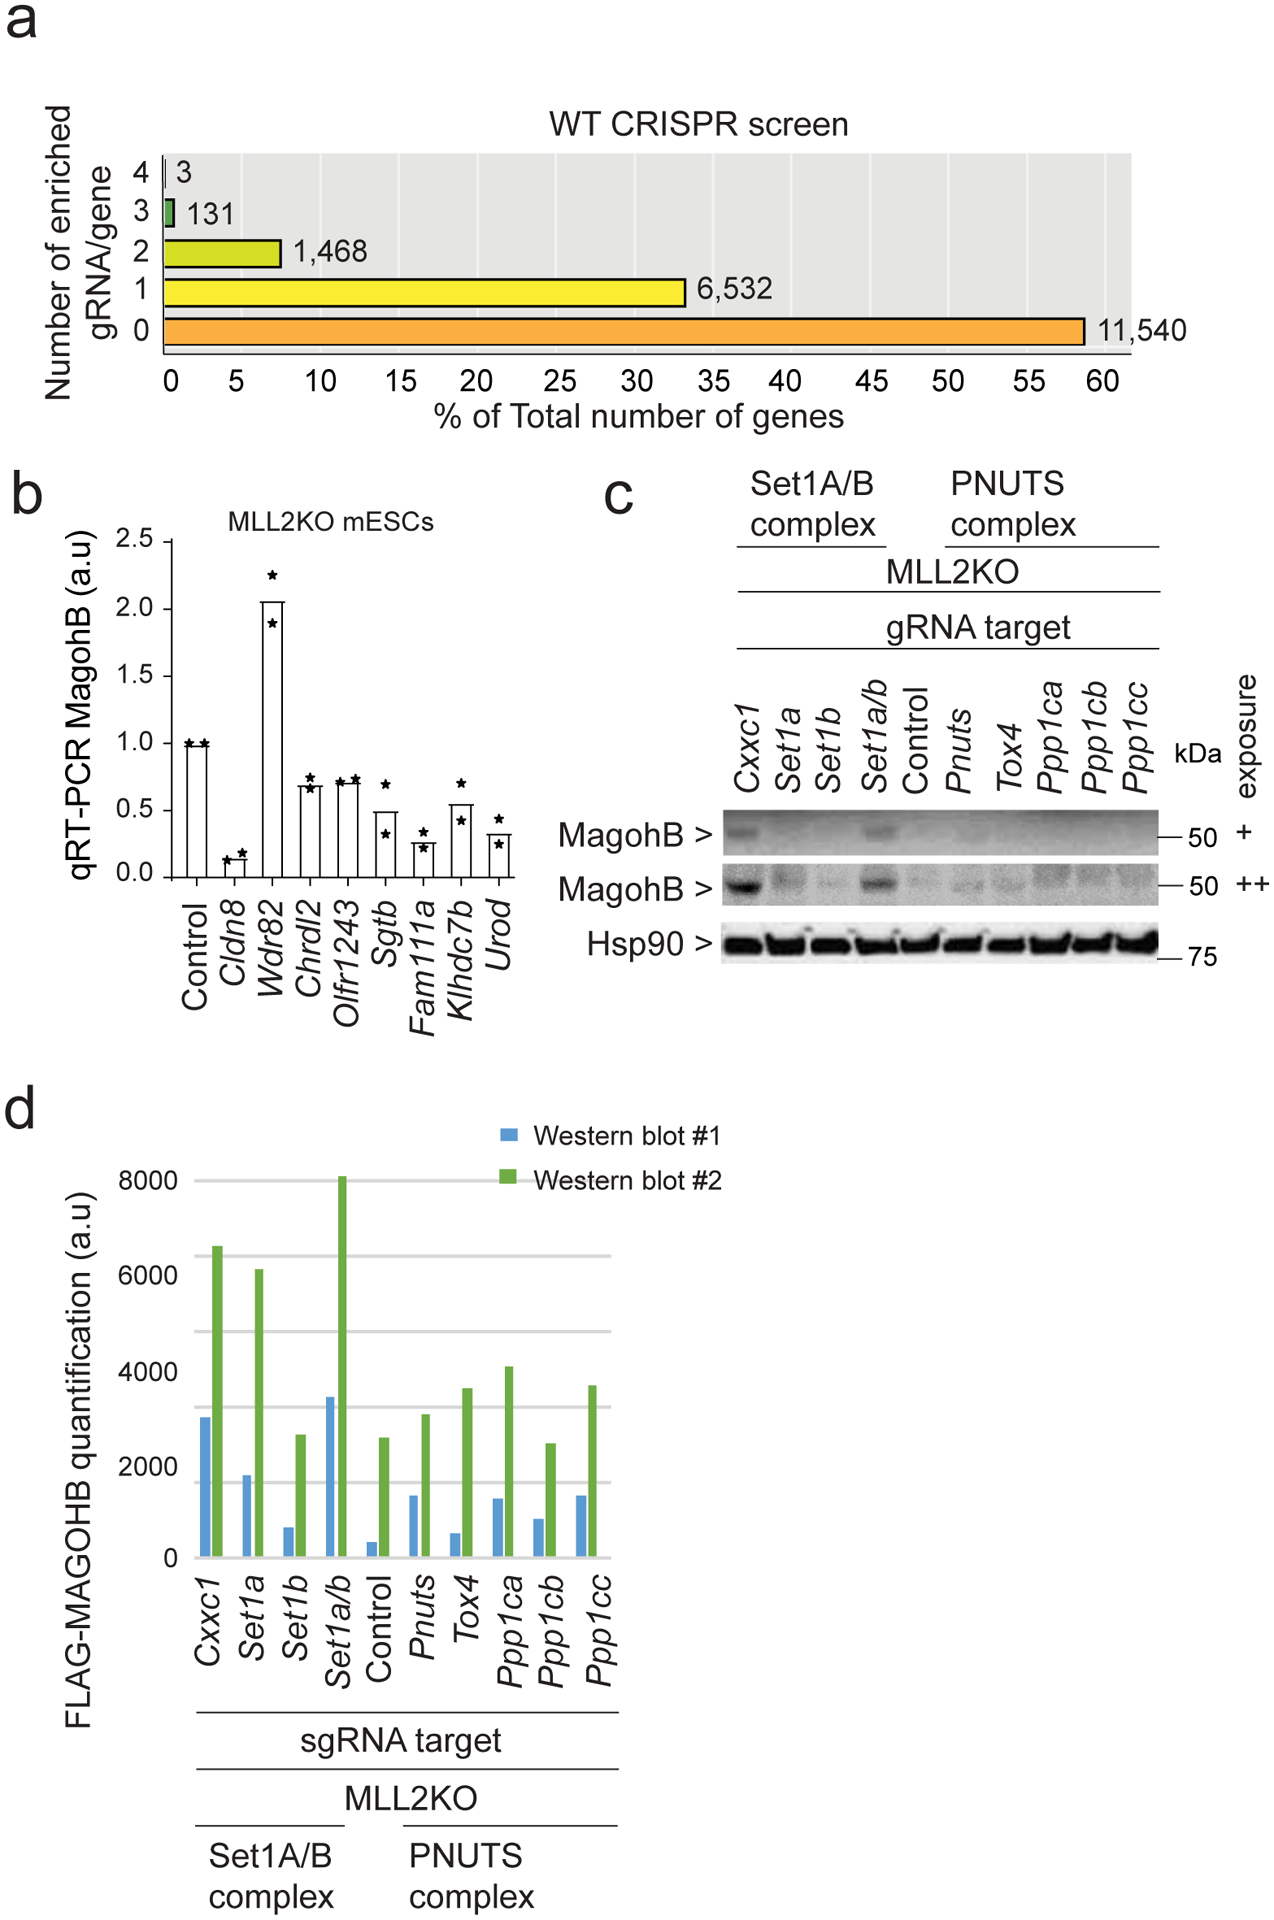
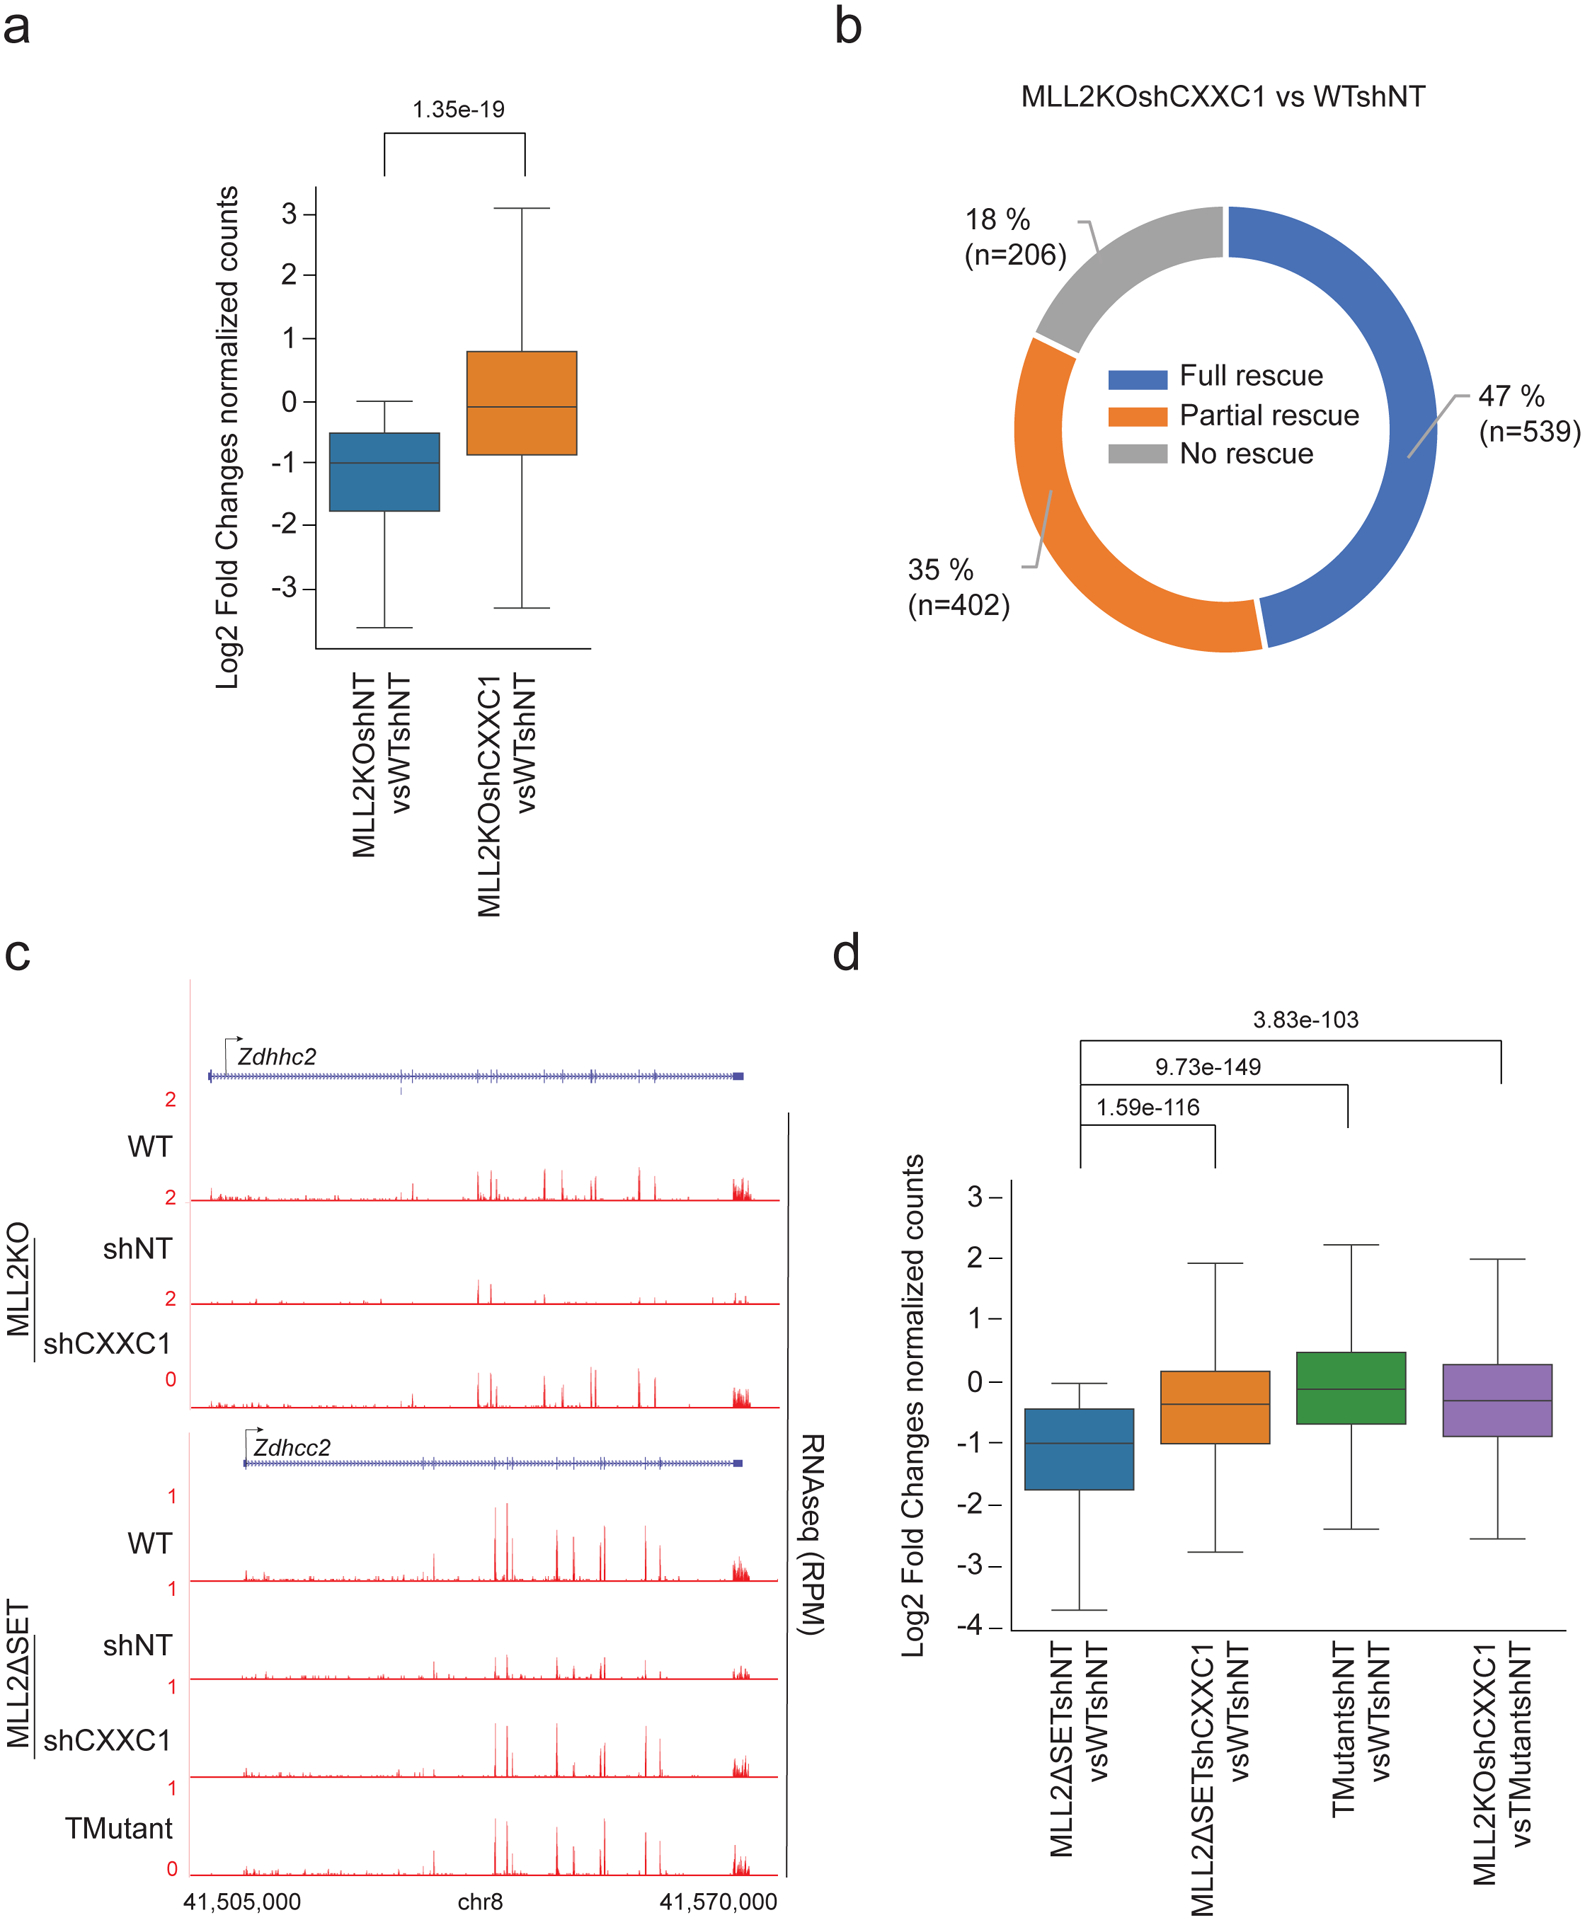
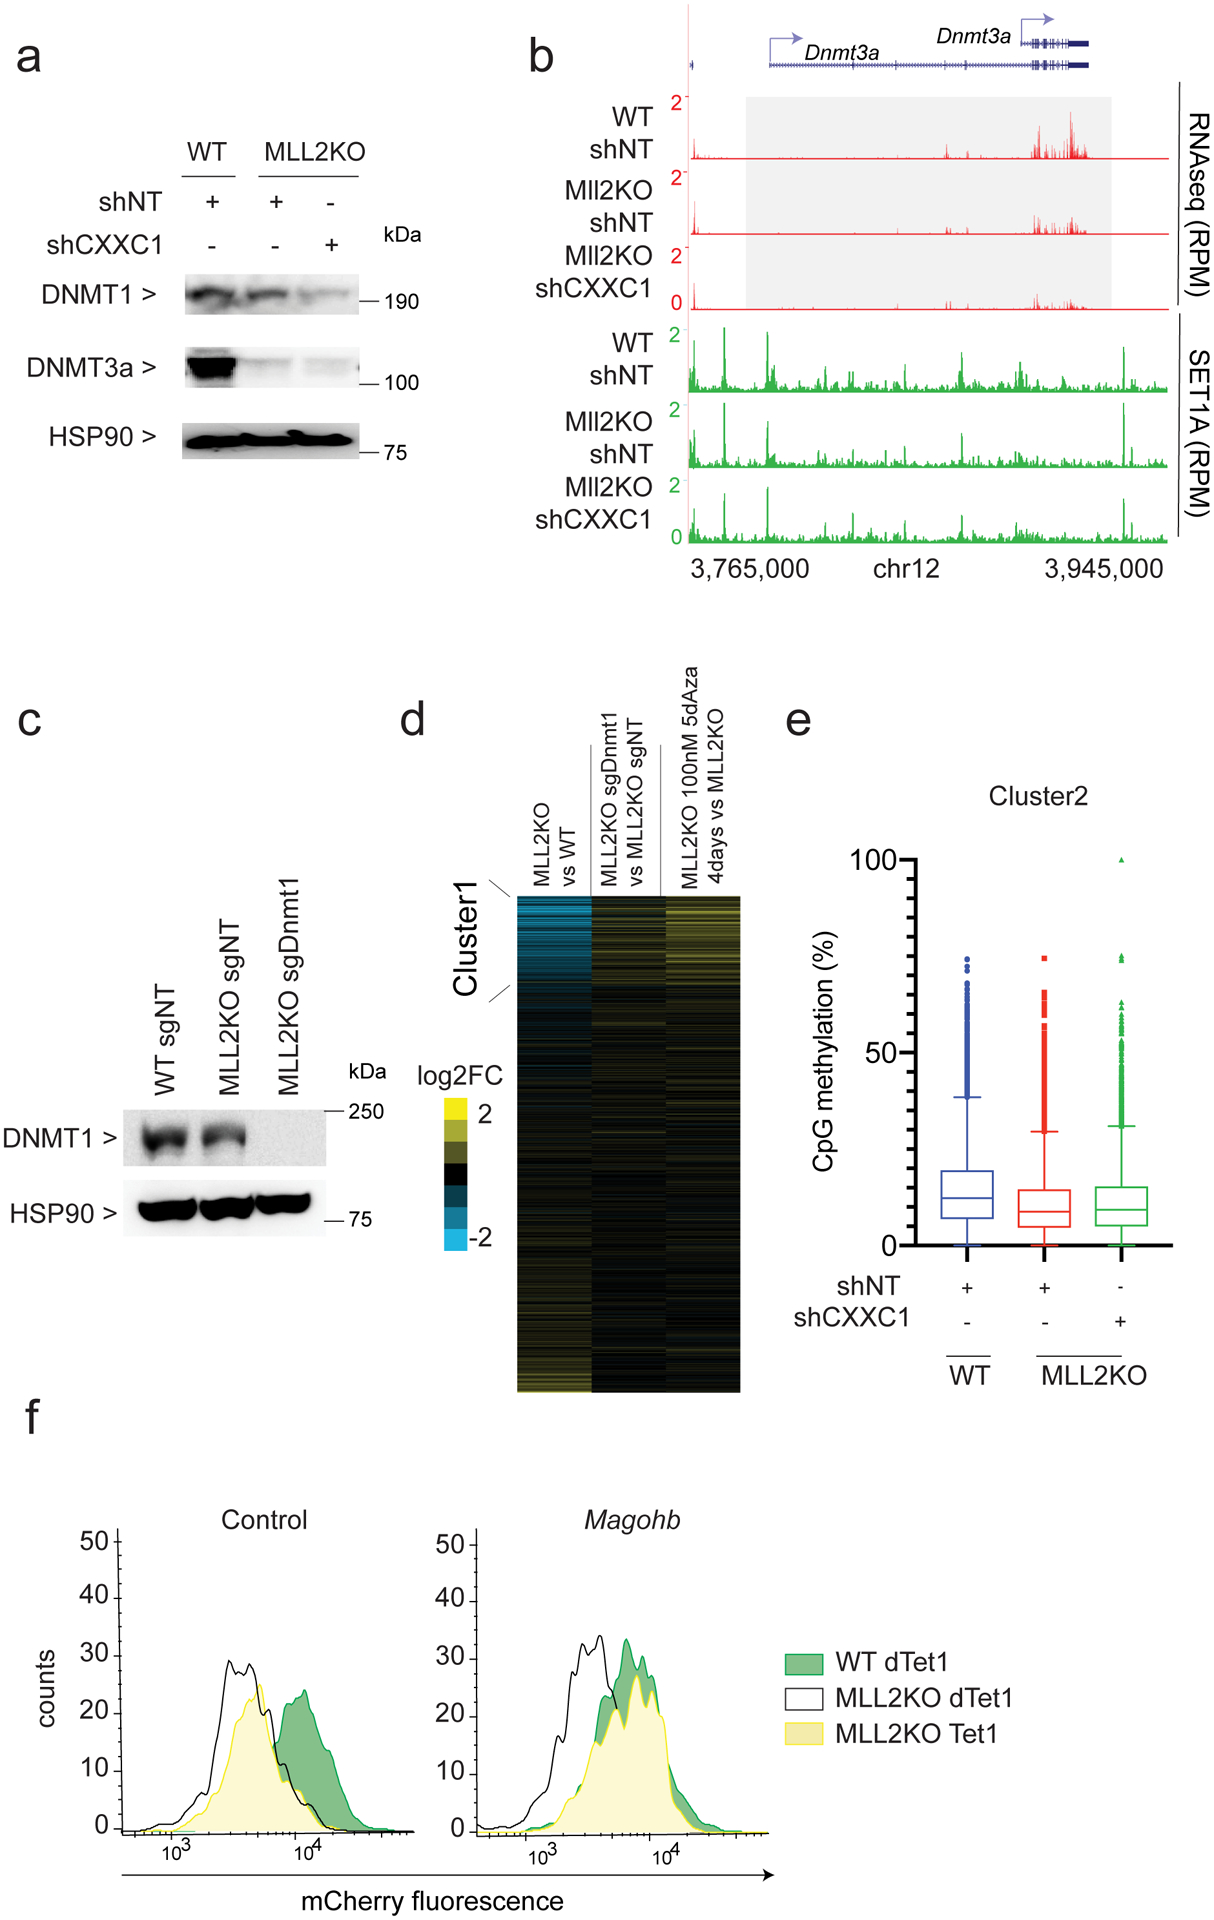
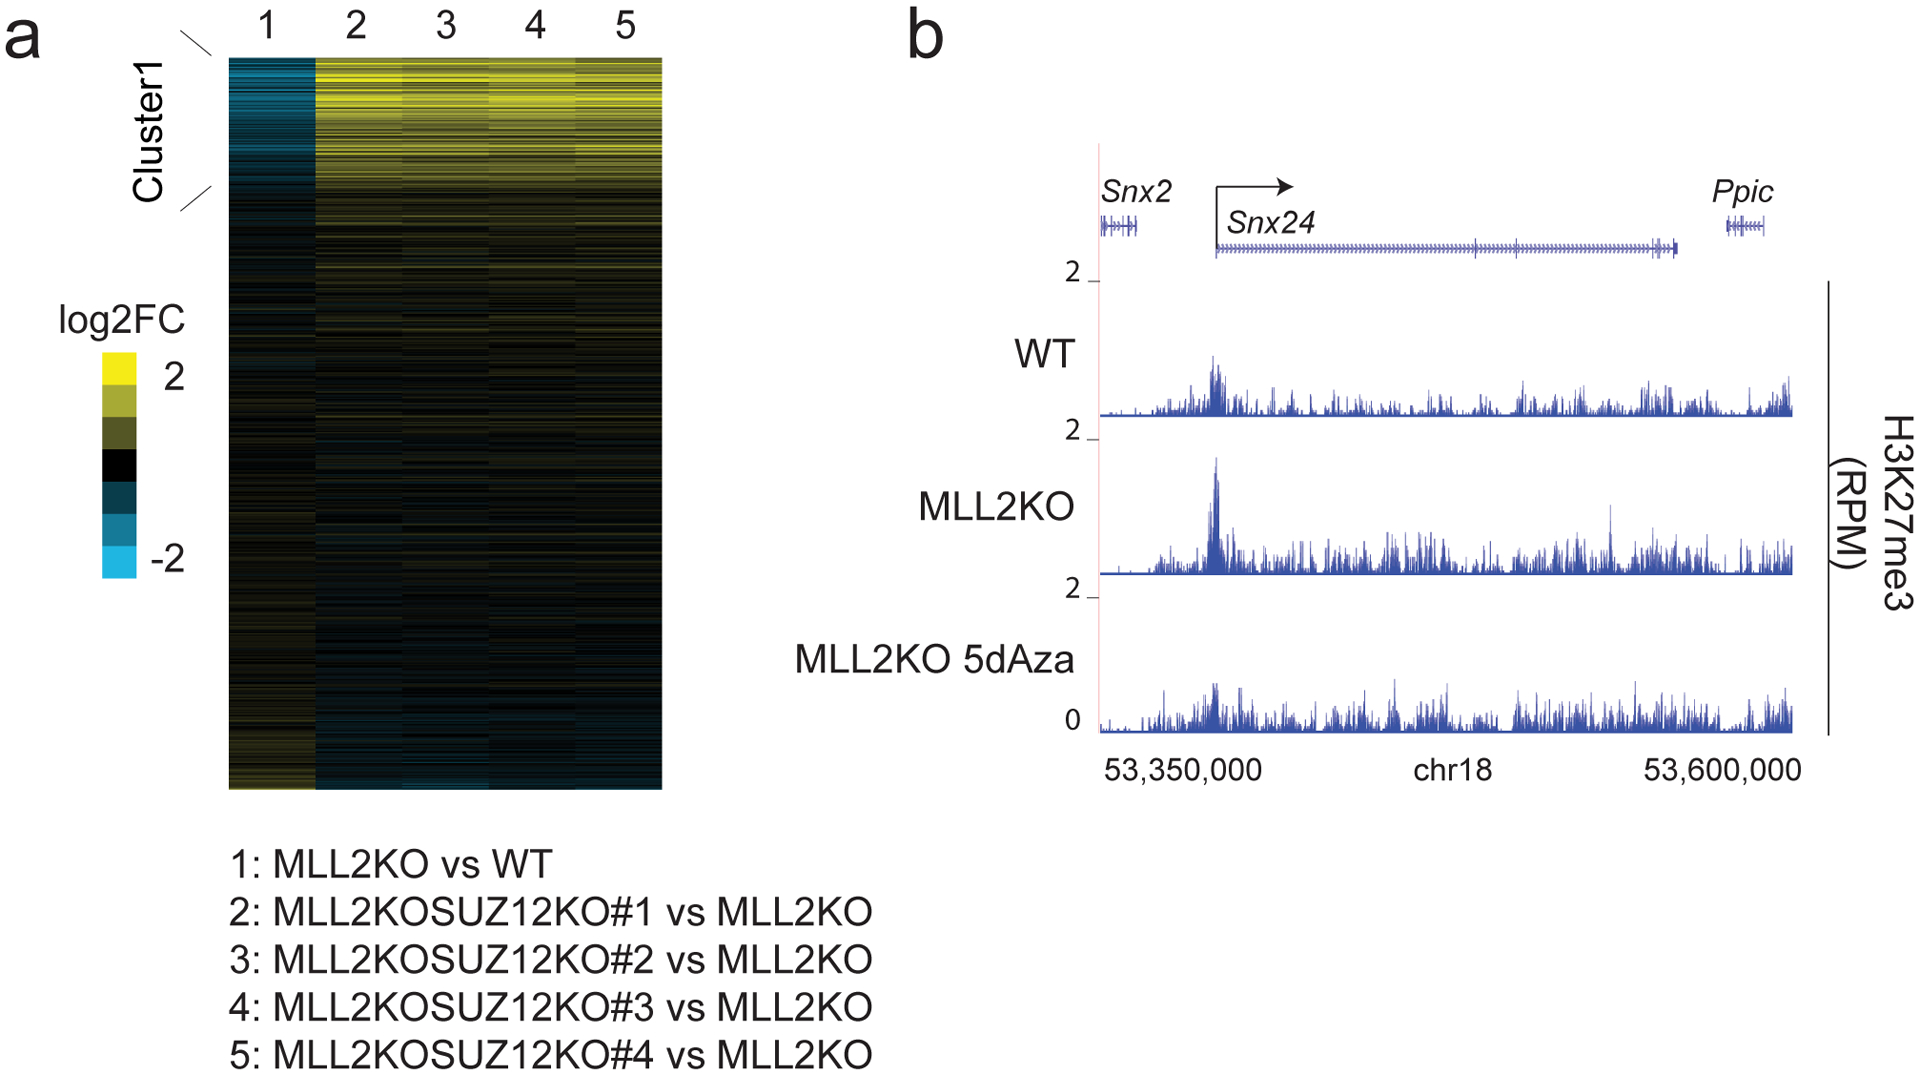
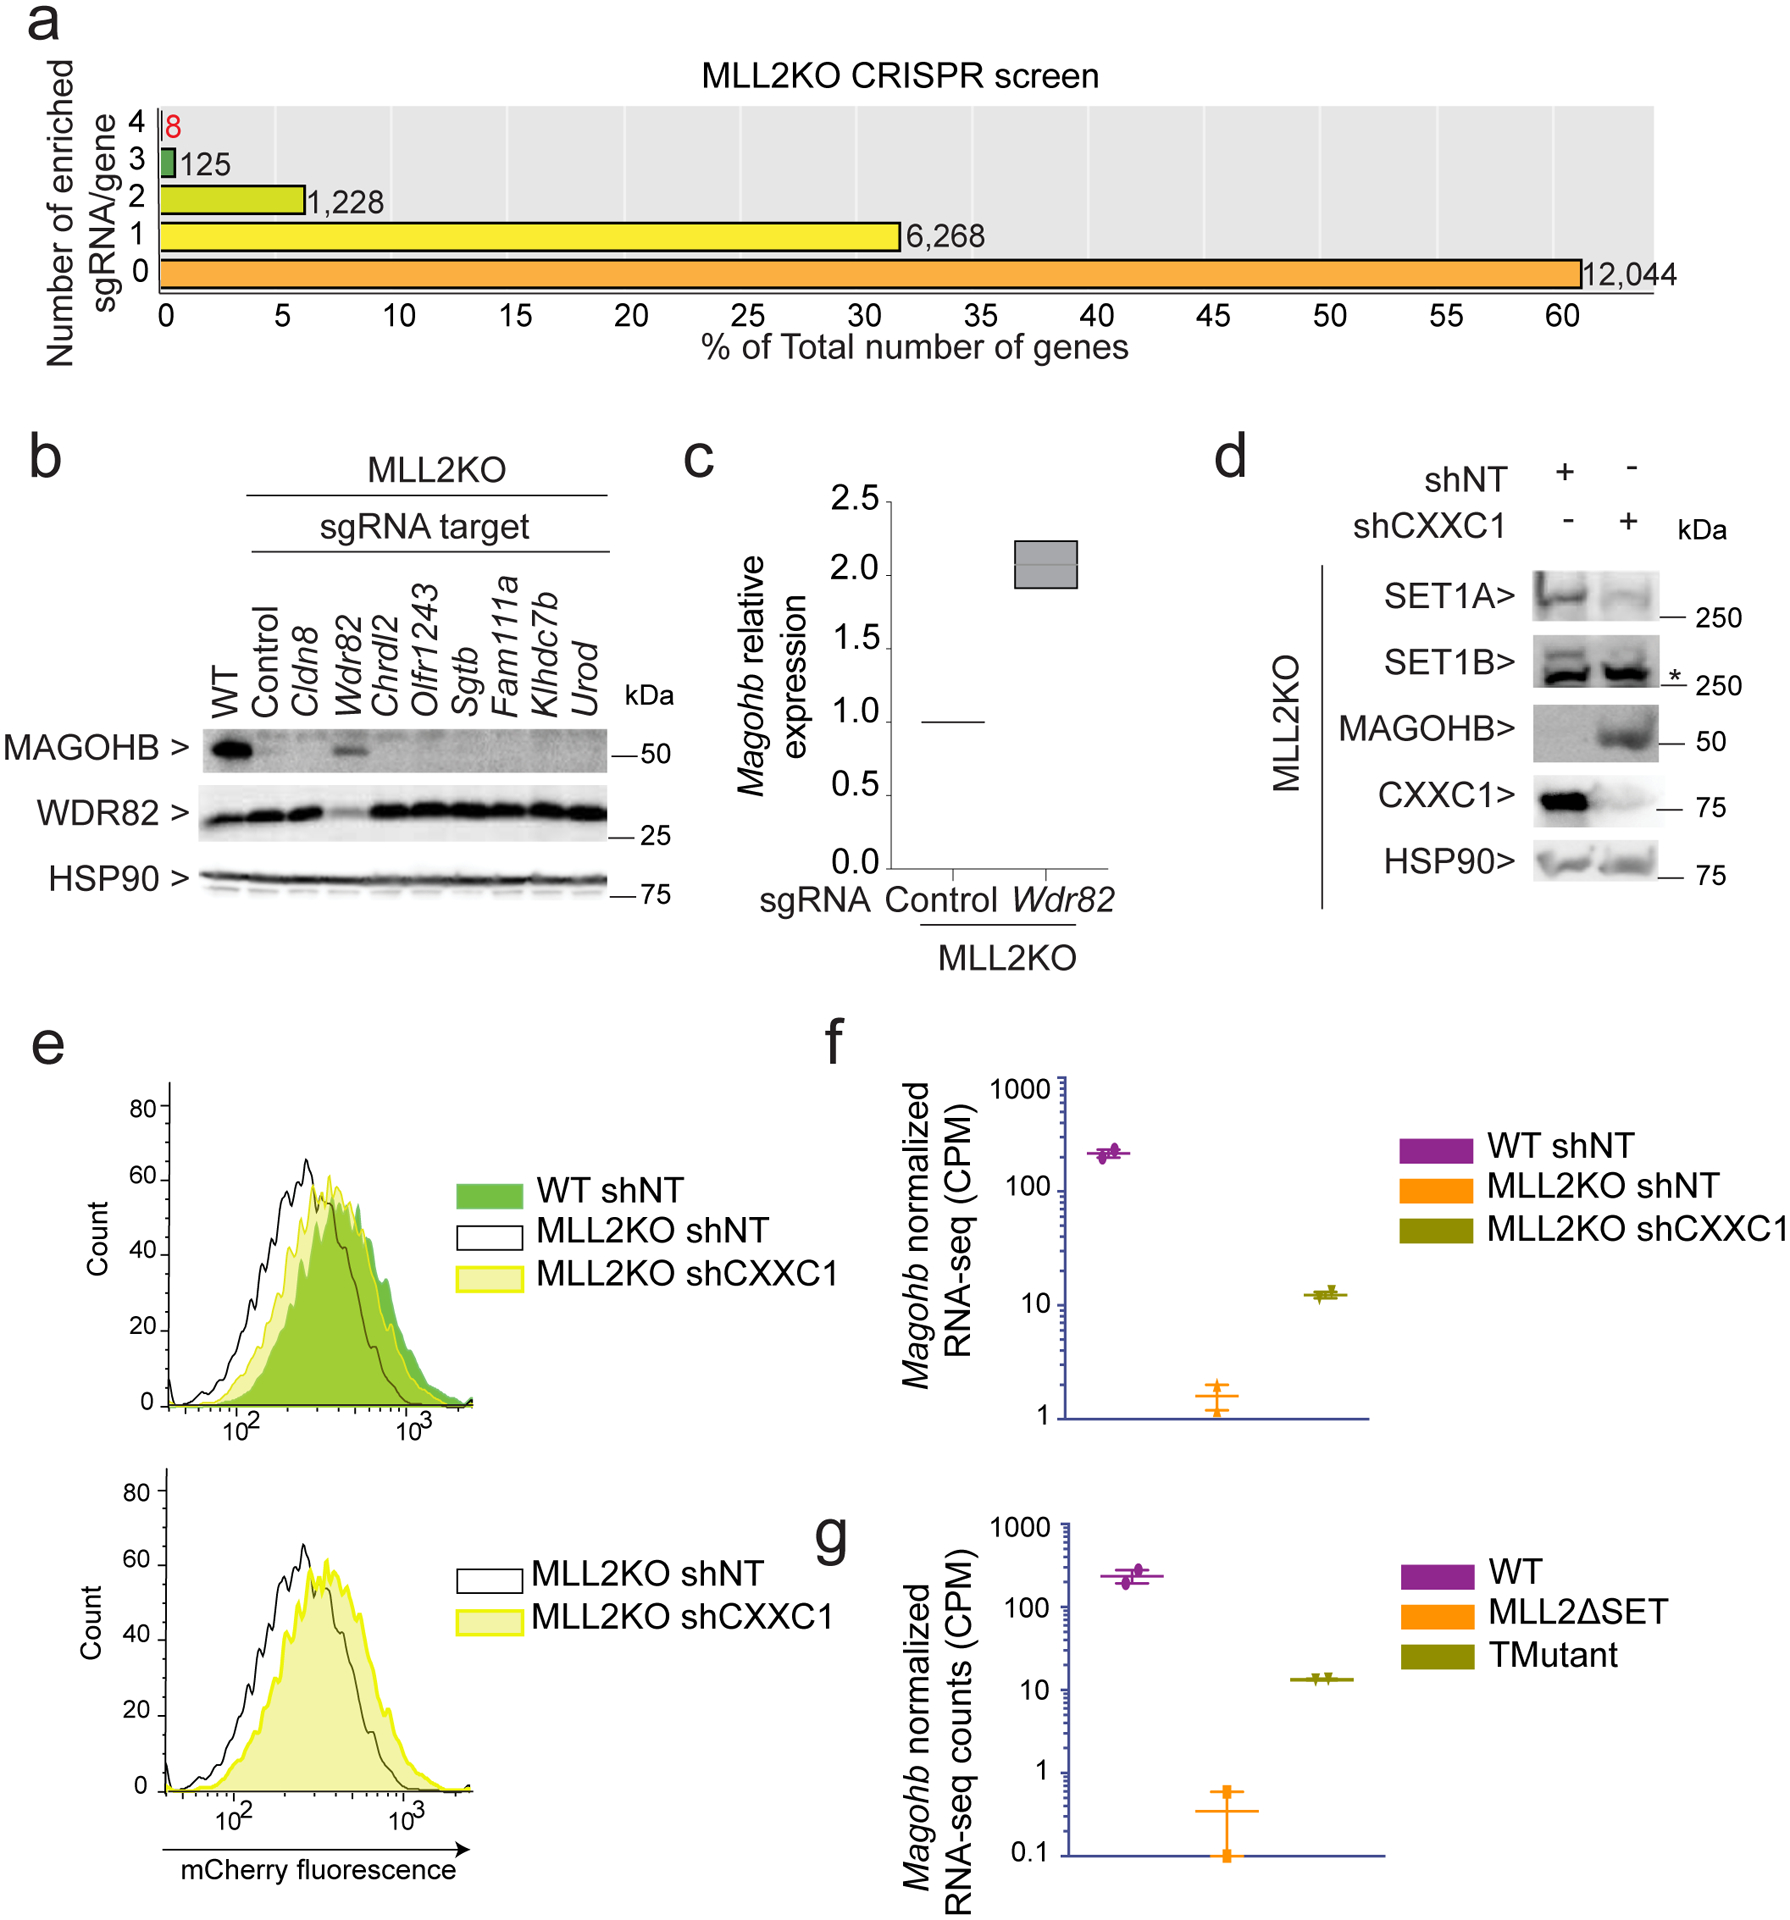
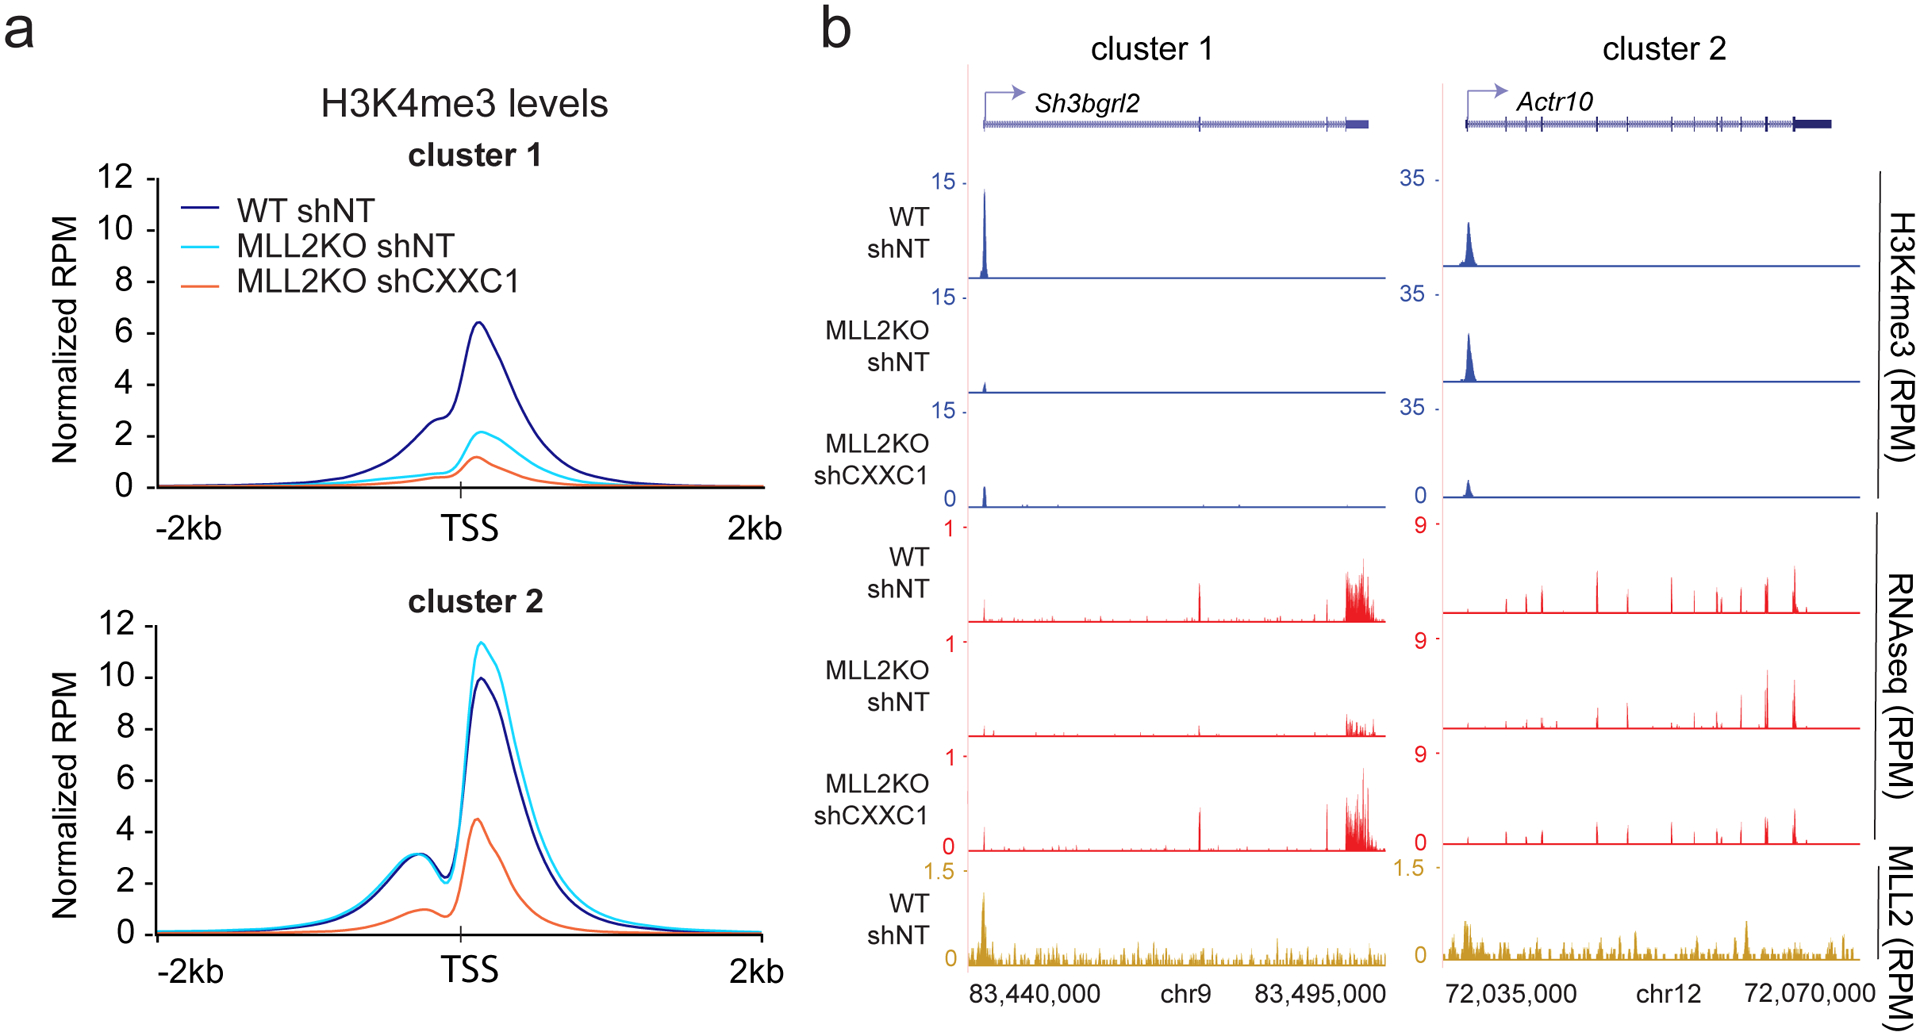
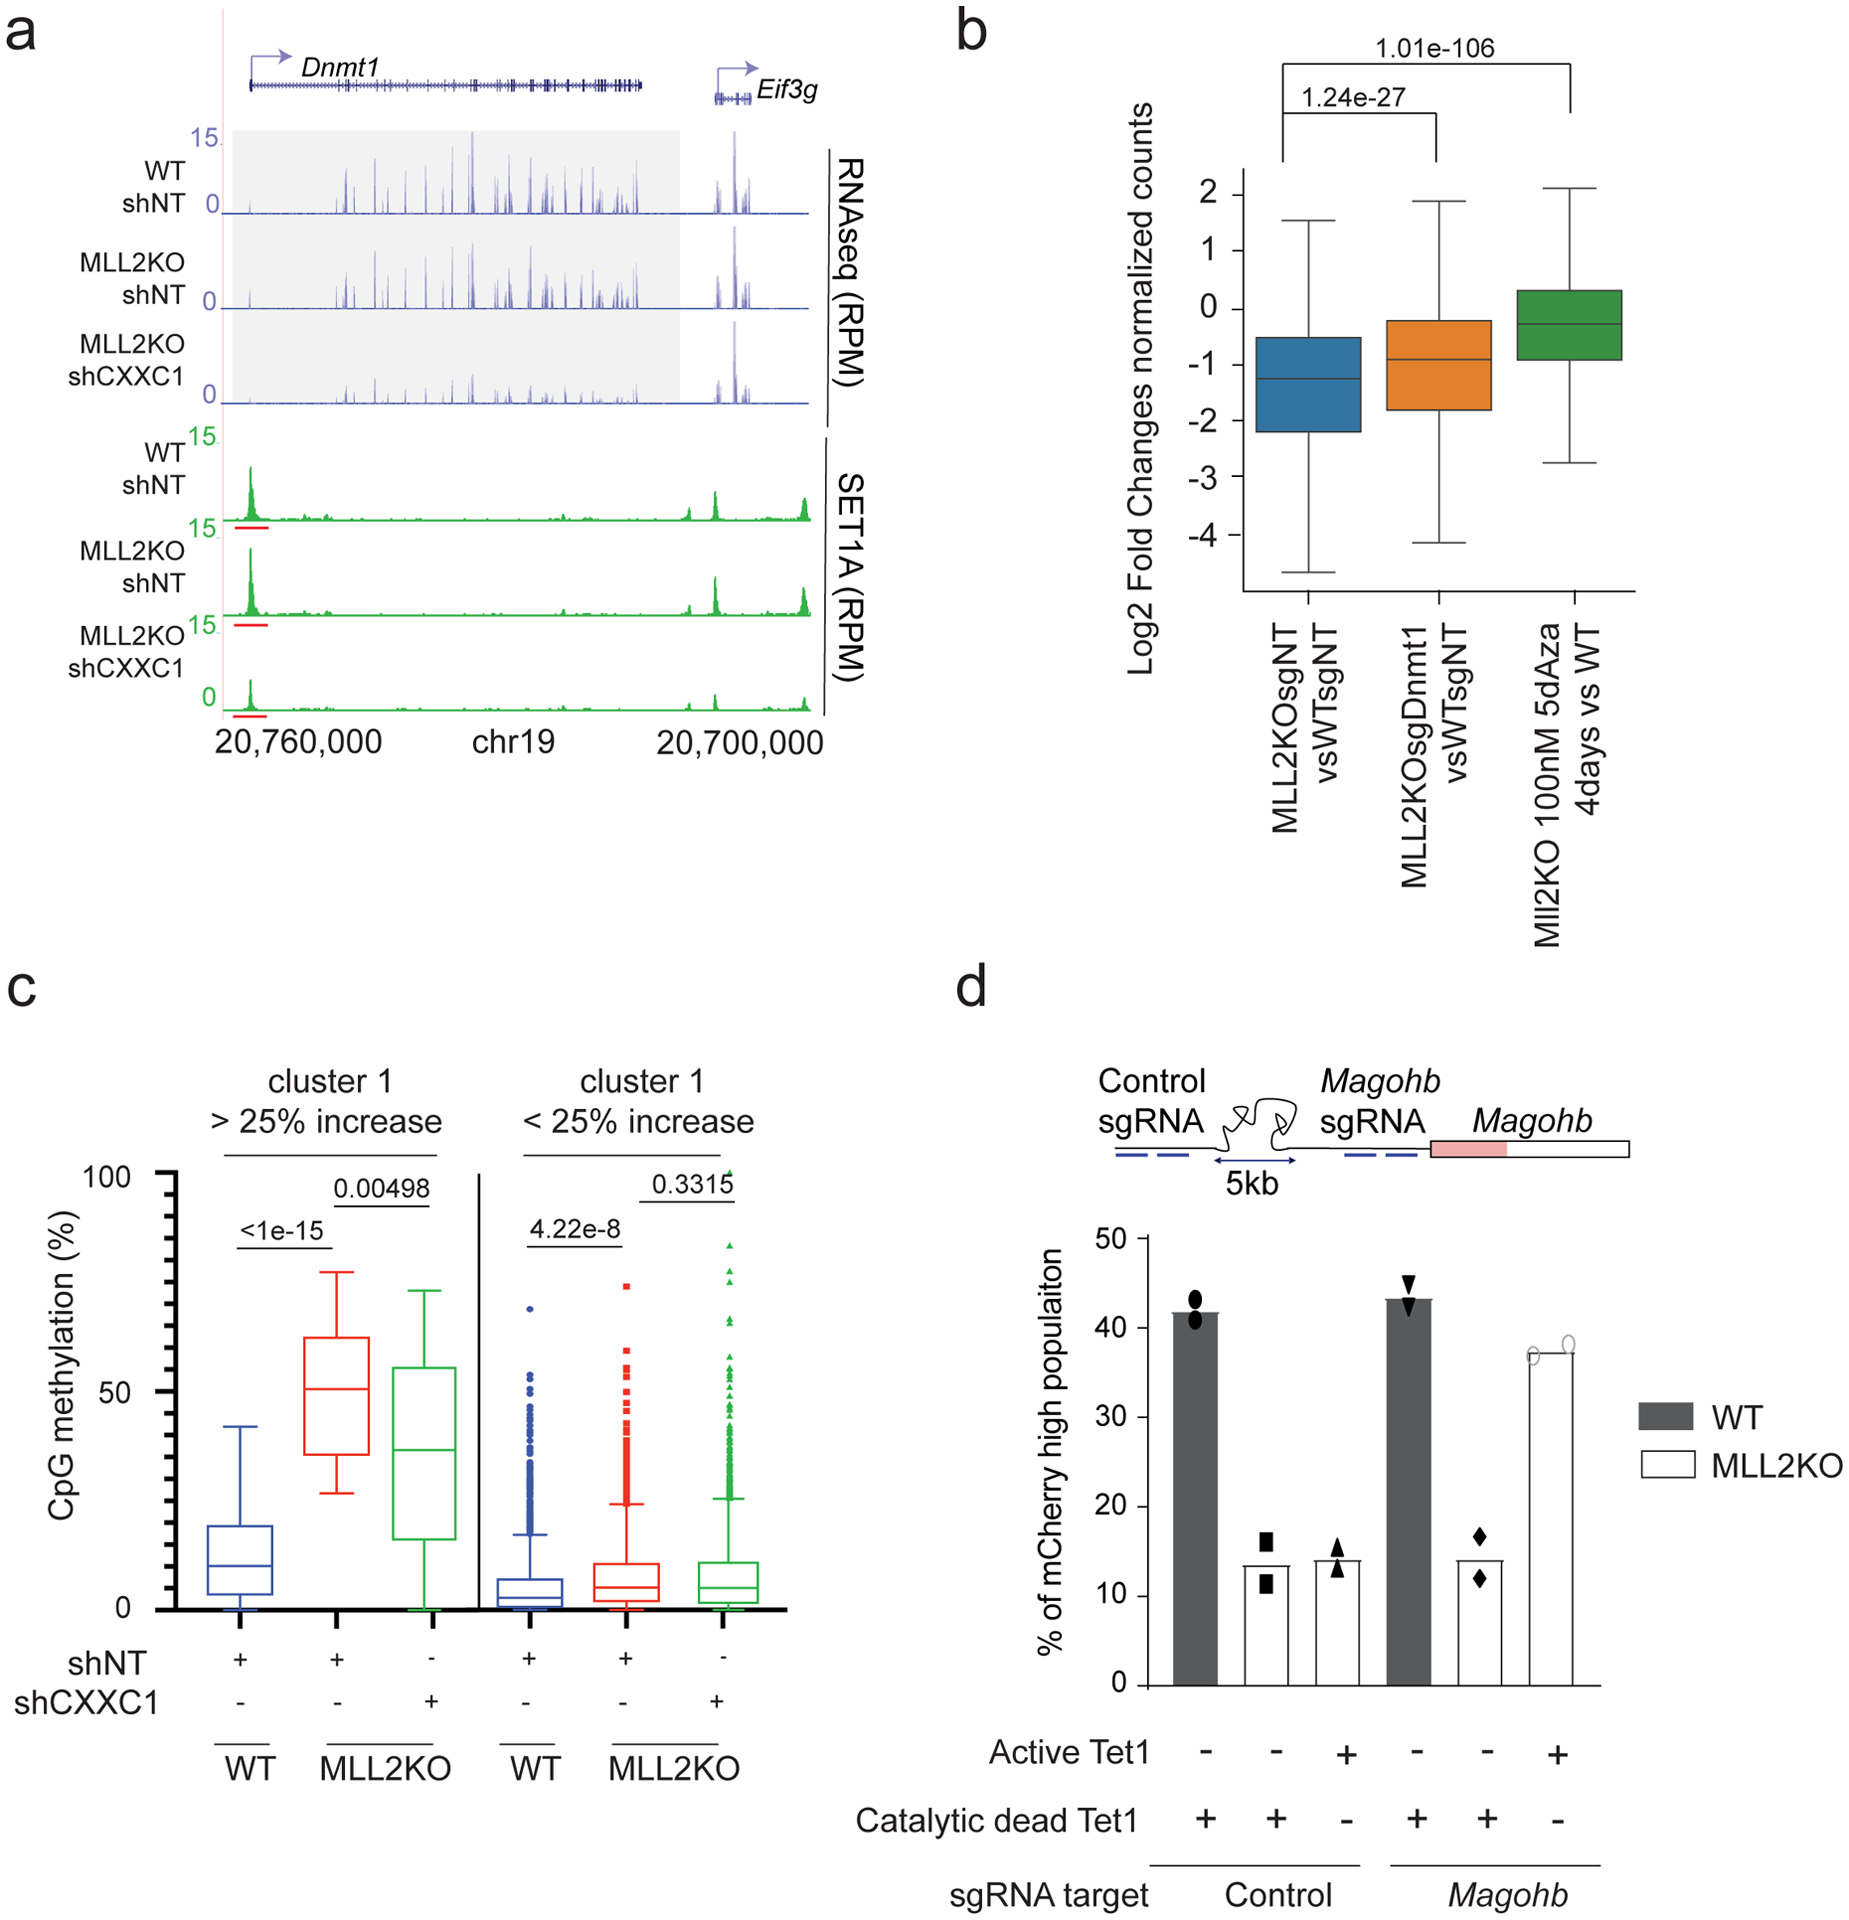
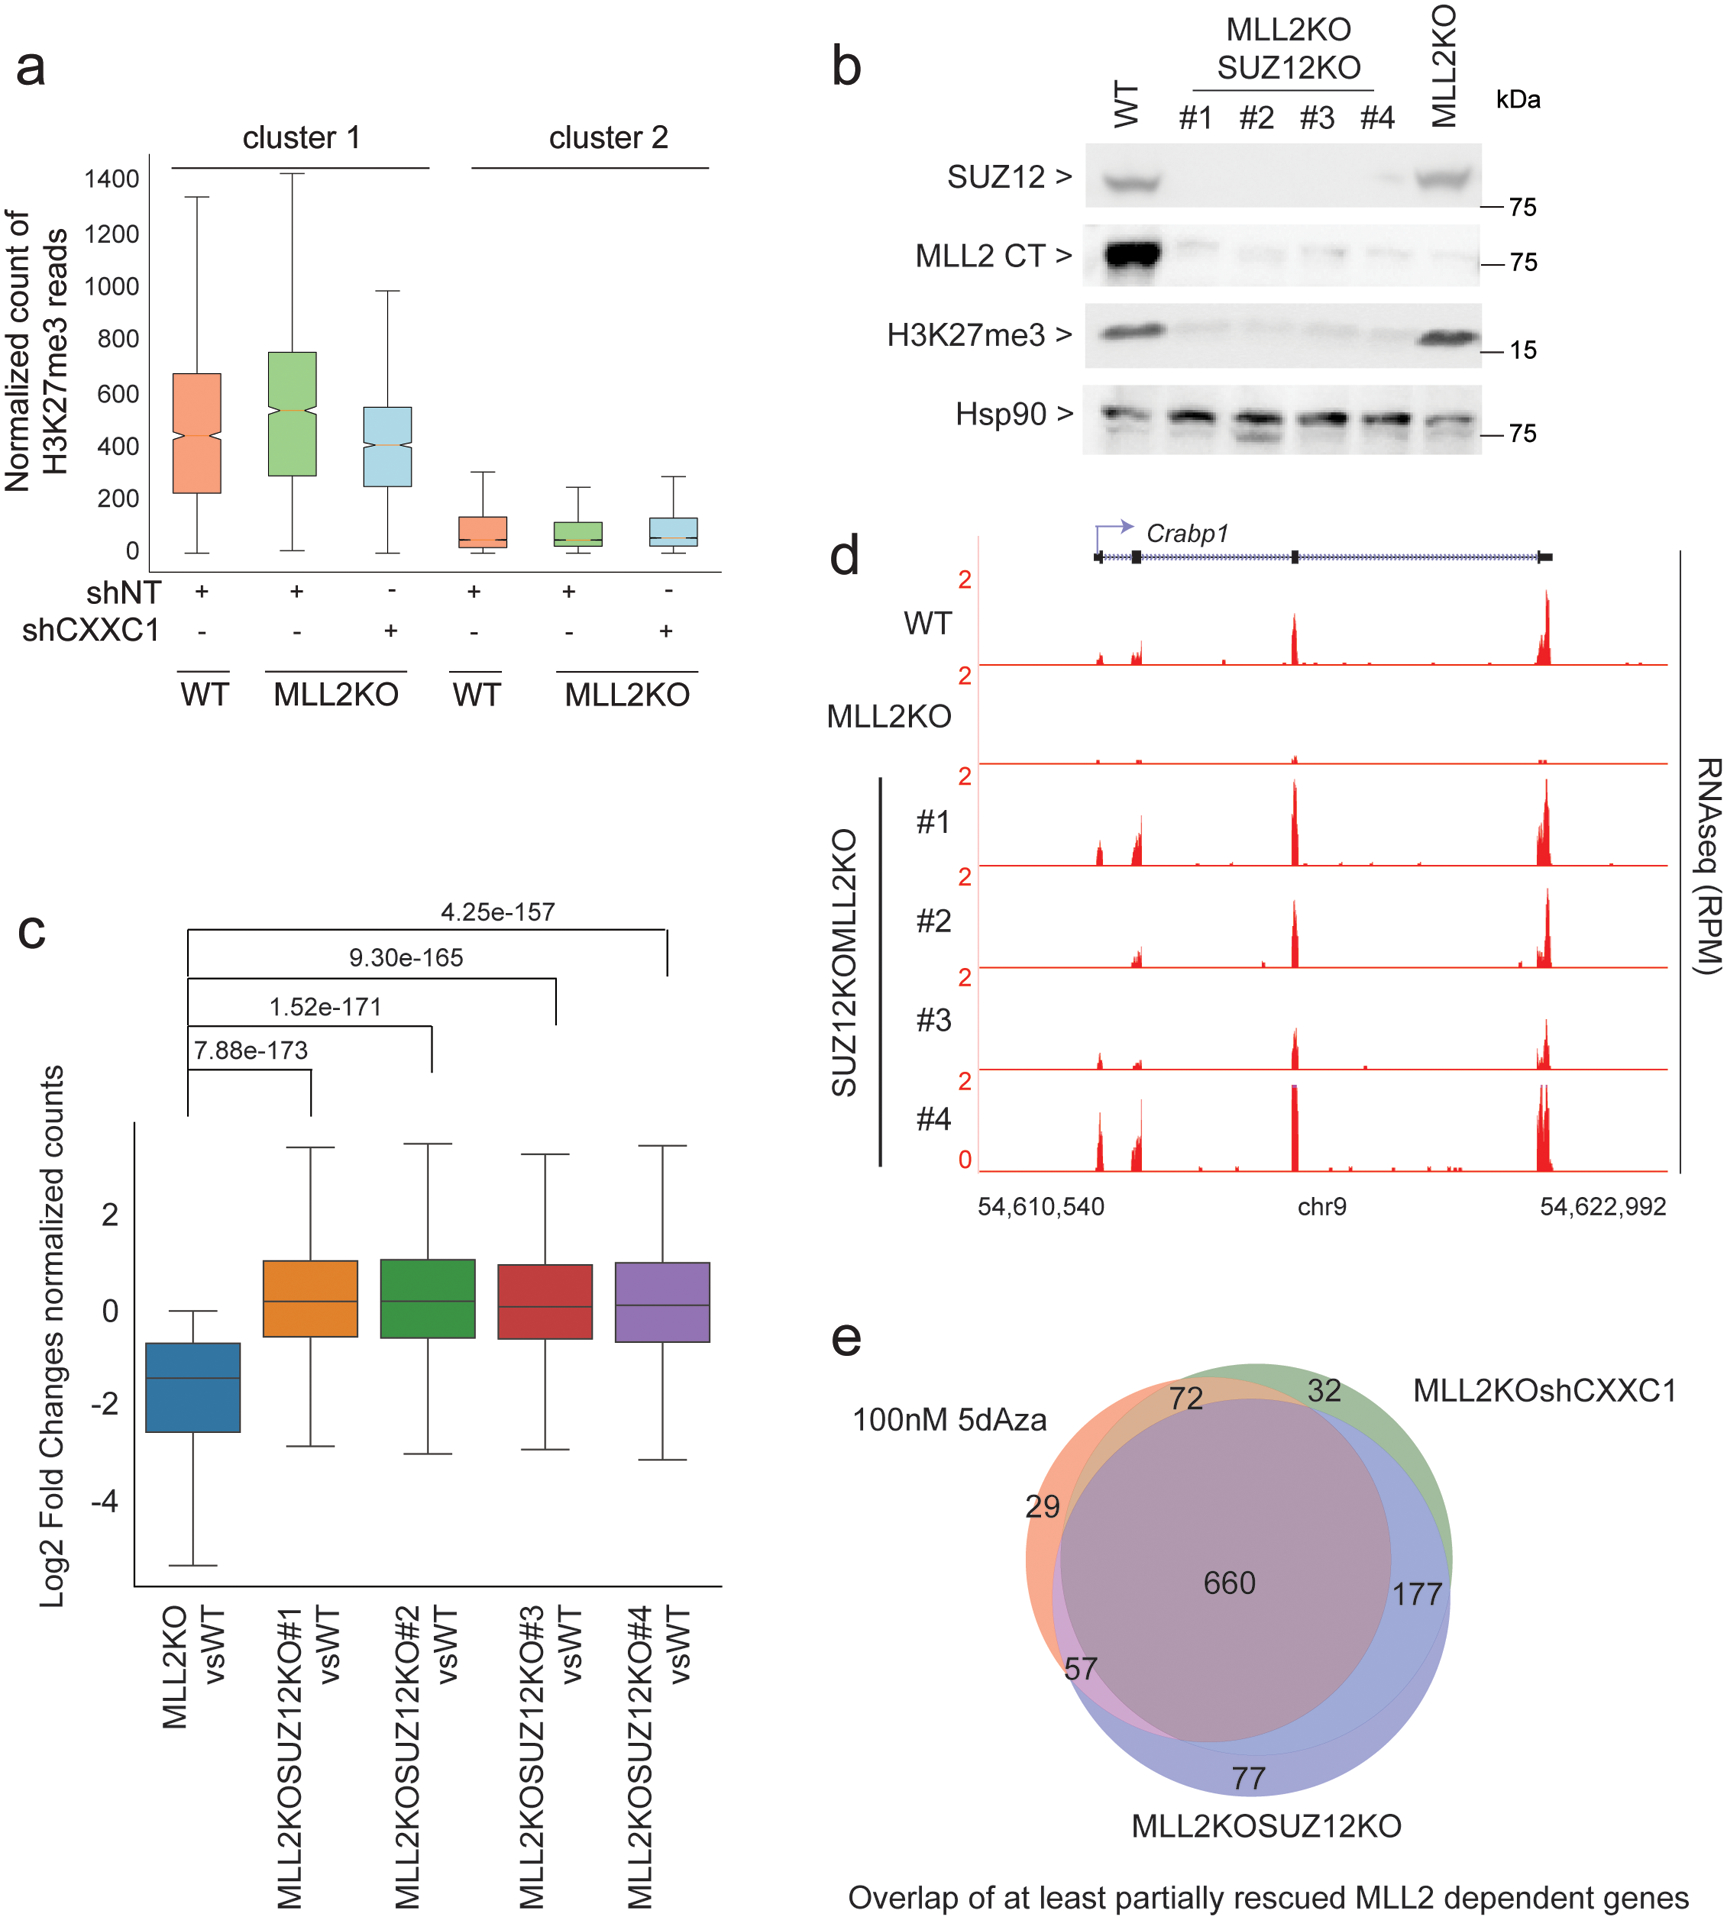
The COMPASS protein family catalyzes histone H3 Lys 4 (H3K4) methylation and its members are essential for regulating gene expression. MLL2/COMPASS methylates H3K4 on many developmental genes and bivalent clusters. To understand MLL2-dependent transcriptional regulation, we performed a CRISPR-based screen with an MLL2-dependent gene as a reporter in mouse embryonic stem cells. We found that MLL2 functions in gene expression by protecting developmental genes from repression via repelling PRC2 and DNA methylation machineries. Accordingly, repression in the absence of MLL2 is relieved by inhibition of PRC2 and DNA methyltransferases. Furthermore, DNA demethylation on such loci leads to reactivation of MLL2-dependent genes not only by removing DNA methylation but also by opening up previously CpG methylated regions for PRC2 recruitment, diluting PRC2 at Polycomb-repressed genes. These findings reveal how the context and function of these three epigenetic modifiers of chromatin can orchestrate transcriptional decisions and demonstrate that prevention of active repression by the context of the enzyme and not H3K4 trimethylation underlies transcriptional regulation on MLL2/COMPASS targets.


Conflict of interest statement

Competing interests

The authors declare no competing interests.

Figures

Extended Data Fig. 1
Extended Data Fig. 1. Quantification of RNAseq changes
(a-h) Interleaved scatter plot of indicated genes’ normalized RNA-seq counts in the indicated conditions for the genes Magohb (a), Zdhhc2 (b), Zdhhc2(c), Sh3bgrl2 (d), Actr10 (e), Dnmt1 (f), Dnmt3a (g) and Crabp1 (h) (n=2).
Extended Data Fig. 2
Extended Data Fig. 2. CRISPR-Cas9 screen using MAGOHB knock in in mESCs
(a) FACS analysis of mCherry-Magohb MLL2KO mESCs transformed with an empty vector or a MLL2 expressing vector. The experiment was repeated three times independently with similar results. (b) Western blot for FLAG-MAGOHB expression in WT cells expressing a shRNA control (shNT) or a shRNA targeting MLL2 (shMLL2). The experiment was repeated two times independently with similar results. (c) Western blot for CAS9, FLAG-MAGOHB and TUBULIN (loading control) protein levels in WT, Magohb KI WT cells (WT-MagohbKI) and Magohb KI MLL2KO cells (MLL2KO-MagohbKI). The experiment was repeated two times independently with similar results. (d) Top panel: mCherry high cells were isolated via two successive rounds of FACS in MLL2KO mESCs. Bottom panel: mCherry low cells were isolated via two successive rounds of FACS in WT mESCs. The experiment was repeated three times independently with similar results. Uncropped gels are available as source data.
Extended Data Fig. 3
Extended Data Fig. 3. CRISPR screen validation
(a) CRISPR screen results representing the number of enriched sgRNA in the ‘Sorted Population’ compared to the ‘Total population’ per gene for WT screen. The majority of the genes fall into the category ‘0 sgRNA enriched out of 4’. (b) Expression levels of Magohb as assessed by real-time PCR in MLL2KO mESCs expressing a control sgRNA (Control) or sgRNAs targeting various genes (n = 2). (c) Western blot of MAGOHB and HSP90 (loading control) protein levels. Two different exposures are shown. The experiment was repeated two times independently with similar results. (d) Quantification of two independent replicates of Extended Data Figure 2c western blots. Uncropped gels are available as source data.
Extended Data Fig. 4
Extended Data Fig. 4. Cluster-1 gene expression rescue by CXXC1 knockdown
(a) Boxplot analysis of cluster1 gene expression in 1) MLL2KOshNT vs. WTshNT mESCs and 2) MLL2KOshCXXC1 vs. WTshNT mESCs. P values were computed using Wilcoxon test (two-sided), n=941. The boxplots indicate the median (middle line), the third and first quartiles (box) and the first and fourth quartiles (error bars). (b) Donut chart of cluster 1 distribution of genes based on their level of rescue in MLL2KO shCXXC1 cells compared to WT cells. ‘Full rescue’ genes were characterized by a log2FC ≥ 0 comparing MLL2KOshCXXC1 to WT mESCs, ‘Partial rescue’ genes were characterized by a log2FC > 0 comparing MLL2KOshCXXC1 and MLL2KO mESCs and ‘No rescue’ were characterized by a log2FC ≤ 0 comparing MLL2KOshCXXC1 and MLL2KO mESCs. (c) RNA-seq tracks for Zdhhc2 in WT, MLL2KOshNT, MLL2KOshCXXC1, MLL2ΔSETshNT, MLL2ΔSETshCXXC1 and TMutant. The experiment was repeated two times independently with similar results. (d) Boxplot analysis of cluster1 gene expression in 1) MLL2ΔSETshNT vs. WTshNT mESCs and 2) MLL2ΔSETshCXXC1 vs. WTshNT mESCs, 3) TMutantshNT vs. WTshNT mESCs, 4) TMutantshCXXC1 vs. WTshNT mESCs and 5) MLL2KOshCXXC1 vsTMutantshNT mESCs (n=2).
Extended Data Fig. 5
Extended Data Fig. 5. DNA methylation and MLL2 dependent transcription
(a) Western blot of DNMT1, DNMT3A and HSP90 (loading control) protein levels in WTshNT, MLL2KOshNT and MLL2KOshCXXC1 mESCs. The experiment was repeated two times independently with similar results. (b) RNA-seq and SET1A ChIP-seq tracks for Dnmt3a. The experiment was repeated two times independently with similar results. (c) Western blot of DNMT1 and HSP90 (loading control) protein levels in WTsgNT, MLL2KOsgNT and MLL2KOsgDnmt1. The experiment was repeated two times independently with similar results. (d) Heatmaps show the corresponding log2 fold changes in gene expression in 1) MLL2KO vs. WT mESCs, 2) MLL2KO sgDnmt1 vs. MLL2KOsgNT mESCs and 3) MLL2KO treated for 4 days with 100 nM 5dAza vs. MLL2KO mESCs. (e) Box-and-Whisker plot quantifying changes in CpG methylation around TSS (±3kb) of cluster2 clusters identified in Figure 3A (N=3 biological replicates, n=13420). The boxplots indicate the median (middle line), the third and first quartiles (box) and the first and fourth quartiles (error bars). (f) Flow cytometry on mCherry-Magohb KI WT or MLL2KO mESCs expressing a dead Tet1 catalytic domain (dTet1) or an active Tet1 catalytic domain (Tet1) targeted to a control region 5kb upstream Magohb or Magohb promoter. The experiment was repeated two times independently with similar results. Uncropped gels are available as source data.
Extended Data Fig. 6
Extended Data Fig. 6. H3K27me3 and MLL2 dependent transcription
(a) Heatmaps show the corresponding log2 fold changes in gene expression in 1) MLL2KO vs. WT mESCs, 2) MLL2KOSUZ12KO#1 vs. MLL2KO mESCs, 3) MLL2KOSUZ12KO#2 vs. MLL2KO mESCs, 4) MLL2KOSUZ12KO#3 vs. MLL2KO mESCs and 5) MLL2KOSUZ12KO#4 vs. MLL2KO mESCs. The experiment was repeated two times independently with similar results. (b) ChIP-seq tracks of H3K27me3 occupancy at the Snx24 locus in WT, MLL2KO and MLL2KO 100 nM 5dAza for 4 days treated mESCs. The experiment was repeated two times independently with similar results.
Fig. 1:
Fig. 1:. Generation of endogenously tagged mCherry-Magohb mESCs
(a) ChIP-seq tracks of MLL2 and H3K4me3 occupancy at the Magohb locus in WT and MLL2 KO mESCs. The experiment was repeated two times independently with similar results. (b) RNA-seq tracks for Magohb in WT and MLL2 KO mESCs. Two biological replicates are displayed. n = 2 independent biological replicates. (c) Top: Strategy for integration of a 3×FLAG-mCherry tag at the N-terminus of Magohb. Primers (P1 to P4) used for genotyping are shown as arrows. Bottom: PCR genotyping showing WT and a homozygous mCherry-Magohb knockin (KI) clone. (d) Diagram of the CRISPR screen.
Fig. 2:
Fig. 2:. Knockdowns of SET1A/B COMPASS complex members rescue Magohb expression in MLL2 KO cells
(a) CRISPR screen results showing the number of enriched sgRNAs in the ‘Sorted Population’ compared to the ‘Total population’ per gene. The majority of genes fall into the category ‘0 sgRNA enriched out of 4’. (b) Western blot of MAGOHB, WDR82 and HSP90 (loading control) protein levels upon sgRNA targeting each of the 8 candidates. The experiment was repeated two times independently with similar results. (c) MAGOHB expression level of as assessed by real-time qPCR in MLL2 KO mESCs expressing a control sgRNA (Control) or a sgRNA targeting Wdr82 (n = 2). (d) Western blot of SET1A, SET1B, FLAG-MAGOHB, CXXC1 and HSP90 (loading control) protein levels in MLL2 KO mESCs expressing a control shRNA (shNT) or a shRNA targeting CXXC1 (shCXXC1). The experiment was repeated two times independently with similar results. (e) Flow cytometry on mCherry-Magohb KI WT or MLL2 KO mESCs expressing a control shRNA (shNT) or a shRNA targeting CXXC1 (shCXXC1). The experiment was repeated two times independently with similar results. (f) Interleaved scatter plot of Magohb normalized RNA-seq counts in WT mESCs expressing a control shRNA (shNT), MLL2 KO mESCs expressing a control shRNA (shNT) or a shRNA targeting CXXC1 (shCXXC1) (n = 2). (g) Interleaved scatter plot of Magohb normalized RNA-seq counts in WT mESCs, MLL2ΔSET mESCs and TMutant mESCs (n = 2). Uncropped gels are available as source data.
Fig. 3:
Fig. 3:. MLL2 KO transcriptional defects are rescued by SET1A/B knockdown
(a) Left panel: MLL2 occupancy is shown in WT cells in read per million. Note that ChIP-seq signal found in MLL2 KO cells have been subtracted for analysis. Profile is centered on TSS (± 3 kb). Right panel: log2 fold-changes of H3K4me3 ChIP-seq signal in MLL2 KO mESCs compared to WT mESCs (n = 2). K-means clustering was used to partition all genes with Pol II signal in WT mESCs by their H3K4me3 log2 fold-changes upon MLL2 KO and by their MLL2 occupancy. (b) Heatmaps show the corresponding log2 fold-changes in gene expression in MLL2 KO shNT mESCs compared to WT shNT mESCs and MLL2 KO shCXXC1 mESCs compared to MLL2 KO shNT mESCs. (c) Boxplots quantifying PRO-seq signal around TSS (± 3 kb) are shown. The boxplots indicate the median (middle line), the third and first quartiles (box) and the first and fourth quartiles (error bars). P values were computed using Wilcoxon test (two-sided), cluster 1 n = 2,357, cluster 2 n = 10,605. The experiment was repeated two times independently with similar results. (d) Heatmaps show the corresponding log2 fold-changes in gene expression in TMutant shNT mESCs vs. MLL2ΔSET shNT mESCs, TMutant shNT mESCs vs. TMutant shCXXC1 mESCs, and MLL2 KO shCXXC1 mESCs vs. TMutant shNT mESCs. (e) GO terms shown for genes at least partially rescued upon CXXC1 knockdown in MLL2 KO mESCs compared to MLL2 KO mESCs. P values were computed using metascape that utilizes the hypergeometric test and Benjamini-Hochberg P value correction algorithm, n = 942.
Fig. 4:
Fig. 4:. H3K4me3 levels at MLL2-dependent genes are not rescued by CXXC1 knockdown
(a) Metaplots comparing H3K4me3 levels at clusters defined in Figure 3a. Plots are centered on TSS (± 2 kb). The experiment was repeated two times independently with similar results. (b) H3K4me3 ChIP-seq, RNA-seq and MLL2 ChIP-seq track examples are shown for each cluster in read per million.
Fig. 5:
Fig. 5:. Inhibition of DNA methylation is sufficient to restore cluster1 gene expression in MLL2 KO mESCs
(a) RNA-seq and SET1A ChIP-seq tracks for Dnmt1. The experiment was repeated two times independently with similar results. (b) Boxplot analysis of cluster1 gene expression in 1) MLL2 KO vs. WT mESCs, 2) MLL2 KO expressing a sgRNA targeting Dnmt1 vs. WT mESCs expressing a control sgRNA and 3) MLL2 KO treated for 4 days with 100 nM 5dAza vs. WT mESCs. The boxplots indicate the median (middle line), the third and first quartiles (box) and the first and fourth quartiles (error bars). P values were computed using the Wilcoxon test (two-sided), n = 8,662. (c) Box-and-whisker plot quantifying changes in CpG methylation around TSS (± 1 kb) for cluster1 that was sub-clustered into genes with more or less than 25% increase in DNA methylation in MLL2 KO vs WT (n = 3 biological replicates). P values were calculated using a Brown-Forsythe and Welch ANOVA test assuming unequal variances with the Dunnett T3 correction for multiple comparisons (two-sided). (d) Percentage of mCherry-high cells were calculated by flow cytometric analyses 2 days post infection and shown as the mean percentages of mCherry-high cells of two biological replicates.
Fig. 6:
Fig. 6:. Interplay of H3K27me3, DNA methylation and MLL2 for gene transcription
(a) Boxplots quantifying H3K27me3 ChIP-seq signal around TSS (± 3 kb) are shown (n = 2). (b) Western blot of SUZ12, MLL2, H3K27me3 and HSP90 (loading control) protein levels in WT, MLL2 and SUZ12 double KO (4 clones) and MLL2 KO. The experiment was repeated two times independently with similar results. (c) Boxplot analysis of cluster1 gene expression in 1) MLL2 KO vs. WT mESCs and 2–5) MLL2 and SUZ12 double KO vs. WT mESCs (clone #1 to #4). P values were computed using Wilcoxon test (two-sided), n = 1,311. The boxplots indicate the median (middle line), the third and first quartiles (box) and the first and fourth quartiles (error bars). (d) RNA-seq track examples are shown for each clone. The experiment was repeated two times independently with similar results. (e) Venn diagram of RNA-seq comparing MLL2/SUZ12 KO or MLL2 KO shCXXC1 or MLL2 KO 5dAza-treated vs MLL2 KO. Left panel shows the overlap of partially rescued genes (< wild type expression) and right panel shows the overlap of fully rescued genes (= wild type expression level). Uncropped gels are available as source data.
Fig. 7:
Fig. 7:. Interplay of H3K27me3, DNA methylation and MLL2 and its impact on MLL2 KO differentiation defects
(a) Box-and-whisker plot quantifying changes in CpG methylation around TSS (± 1 kb) for cluster1 that was sub-clustered into genes with more or less than 25% increase in DNA methylation in MLL2 KO vs WT (n = 3 biological replicates). P values were calculated using a Brown-Forsythe and Welch ANOVA test assuming unequal variances with the Dunnett T3 correction for multiple comparisons (two-sided). The boxplots indicate the median (middle line), the third and first quartiles (box) and the first and fourth quartiles (error bars). (b) Boxplots quantifying H3K27me3 ChIP-seq signal around TSS (± 3 kb) are shown (n = 2). (c) Heatmap of gene expression in WT, MLL2 KO, MLL2 KO 5dAza-treated and MLL2/SUZ12 double KO EBs at day 6. Differentially expressed genes were selected for genes down-regulation in MLL2 KO EBs compared to WT EBs and rescued upon 5dAza treatment as well as SUZ12 KO. (d) GSEA of genes deregulated between WT vs MLL2 KO EBs, MLL2 KO vs MLL2 KO 5dAza-treated and MLL2 KO vs MLL2/SUZ12 double KO at day 6 (normalized enrichment score (NES); false discovery rate-adjusted P value (FDR q)), n = 434. P values were computed using GSEA that utilizes an empirical phenotype-based permutation test procedure (two-sided).
Fig. 8:
Fig. 8:. Model for an epigenetic equilibrium between Polycomb, COMPASS and DNA methylation machineries at most MLL2-dependent genes
In WT mESCs (top panel), MLL2 COMPASS binds to the promoters of MLL2-dependent genes and deposits H3K4me3 on these promoter regions. In the absence of MLL2 (2nd panel, MLL2 KO), H3K27me3 is deposited on the regions that are now free of MLL2, while DNA methylation remains for most of the genes at the shore of H3K27me3 marks. When DNA methylation is lost (3rd panel), either by targeting CXXC1 that affects Dnmt1 expression or by 5dAza treatment (MLL2 KO shCXXC1 or MLL2 KO 5dAza), H3K27me3 marks are spread to these newly CpG hypomethylated DNA regions, and consequently, the H3K27me3 signal previously observed on the promoter regions of MLL2-dependent genes is diluted and becomes insufficient to repress these genes’ expression. Similarly, after knockout of SUZ12 in MLL2 KO mESCs (bottom panel, MLL2 and SUZ12 double KO), MLL2-dependent genes are transcribed in the absence of MLL2 due to the absence of the repressive H3K27me3 mark.

References

    1. Kouzarides T Chromatin modifications and their function. Cell 128, 693–705 (2007). - PubMed
    1. Meeks JJ & Shilatifard A Multiple Roles for the MLL/COMPASS Family in the Epigenetic Regulation of Gene Expression and in Cancer. Annual Review of Cancer Biology 1, 425–446 (2017).
    1. Shilatifard A The COMPASS family of histone H3K4 methylases: mechanisms of regulation in development and disease pathogenesis. Annu Rev Biochem 81, 65–95 (2012). - PMC - PubMed
    1. Miller T et al. COMPASS: A complex of proteins associated with a trithorax-related SET domain protein. Proceedings of the National Academy of Sciences 98, 12902–12907 (2001). - PMC - PubMed
    1. Schneider J et al. Molecular regulation of histone H3 trimethylation by COMPASS and the regulation of gene expression. Mol Cell 19, 849–56 (2005). - PubMed

Publication types

MeSH terms