. 2020 Jun;4(6):870-884.
doi: 10.1038/s41559-020-1157-y. Epub 2020 May 11.

Stromal reactivity differentially drives tumour cell evolution and prostate cancer progression

Affiliations

Stromal reactivity differentially drives tumour cell evolution and prostate cancer progression

Ziv Frankenstein et al. Nat Ecol Evol. 2020 Jun.

Abstract

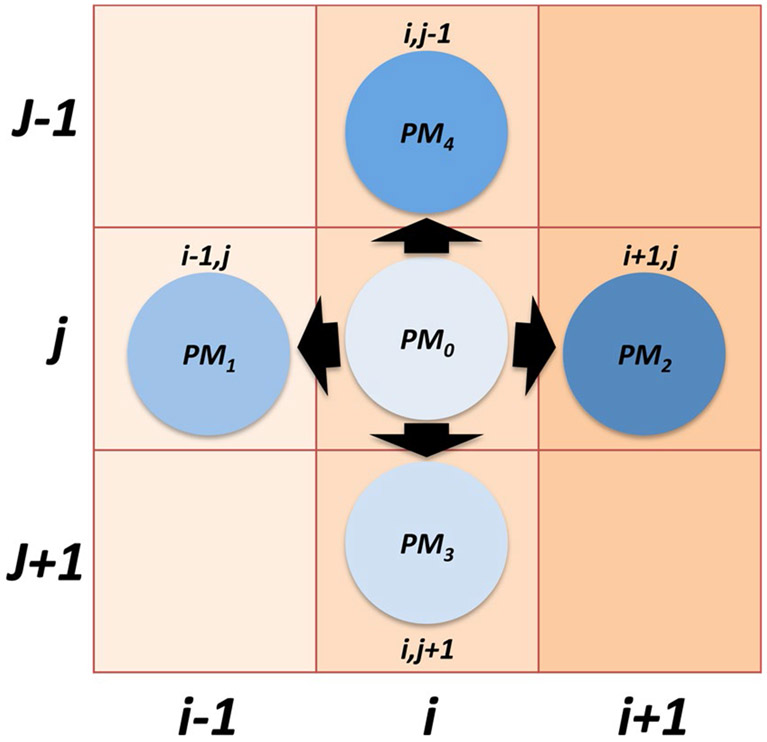
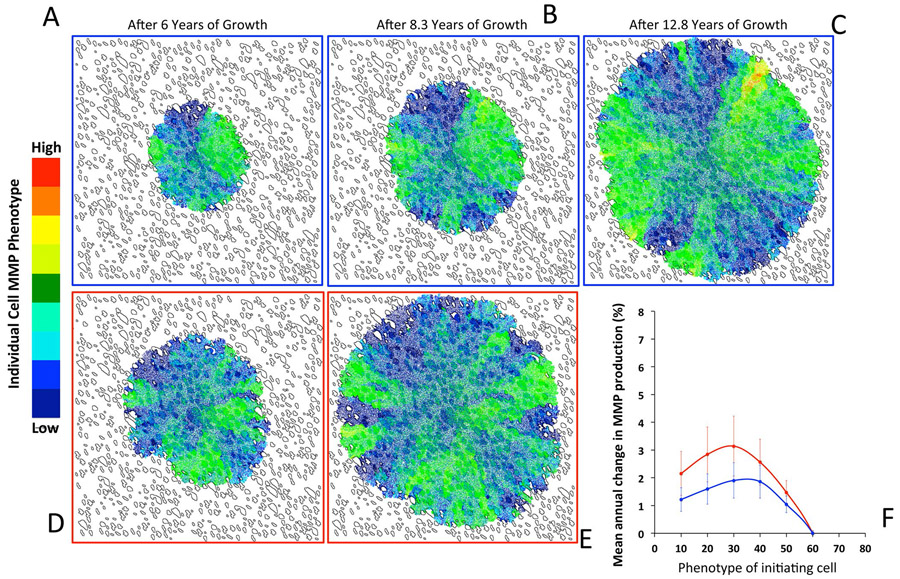
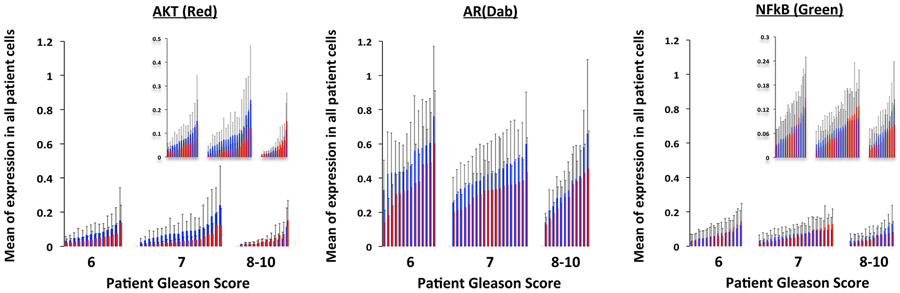
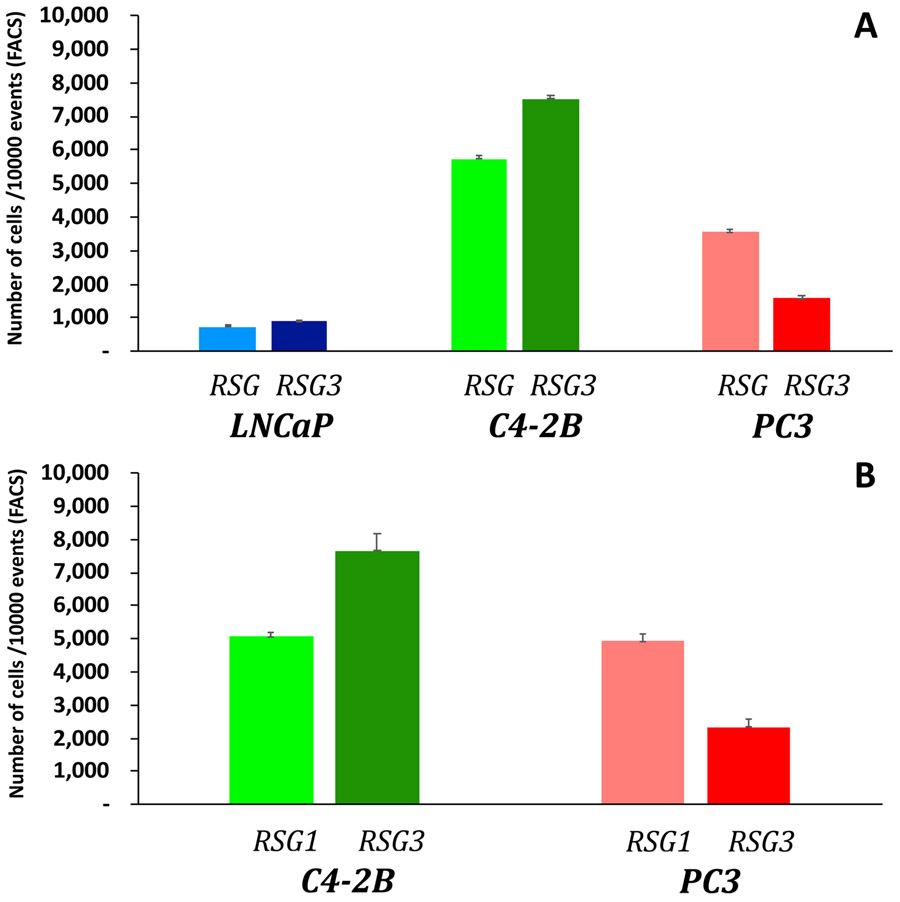
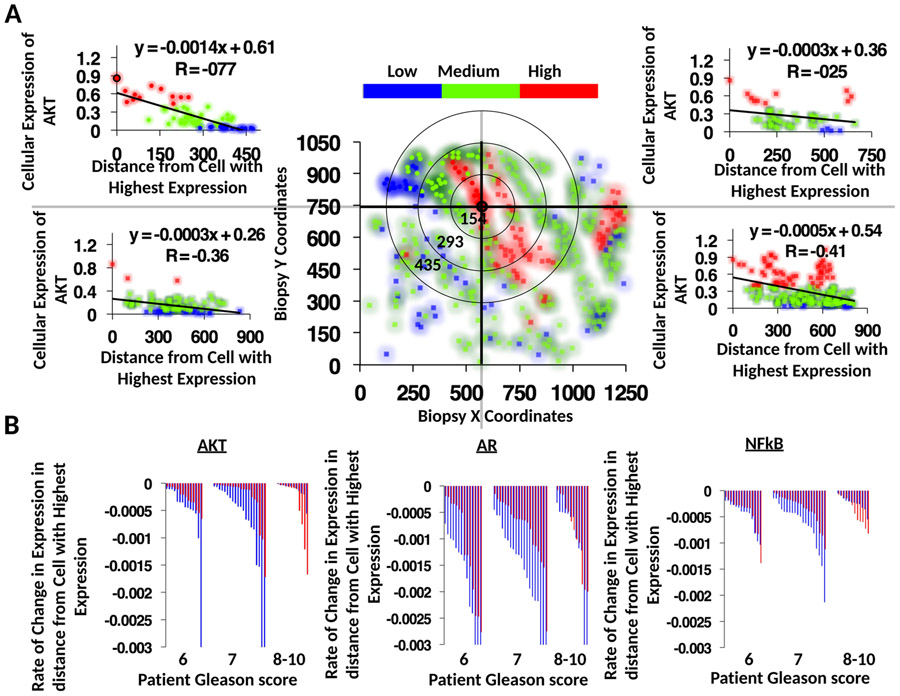
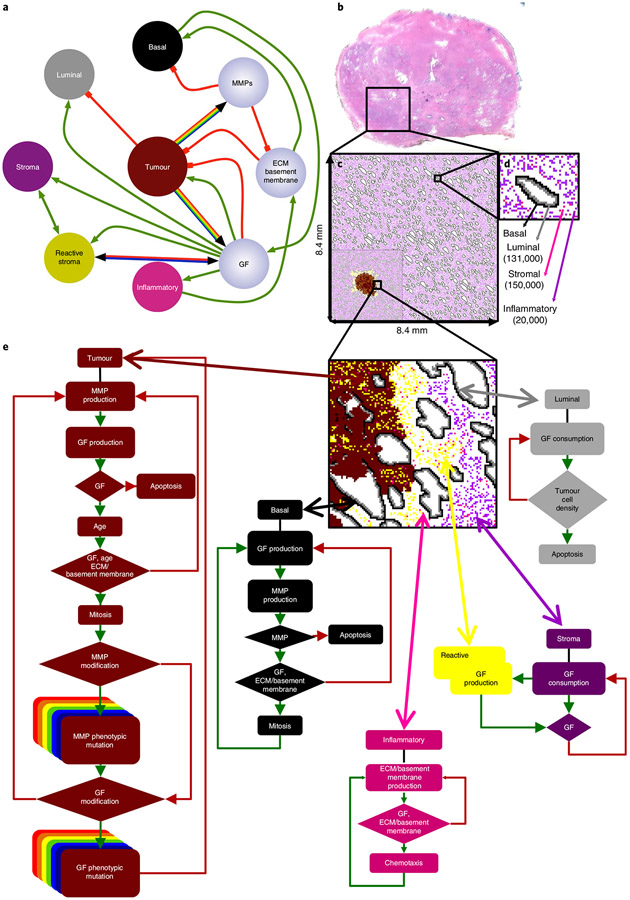
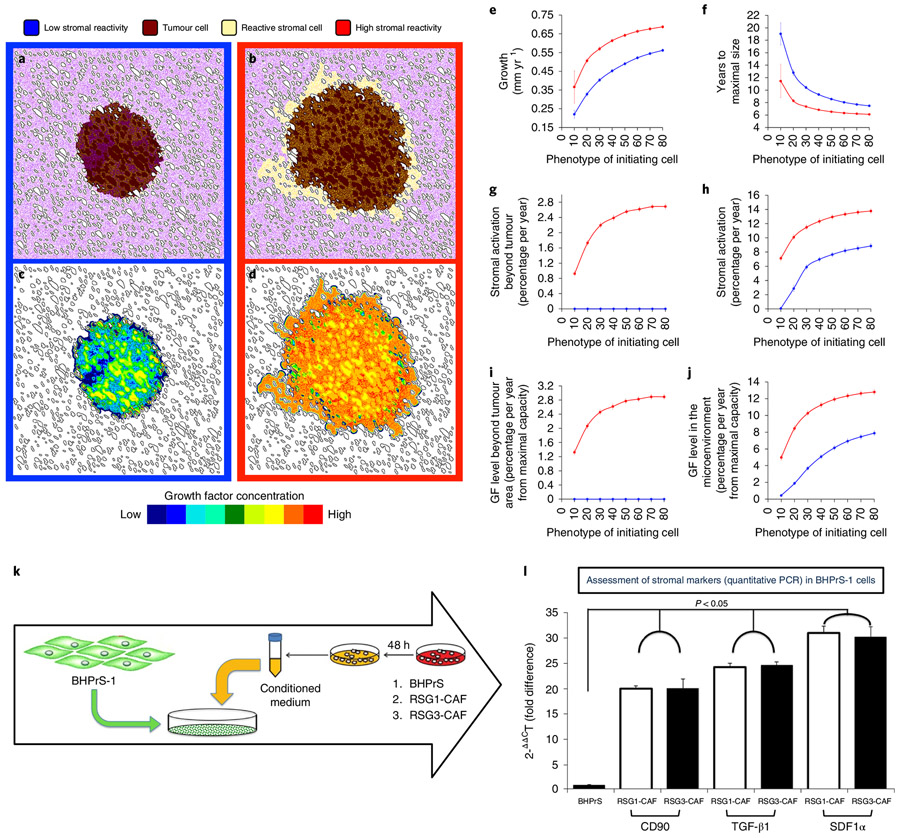
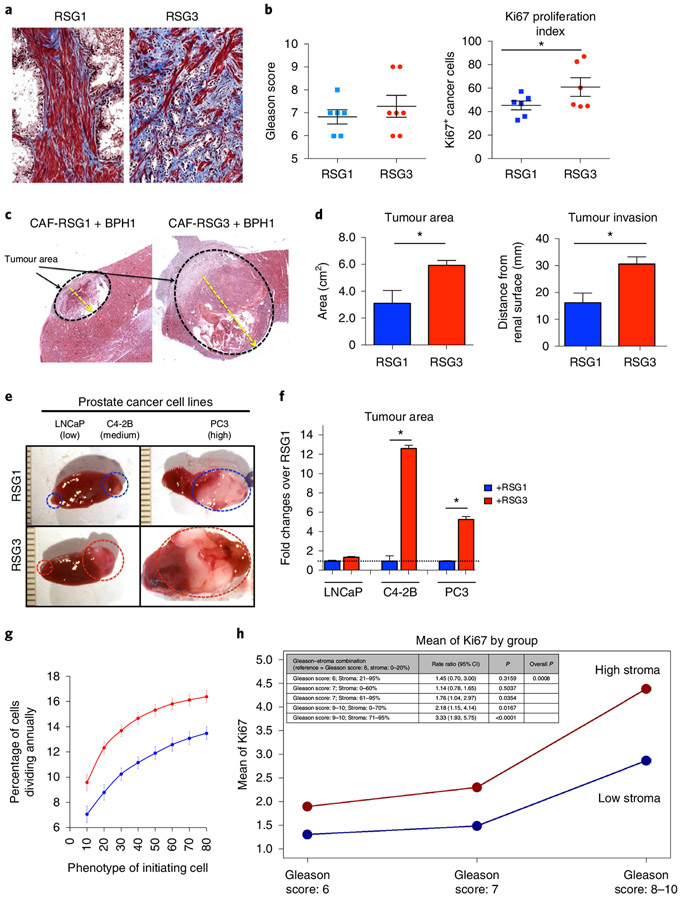
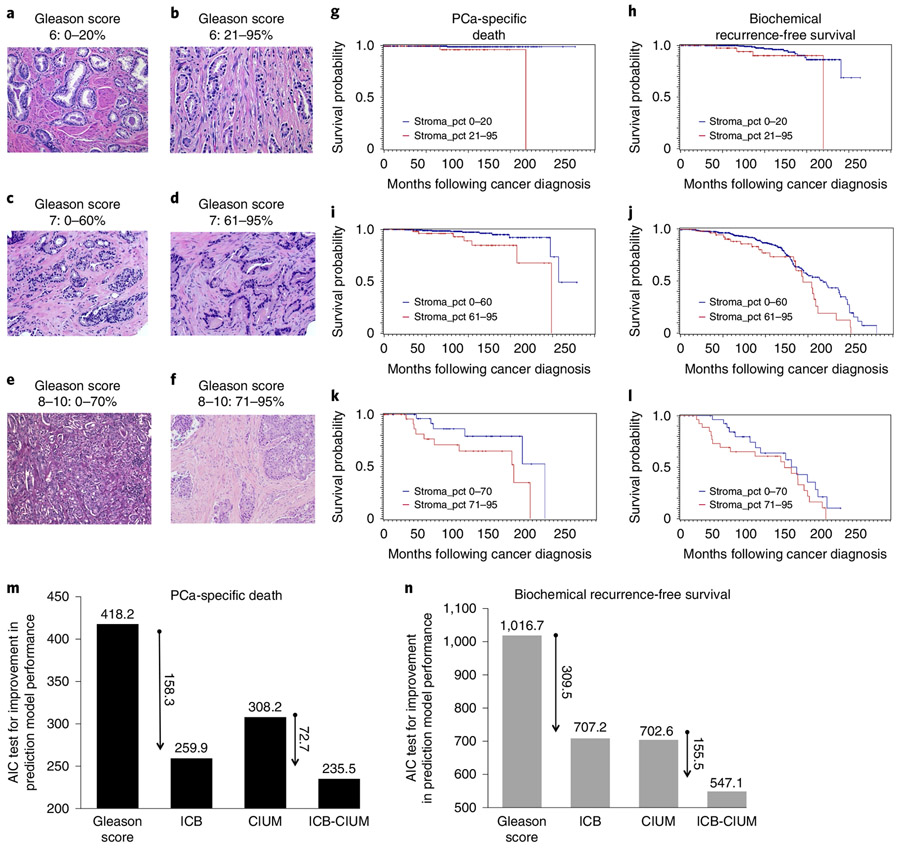
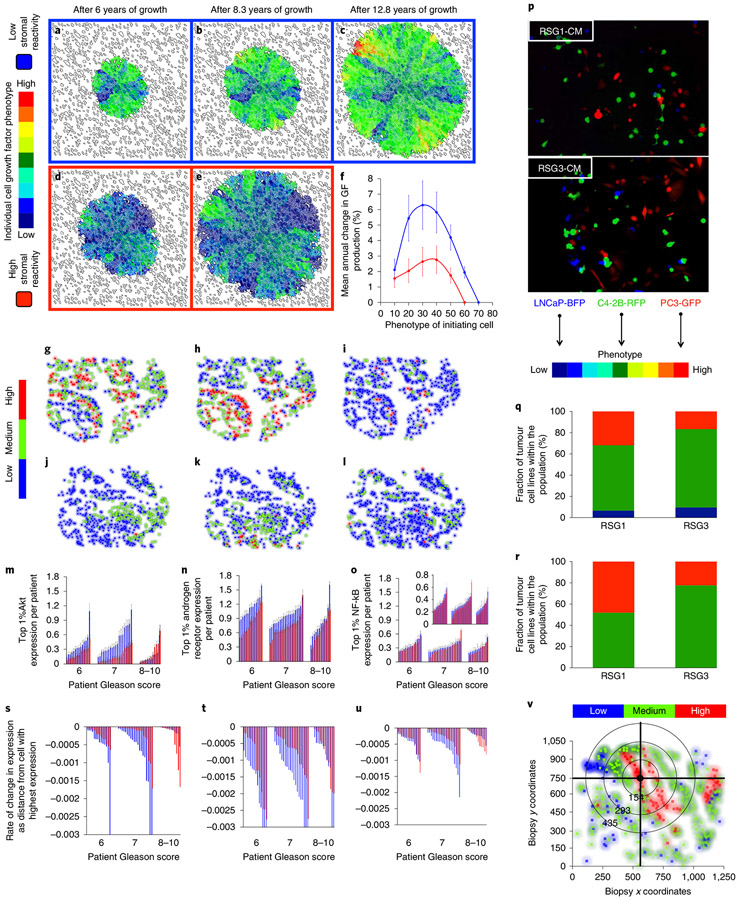
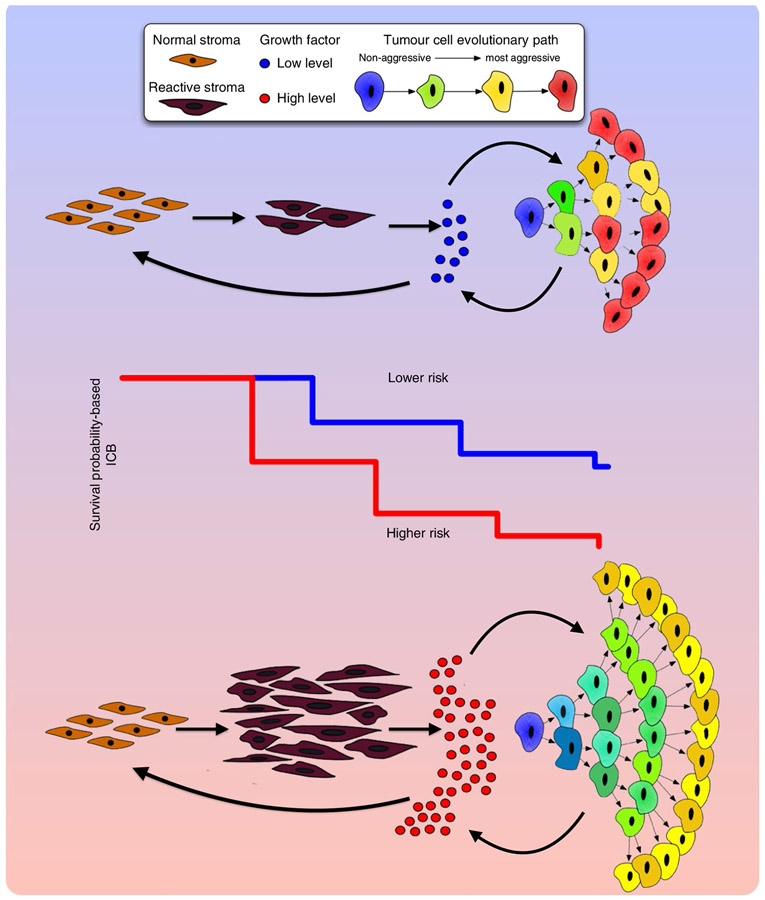
Prostate cancer (PCa) progression is a complex eco-evolutionary process driven by the feedback between evolving tumour cell phenotypes and microenvironmentally driven selection. To better understand this relationship, we used a multiscale mathematical model that integrates data from biology and pathology on the microenvironmental regulation of PCa cell behaviour. Our data indicate that the interactions between tumour cells and their environment shape the evolutionary dynamics of PCa cells and explain overall tumour aggressiveness. A key environmental determinant of this aggressiveness is the stromal ecology, which can be either inhibitory, highly reactive (supportive) or non-reactive (neutral). Our results show that stromal ecology correlates directly with tumour growth but inversely modulates tumour evolution. This suggests that aggressive, environmentally independent PCa may be a result of poor stromal ecology, supporting the concept that purely tumour epithelium-centric metrics of aggressiveness may be incomplete and that incorporating markers of stromal ecology would improve prognosis.


Figures

Extended Data Fig. 1 ∣
Extended Data Fig. 1 ∣. Representation of movement probabilities.
Representation of the probabilities of cell located at coordinates (i,j) moving to one of its four orthogonal neighbors (PM1-4) or remaining stationary (PM0).
Extended Data Fig. 2 ∣
Extended Data Fig. 2 ∣. Evolution of tumour cell MMP production under low and high SR conditions.
The evolution of tumour cell phenotypes through space and time (6-12.8 years) under low (blue) and high (red) SR conditions (this is the MMP equivalent of Fig. 5a-f). Heat map shows tumour cell phenotype (MMP production) distribution in low SR (a-c) and high SR (d, e). Tumor cell phenotypic change in MMP production from 8 different initiating phenotypes in high (red) and low (blue) SR environments (the average change and standard deviation across 100 simulations per initiating phenotype) is show in panel f.
Extended Data Fig. 3 ∣
Extended Data Fig. 3 ∣. SR drives tumour cell evolution and progression.
Extension of Fig. 5m-o. Single cell quantitative analysis of the triple immunostained (AKT, AR and NFkB) tissue sections for patients with RSG1 (blue) vs. RSG3 (red) in each Gleason category. Expression in all cells from each of the patient’s biopsies are shown, each individual bar represents the average (and deviation) for a single patient over all cells. Insets for AKT and NFkB have more appropriate y-axis scales to better illustrate differences.
Extended Data Fig. 4 ∣
Extended Data Fig. 4 ∣. Co-culture experiment details (Relevant to Fig. 5q, r).
a. Prostate Cancer cell lines LNCaP-BFP, C4-2B-RFP and PC3-GFP were cultured in the presence of conditioned medium (CM) from RSG1-CAF or RSG3-CAF for 4 weeks. Quantitation of individual cell populations was determined by FACS analysis. The number of each cell line out of 10,000 gated total number of cells (Y-axis) is shown for each cell line. b. Co-culture experiments using aggressive C4-2B and PC3 cells exposed to RSG1-CAF and RSG3-CAF. Quantitation and analysis were similar to those performed for the triple co-culture experiments. Data represents the mean of three different experiments performed in triplicate.
Extended Data Fig. 5 ∣
Extended Data Fig. 5 ∣. Calculating evolutionary gradients from patient biopsies.
Analysis of triple stained tissue samples (Gleason 7 with RSG1) illustrating our approach to identify the most statistically significant evolutionary gradient in AKT expression. To identify the most significant gradient across a given biopsy, we analyzed the rate of change in expression through space starting from the cell with highest individual level of expression. Slope was calculated across radial distance from the cell with highest expression in the biopsy, in the example shown here, coordinates (575,746) (a). Analysis was performed on patients with RSG1 and compared to RSG3 in each Gleason category (b) showing the most significant slope per patient for the 3 molecular markers, AKT (left), AR (middle) and NF-B (phospho-p65, right). The larger the slope the more quickly expression changes with distance from the highest expressing cell. per patient for the 3 molecular markers, AKT (left), AR (middle) and NF-B (phospho-p65, right). The larger the slope the more quickly expression changes with distance from the highest expressing cell.
Fig. 1 ∣
Fig. 1 ∣. In silico multiscale model of the prostate peripheral zone.
a, Interaction network of key model variables. Interactions between cells (coloured nodes) and microenvironmental variables (lilac nodes) are represented as either green (positive) or red (negative) connections. Multicoloured connectivity represents the spectrum of possible tumour phenotypes with different levels of growth factor and MMP production. Bicoloured connectivity represents two different degrees of stromal reactivity. b-d, In silico reconstruction of the normal prostate peripheral zone tissue. b, Histopathological slide of the whole normal prostate, highlighting the peripheral zone, filled with epithelial acini surrounded by stroma (magenta). c, In silico representation of the complete peripheral zone, including ductal structures and cellular densities that mimic normal anatomy. This constitutes the domain where all simulations were performed. The inset on the bottom left is an example of a sample simulation d, Representation of a single reconstructed duct and the surrounding stroma, as well as the total number of cell types. e, Cell decision flow charts for each cell type in the model. The phenotypic behaviour of an individual cell is based on the interaction between the cell and the local microenvironment. GF, growth factor.
Fig. 2 ∣
Fig. 2 ∣. Change in stromal reactivity phenotypes, tumour growth and invasiveness.
a-d, Six years of simulated tumour growth, initialized with a tumour cell producing low levels of growth factors (20% of the maximal simulated cell production capacity) under two different microenvironmental conditions: low stromal reactivity (a,c, blue frames and lines) or high stromal reactivity (b,d, red frames and lines). a and b show tumour cell spatial distribution (brown) with normal stroma (purple) and reactive stroma (yellow); c and d show the resulting spatial distributions of growth factor concentration for tumours a and b, respectively. e-j, Different tumour metric distributions over eight initiating phenotypes (ranging from 10% to 80% of the maximal simulated cell growth factor production capacity) in high (red) and low (blue) stromal reactivity environments averaged over 100 simulations per phenotype (error bars represent mean ± s.d.). e, Average growth of the tumour. f, Time to achieve maximal size (reach the edge of the tissue domain). g,h, Percentage of stromal activation within (g) and beyond (h) the tumour varied with the phenotype of the tumour-initiating cells and with the stromal reactivity. i,j, The concentration of growth factor found in the microenvironment beyond (i) and within (j) the tumour parallels stromal activation. k, To assess the ability of reactive stroma to activate benign stroma cells, the human prostate stromal cell line BHPrS1 was cultured in the presence of conditioned medium from either BHPrS1, RSG1-CAF or RSG3-CAF for 4 weeks. l, At the end of the experiment, expression of CD90, TGF-β1 and SDF1α (all putative activated stromal markers) was determined by quantitative PCR. Conditioned media from RSG1-CAF and RSG3-CAF elicited a similar and significant increase in the levels of these mRNAs compared to medium conditioned by the functionally normal BHPrS1 cell line. Relative levels of mRNA are shown compared to a control standardized to a mean value of one. Error bars represent s.d. In all three cases, the marker mRNAs are increased markedly by conditioned medium (P < 0.05; ANOVA) but there was no difference in effect between conditioned medium from RSG1- or RSG3-derived fibroblasts.
Fig. 3 ∣
Fig. 3 ∣. In vivo stromogenic grade is linked to tumour growth and invasion but not to Gleason grade.
a, Representative images of stromogenic response in PCa from two different patients showing RSG1 (left) and RSG3 (right). Note the intense and high percentage of reactive stroma (blue) depicting increased collagen deposition in the RSG3 sample. b, A total of 23 patients were categorized according to their Gleason score (left). No correlation was found between Gleason score and RSG. However, cancer cells surrounded by RSG3 stroma had increased proliferation (number of Ki67+ stained cells) compared to RSG1 as determined by t-test comparison (*P < 0.05). c, Response of an initiated reporter epithelial cell line (BPH1) to CAFs is a function of the RSG status of the tumour source of the CAFs. Low magnification of CAF combined with BPH1 cells in vivo. Both RSG1-CAF and RSG3-CAF promoted malignant transformation. d, Quantitation of tumour area and invasion revealed increased growth and aggressiveness in RSG3-CAF compared to RSG1-CAF (t-test analysis performed to compare differences between groups, three different experiments each performed in triplicate; P < 0.01 in both cases). Response of epithelial cells to CAFs is a product of both the epithelial and stromal components of the tumour. e, Gross picture of the PCa cell lines LNCaP, C4-2B and PC-3 cells tissue recombinants with RSG1- and RSG3-CAFs. Six recombinants per group were grafted using 12 animals. f, Fold change analysis of PCa cell lines combined with RSG-CAFs in a tissue recombinant show significant increased growth in the presence of RSG3 compared to RSG1 in C4-2B and PC-3 but not LnCaP cells (t-test analysis performed to compare differences between groups, three different experiments each performed in triplicate; P < 0.01 for C4-2B and PC3). g, Tumour cell division rate calculated from our in silico model simulations over 8 different initiating phenotypes in high (red) and low (blue) stromal reactivity environments (averaged over 100 simulations; error bars represent mean ± s.d.). h, The proliferation rate of cancer cells, as measured by Ki67, was significantly higher in stromogenic than non-stromogenic cancers, in all Gleason categories based on the Poisson regression model.
Fig. 4 ∣
Fig. 4 ∣. The ICB stratifies all Gleason grades in a cohort of 1,291 PCa patients with over 20 years of follow-up.
a,b, Histology of a Gleason-score-6 cancer without stromal response (a) compared to a Gleason-score-6 cancer with exuberant stromogenic response (RSG3) (b). g,h, Patients with more than 20% of the tumour having an RSG3 pattern were associated with increased PCa-specific death (g, P = 0.0008) and biochemical recurrence (h, P = 0.0597). c,d, Histological representations for Gleason-score-7 cancers without reactive stroma (c) and with RSG3 (d). i,j, In Gleason-score-7 patients, the cut-off for statistical significance is 60% of the tumour having an RSG3 pattern (i, PCa-specific death, P = 0.004; j, biochemical recurrence, P = 0.0341). e,f, High-Gleason-score cancers (Gleason score, 8-10) can grow in solid masses (e) or embedded in RSG3 (f). k,l, The cut-off in this category is higher at 70% (k, PCa-specific death, P = 0.0716; l, biochemical recurrence, P = 0.1738). An AIC test was used to compare different predictive models of PCa-specific death and recurrence-free survival. CIUM, clinical in use methodology: Gleason score, seminal vesicle invasion, extra-capsular extension and PSA. m,n, The AIC model for PCa-specific death-free survival (m) and biochemical recurrence-free survival (n) show the much-improved performance of the ICB compared to standard of care. The preferred model is the one with the lowest AIC value. g-l, A log-rank test was used.
Fig. 5 ∣
Fig. 5 ∣. Stromal reactivity drives tumour cell evolution and progression: in silico and clinical analysis.
a-e, Evolution of tumour cell phenotypes through space and time (6-12.8 years) under low (blue) and high (red) stromal reactivity conditions (this figure extends the timescale of Fig. 2a-d). The heatmap shows tumour cell phenotype (growth factor production) distribution in low (a-c) and high stromal reactivity (d,e) after 6 (a,d), 8.3 (b,e) and 12.8 (c) years of growth. f, Tumour cell phenotypic change in growth factor production from 8 different initiating phenotypes in high (red) and low (blue) stromal reactivity environments (the average change and s.d. across 300 simulations per initiating phenotype) is shown. g-l, Representative samples of triple-immunostained biopsies for three well-established PCa molecular regulators—phosphorylated Akt (g,j); androgen receptor (h,k); and the central inflammatory regulator NF-κB (i,l)—from two patients, one with RSG1 (g-i) and the other with RSG3 (j-l); levels of expression were classified as low (blue), medium (green) or high (red). m-o, Single-cell quantitative analysis of triple-immunostained tissue sections for patients with RSG1 (blue) versus RSG3 (red) in each Gleason category for the three molecular markers, Akt (m), androgen receptor (n) and NF-κB (phospho-p65, o). The top 1% of gene expression in cells from each of the patient’s biopsies are shown (subset of the tumour cell population that would be under the greater selection pressure); each individual bar represents the average (and s.d.) for a single patient over many cells. The PCa cell lines LNCaP-BFP (blue), C4-2B-RFP (green) and PC-3-GFP (red) were cultured in the presence of conditioned medium from either NPF, RSG1-CAF or RSG3-CAF for 4 weeks. p, Representative images for each group are shown (cells are false coloured for internal consistency of illustrations). q,r, Quantitation of individual cell populations was determined by fluorescence-activated cell sorting analysis and shows the fraction of each tumour cell line, LNCaP-BFP (blue), C4-2B-RFP (green) and PC-3-GFP (red), in RSG1-CAF or RSG3-CAF conditioned medium. To identify the most significant evolutionary gradient in expression across a given biopsy, we analysed the rate of change in expression through space starting from the cell with the highest individual level of expression. Each sample was split into four different sections, with the origin of this split being the highest expressing cell in the example shown (coordinates, 575,746) (v) (see Extended Data Fig. 5 for more detail). The slope from that cell to the edge of the biopsy in terms of radial distance was then calculated. The most statistically significant slope was the one assigned to that specific patient. s-u, This analysis was performed on patients with RSG1 and compared to RSG3 in each Gleason category showing the most significant slope per patient for the three molecular markers, Akt (s), androgen receptor (t) and NF-κB (phospho-p65) (u). The larger the slope the more quickly expression changes with distance from the highest expressing cell. In m-o and s-u, 14 RSG1 and 14 RSG3 Gleason-score-6 patients; 20 RSG1 and 20 RSG3 Gleason-score-7 patients; and 12 RSG1 and 12 RSG3 Gleason-score-8-10 patients were analysed.
Fig. 6 ∣
Fig. 6 ∣. Interactions between tumour cells and stroma shape the evolutionary dynamics of PCa and drive overall tumour aggressiveness.
Growth factor signalling is essential to both tumour and reactive stroma. Limited availability of growth factors leads to an increased competition between tumour and stromal cells. This competition results in slower tumour growth (lower risk estimation) but also increased selection and more rapid evolution (leading to a more heterogeneous population). In contrast, where growth factor availability is not limiting, there are more mutualistic interactions between tumour and stroma. This situation results in faster growing tumours (higher risk estimation) but, paradoxically, weaker selection pressure leading to less aggressive tumour cells (and a less heterogeneous population). Therefore, evolution of the most malignant phenotypes in a tumour cell population is not necessarily consistent tumour growth and invasion since it is modulated by the stromal response. In addition, tumour aggressiveness, as defined by the Gleason score, is differentially modulated by stromal response. These different risk estimations and evolutionary dynamics (and tumour heterogeneity) mean that the overall behaviour of patient tumours is driven by both tumour cells (Gleason score) and the stromal response of the host (ICB).

References

    1. Strand DW, Franco OE, Basanta D, Anderson ARA & Hayward SW Perspectives on tissue interactions in development and disease. Curr. Mol. Med 10, 95–112 (2010). - PMC - PubMed
    1. Simon-Assmann P, Spenle C, Lefebvre O & Kedinger M The role of the basement membrane as a modulator of intestinal epithelial-mesenchymal interactions. Prog. Mol. Biol. Transl. Sci 96, 175–206 (2010). - PubMed
    1. Parmar H & Cunha GR Epithelial-stromal interactions in the mouse and human mammary gland in vivo. Endocr. Relat. Cancer 11, 437–458 (2004). - PubMed
    1. Sugimoto H, Mundel TM, Kieran MW & Kalluri R Identification of fibroblast heterogeneity in the tumor microenvironment. Cancer Biol. Ther 5, 1640–1646 (2006). - PubMed
    1. Orimo A. et al. Stromal fibroblasts present in invasive human breast carcinomas promote tumor growth and angiogenesis through elevated SDF-1/CXCL12 secretion. Cell 121, 335–348 (2005). - PubMed

Publication types