. 2020 Jun;22(6):640-650.
doi: 10.1038/s41556-020-0513-0. Epub 2020 May 11.

NFI transcription factors provide chromatin access to maintain stem cell identity while preventing unintended lineage fate choices

Affiliations

NFI transcription factors provide chromatin access to maintain stem cell identity while preventing unintended lineage fate choices

Rene C Adam et al. Nat Cell Biol. 2020 Jun.

Abstract

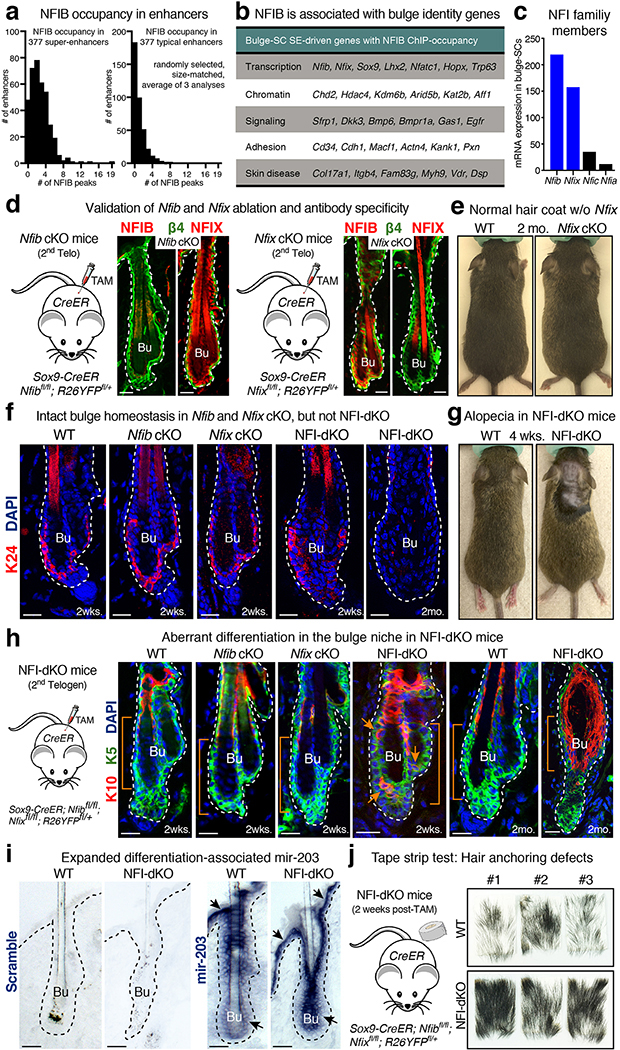
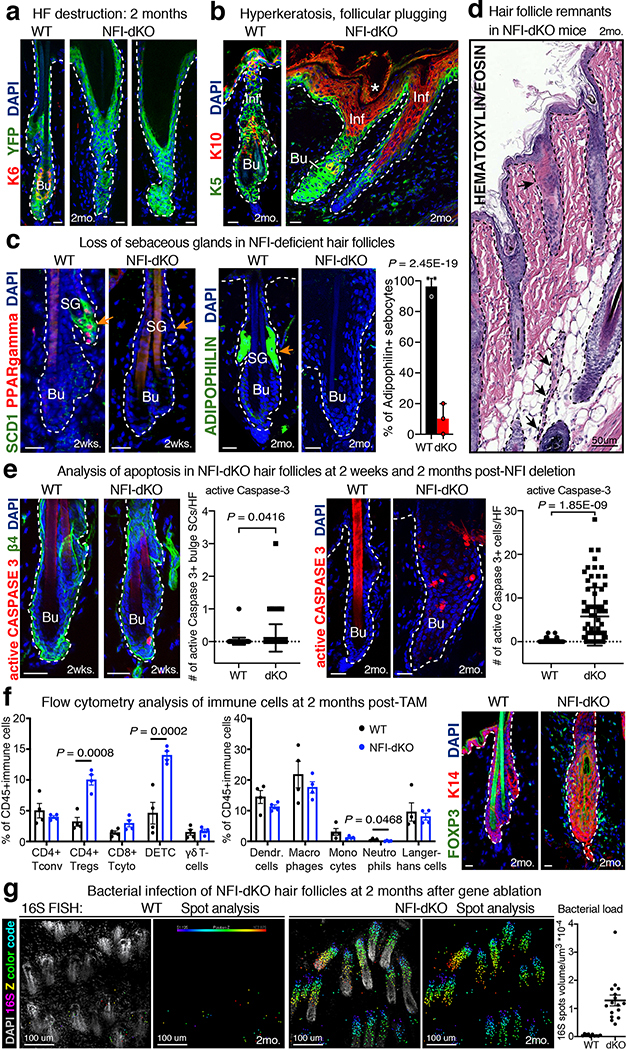
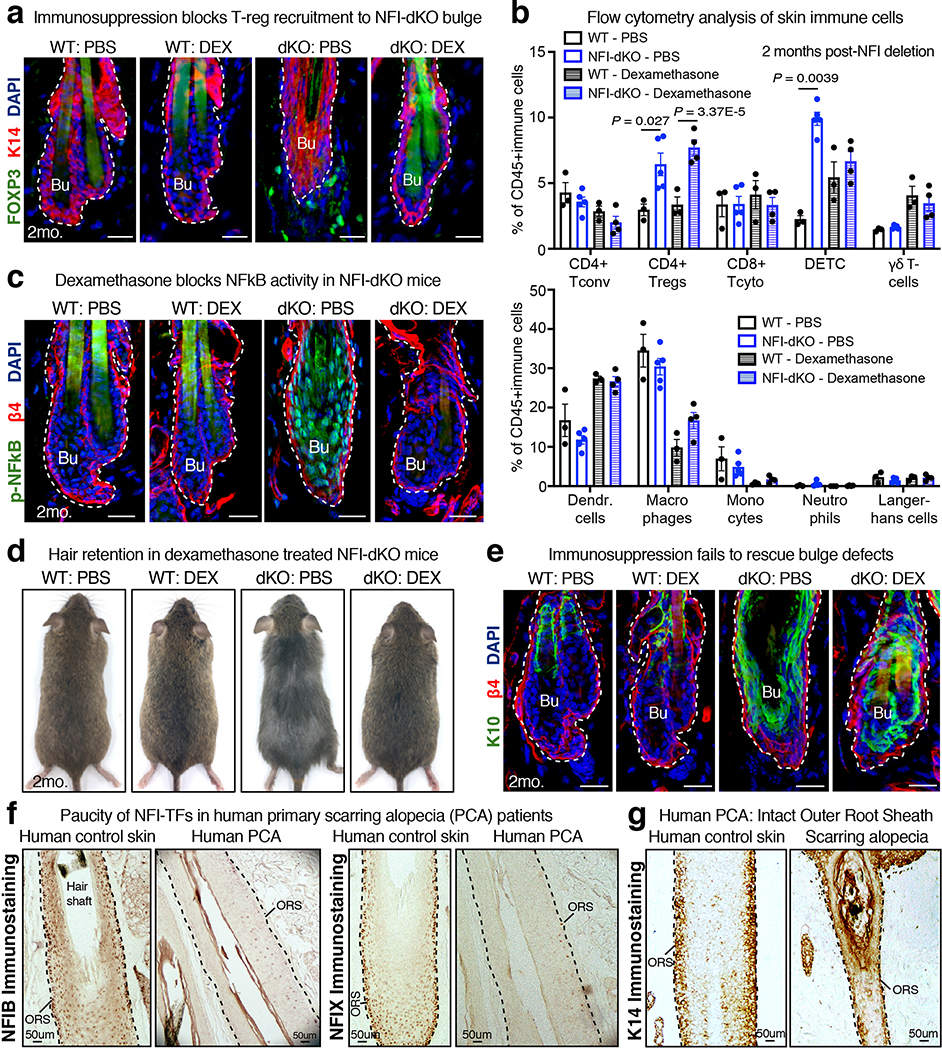
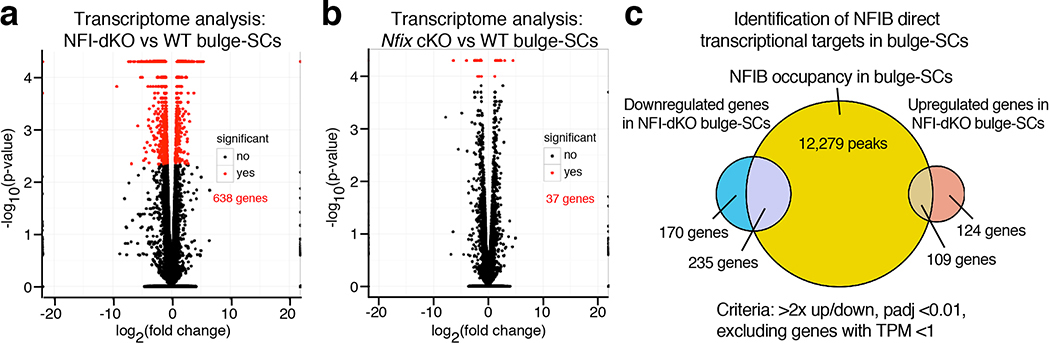
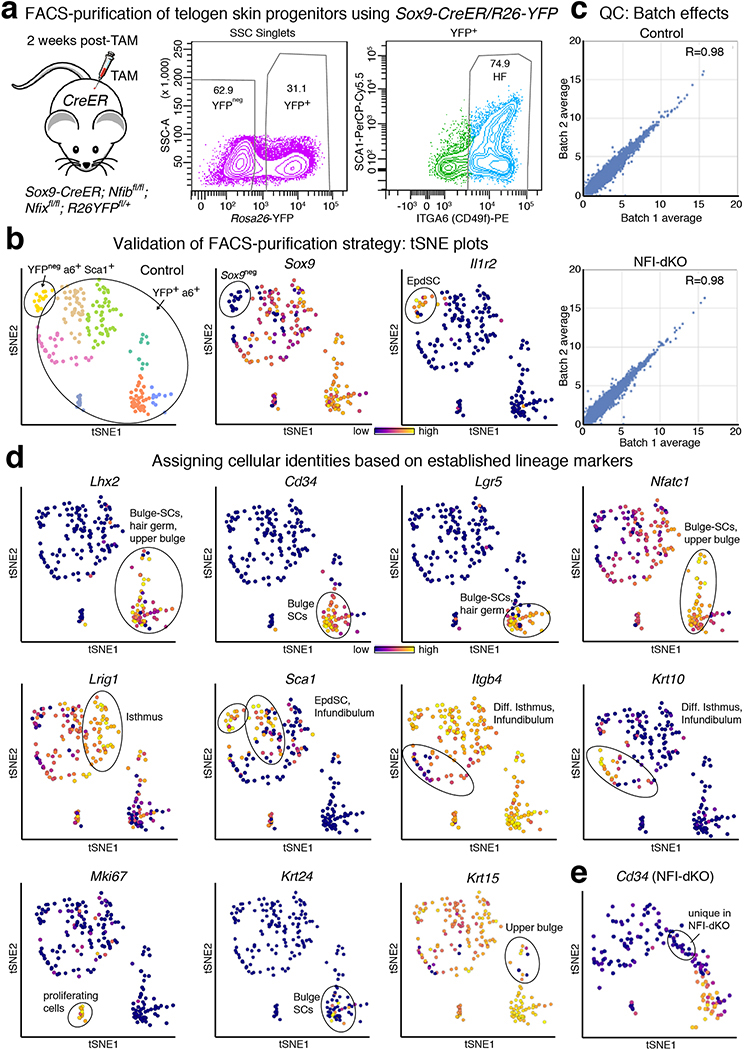
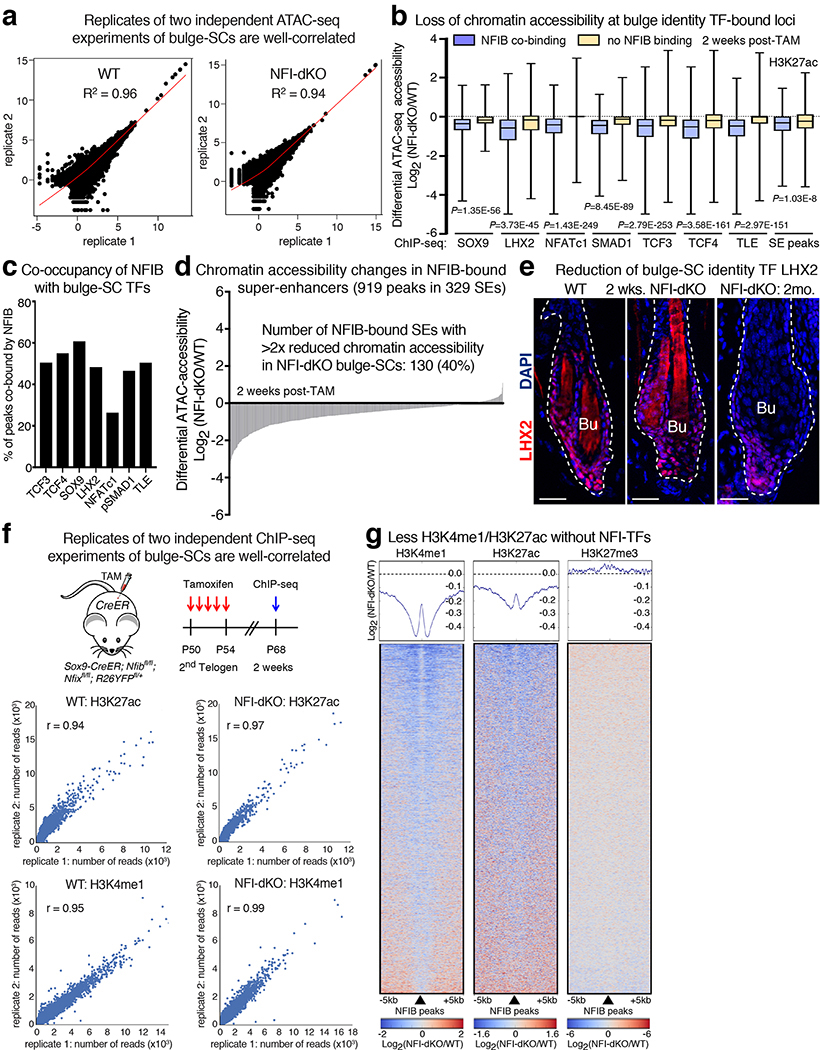
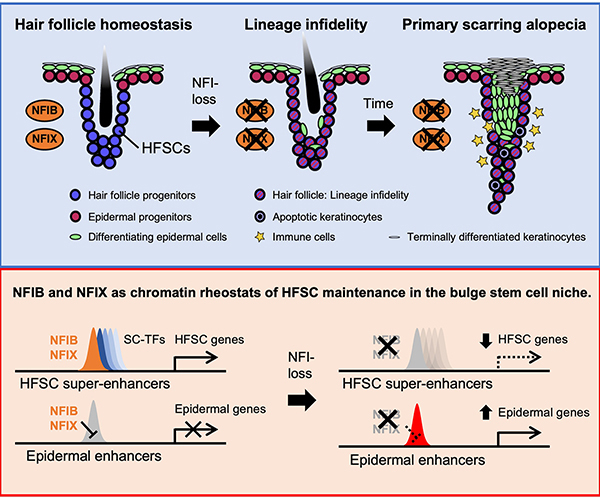
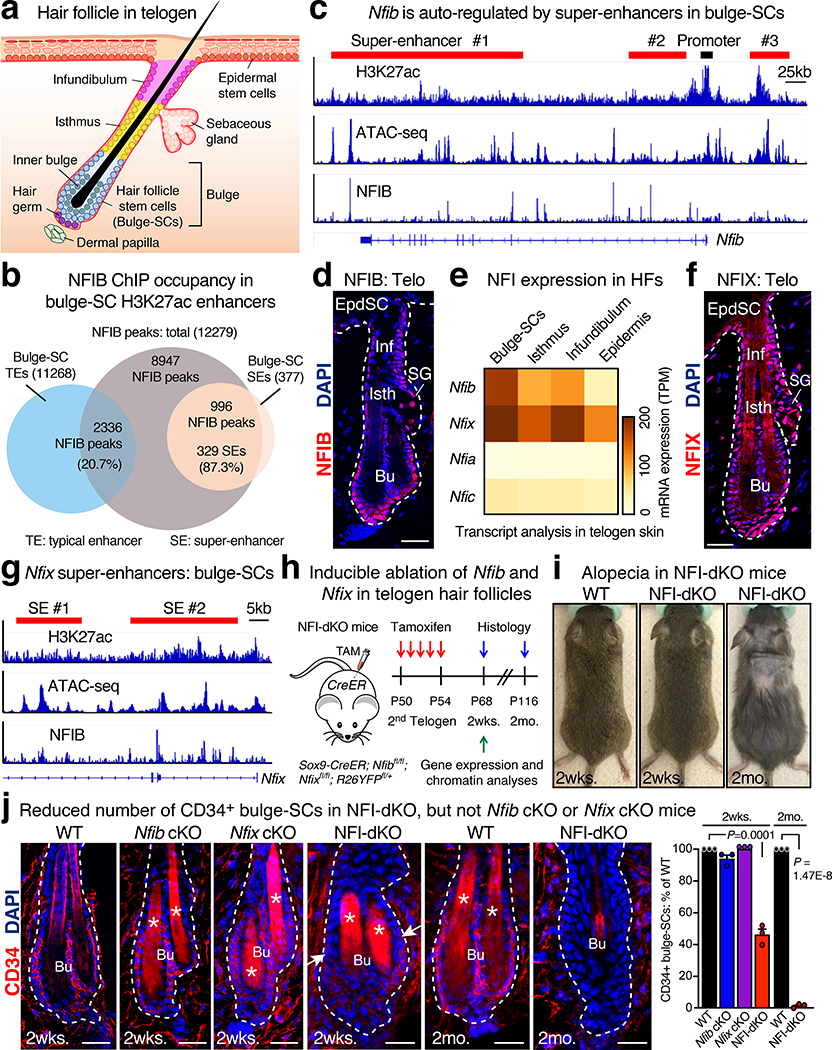
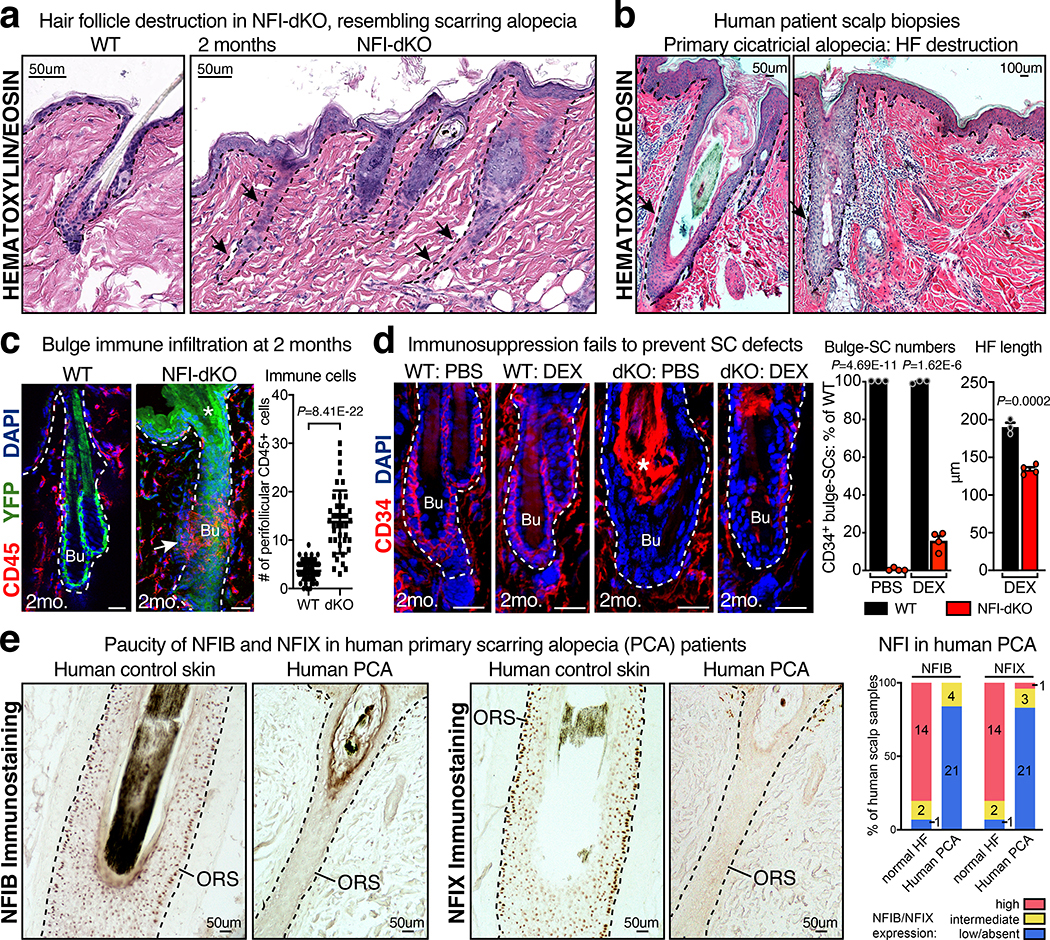
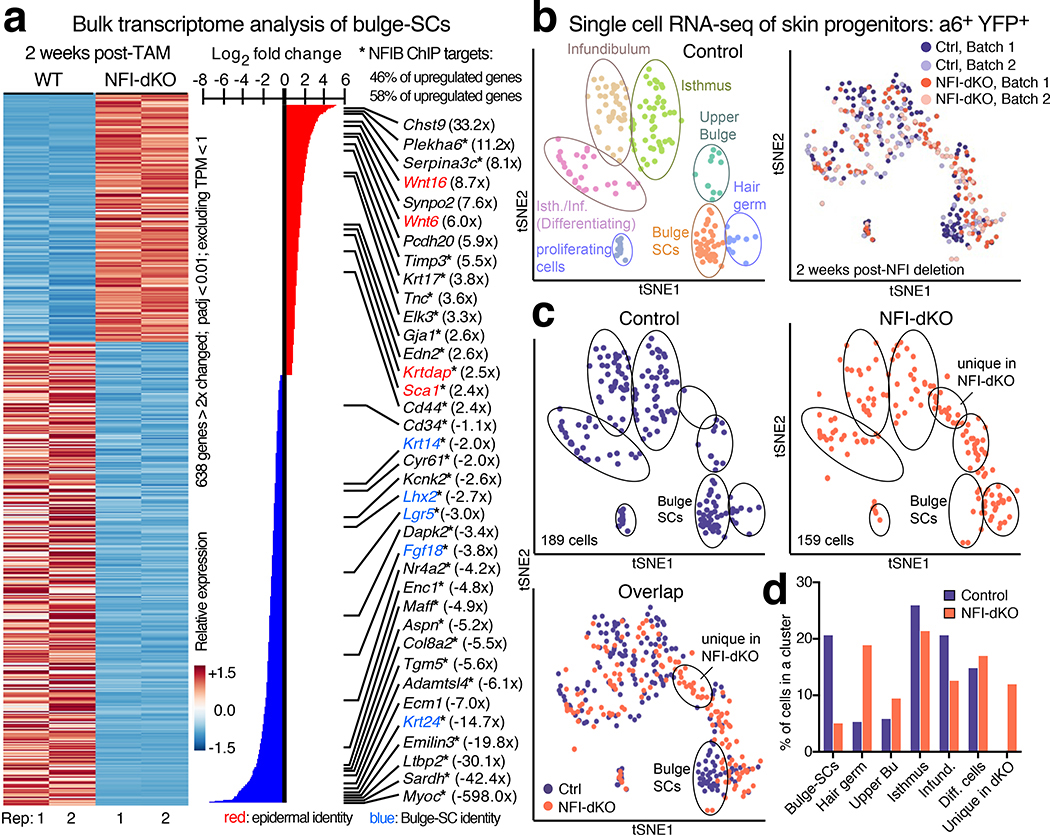
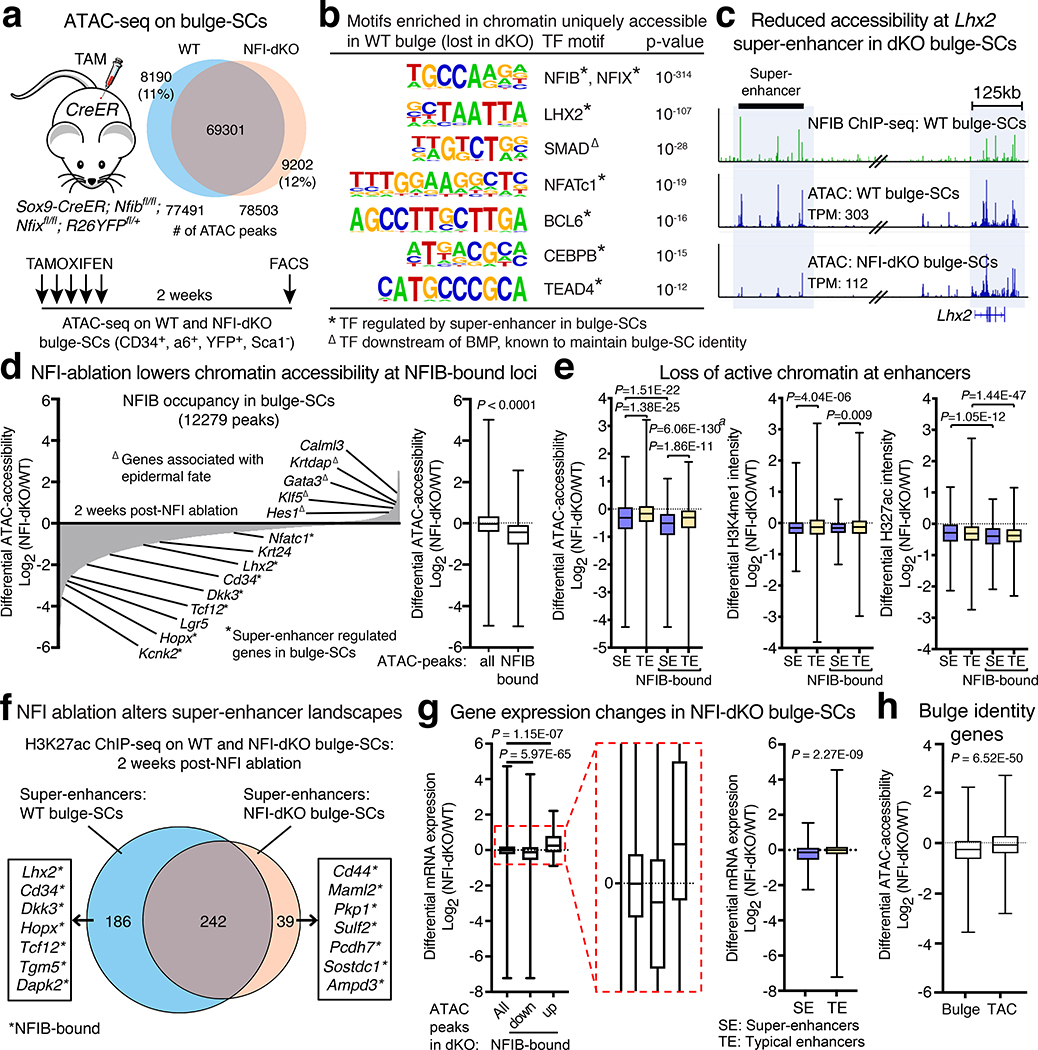
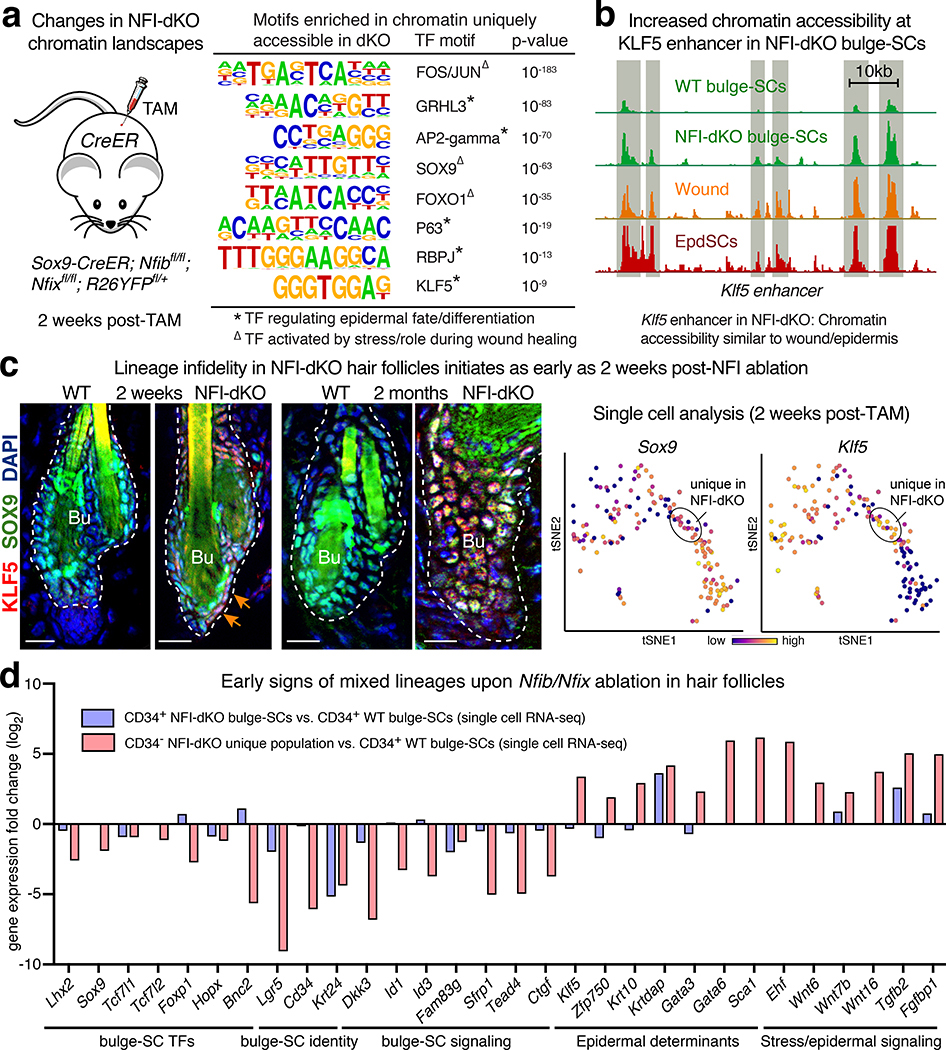
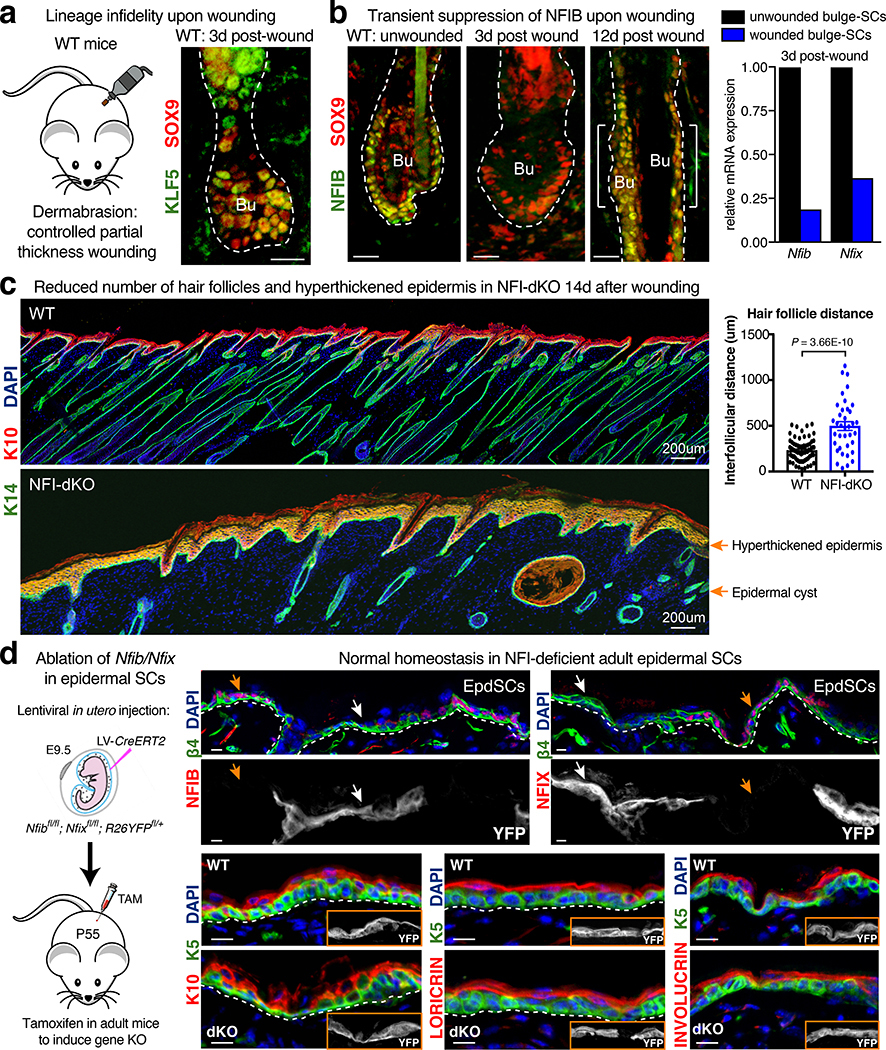
Tissue homeostasis and regeneration rely on resident stem cells (SCs), whose behaviour is regulated through niche-dependent crosstalk. The mechanisms underlying SC identity are still unfolding. Here, using spatiotemporal gene ablation in murine hair follicles, we uncover a critical role for the transcription factors (TFs) nuclear factor IB (NFIB) and IX (NFIX) in maintaining SC identity. Without NFI TFs, SCs lose their hair-regenerating capability, and produce skin bearing striking resemblance to irreversible human alopecia, which also displays reduced NFIs. Through single-cell transcriptomics, ATAC-Seq and ChIP-Seq profiling, we expose a key role for NFIB and NFIX in governing super-enhancer maintenance of the key hair follicle SC-specific TF genes. When NFIB and NFIX are genetically removed, the stemness epigenetic landscape is lost. Super-enhancers driving SC identity are decommissioned, while unwanted lineages are de-repressed ectopically. Together, our findings expose NFIB and NFIX as crucial rheostats of tissue homeostasis, functioning to safeguard the SC epigenome from a breach in lineage confinement that otherwise triggers irreversible tissue degeneration.


Conflict of interest statement

COMPETING INTERESTS

The authors declare the following competing interests: R.C.A. is currently employed at Regeneron Pharmaceuticals. E.F. is on the Scientific Advisory Board of L’Oreal and Arsenal Biosciences.

Figures

Extended Data Fig. 1
Extended Data Fig. 1. NFI-TFs Maintain Bulge-SC Identity and Prevent Ectopic Differentiation.
a, Enrichment of NFIB within chromatin of super-enhancers, compared to typical enhancers. Comparisons were made with 377 randomly selected typical enhancers and their flanking sequence extended 5’ and 3’ to match the average length of super-enhancers (average of 3 analyses is shown). b, Table showing examples of bulge-SC super-enhancer regulated genes with NFIB ChIP-occupancy. c, mRNA expression levels (TPM) of NFI family members in bulge-SCs. Mean TPM from 2 independent replicates are shown. d, Validation of Nfib and Nfix gene knockout and antibody specificity. INTEGRIN β4 (β4) marks basal epithelial cells. Inner bulge cells are β4neg, adjacent to the hair shaft and are critical to anchor the hair. e, Images of WT and Nfix cKO mice at 2 months post-TAM. Nfix-ablation on its own has no impact on the hair coat. f, Immunofluorescence using K24 antibody to label bulge-SCs. Ablation of Nfib or Nfix alone does not affect bulge-SCs, whereas combined ablation results in a loss of K24+ bulge-SCs. g, Images of WT or NFI-dKO mice at 4 weeks post-TAM. h, Immunofluorescence comparing telogen HFs of WT, Nfib cKO, Nfix cKO and Nfib/Nfix-dKO mice. K5 marks basal epithelial cells. Note aberrant K10+ (differentiating) cells only in double Nfib/Nfix targeted (dKO) mice. i, In situ hybridization using scramble or mir-203 probes on mouse skin. Note expansion of signal for the epidermal differentiation microRNA, mir-203, into bulge of NFI-dKO skin. j, Tape strip assay to evaluate hair anchoring. Tape stripping applies a mild tug to the hairs, which will be released from the coat if anchorage is weak. All scale bars = 20μm. Bu, bulge. Dashed lines, HF-dermal border. For d-j, at least three biological replicates were used; representative images are shown. See also Source Data.
Extended Data Fig. 2
Extended Data Fig. 2. NFI-dKO Mice Exhibit Features of Primary Cicatricial Alopecia.
a, Immunofluorescence showing HF degeneration in NFI-dKO mice at 2 months post-TAM. YFP labels Sox9-CreER-targeted HFs. K6 labels inner bulge cells anchoring the hair. b, Immunofluorescence showing hyperkeratosis (K10) and follicular plugging of infundibulum in NFI-dKO HFs. K5 marks basal epithelial cells. c, Loss of PPARG, SCD1 and ADIPOPHILIN, lipid-related markers of mature sebocytes, in NFI-dKO follicles. Mean and standard deviation are shown. 30 HFs per genotype, pooled from n=3 mice. P value is from unpaired, two-tailed t-test. d, Hematoxylin & Eosin image of NFI-dKO skin at 2 months post-TAM. Note follicular remnants and fibrous tracts (arrows). e, Immunofluorescence and quantifications of active CASPASE3+ (apoptotic) cells in NFI-dKO HFs. Mean and standard deviation are shown. For 2 weeks data, n=80 HFs per genotype (total, pooled from 4 mice). For 2 months data, n=59 HFs (WT) or n=74 HFs (NFI-dKO), (total, pooled from 3 mice). P values are from unpaired, two-tailed t-test. f, (left) Flow cytometry analysis of immune cells at 2 months post-NFI deletion. Mean and standard deviation are shown. n=4 mice/genotype. P values are from unpaired, two-tailed t-test. (right) Immunofluorescence analysis of FOXP3+ regulatory T-cells (Tregs) around the HF bulge niche. g, Fluorescence in situ hybridization (FISH) of pan-bacterial 16S rRNA (rainbow colors) in cleared skin whole-mounts, co-labeled for DAPI (gray) at 2 months post-TAM. Spot analysis of 16S-FISH signal was used to quantify bacterial load per μm3 of skin. Mean and standard deviation are shown. n=10 (WT) and 16 (NFI-dKO) HFs from 2 biologically independent mice/genotype. Scale bars = 20μm, unless otherwise specified. Bu, bulge. Inf, Infundibulum. Dashed lines, HF-dermal border. For a-d and f, at least three biological replicates were used; representative images are shown. See also Source Data.
Extended Data Fig. 3
Extended Data Fig. 3. Skin Immune Cell Profiling by Flow Cytometry.
a, Flow cytometry gating strategy for adaptive immune cell profiling. b, Flow cytometry gating strategy for innate immune cell profiling. Plots are shown for a representative WT mouse analyzed at 2 months post-NFI ablation. See Methods for details on immune cell identification.
Extended Data Fig. 4
Extended Data Fig. 4. Absence of Skin Immune Infiltration at 2 weeks post-NFI loss.
a, Fluorescence in situ hybridization (FISH) of pan-bacterial 16S rRNA (rainbow colors) in cleared skin whole-mounts, co-labeled for DAPI (gray) at 2 weeks post gene knockout. Spot analysis of 16S-FISH signal was used to quantify cutaneous bacterial load. Representative images of two biological replicates. b, Immunofluorescence showing skin immune cells (CD45+) are not changed at 2 weeks following Nfib/Nfix knockout (mean and standard deviation are shown). K5 marks basal epithelial cells. n=3 mice. c, Flow cytometry analysis of immune cell composition at 2 weeks post-NFI deletion. Mean and standard deviation are shown. n=4 mice/genotype. d, mRNA expression (from RNA-seq) of immune-related genes in bulge-SCs at 2 weeks post-TAM. All scale bars = 20μm. Bu, bulge. Inf, Infundibulum. Dashed lines, HF-dermal border. See also Source Data.
Extended Data Fig. 5
Extended Data Fig. 5. Immunosuppression does not prevent bulge-SC loss in NFI-dKO mice.
All analyses in mice were done at 2 months post-NFI deletion. Dexamethasone (DEX) was administered continuously since gene deletion to evaluate the long-term effect of immunosuppression on bulge phenotypes. a, Immunofluorescence analysis of FOXP3+ regulatory T-cells (Tregs) around the HF bulge niche. K14 marks basal epithelial cells. b, Flow cytometry analysis of immune cell composition at 2 months post-NFI deletion. Mean and standard deviation are shown. n=3 WT mice in PBS and DEX groups, n=5 NFI-dKO mice in PBS group, n=4 NFI-dKO mice in DEX group. P-values are from unpaired, two-tailed t-test. c, Immunofluorescence analysis of phosphorylated (active) NF-kB in the HF bulge. INTEGRIN β4 (β4) marks basal epithelial cells. d, Images of WT and NFI-dKO mice with or without DEX. Note DEX led to hair coat retention in NFI-dKO mice. e, Immunosuppression fails to rescue ectopic epidermal differentiation (K10) in the NFI-dKO bulge. f, Analysis of human scalp biopsies. Immunohistochemistry shows reduced expression of NFIB and NFIX in scarring alopecia patients compared to normal human scalp skin. g, Immunohistochemical analysis of human scalp biopsies using anti-K14 antibody, a marker of outer root sheath (ORS, progenitor) cells, where NFIB and NFIX are normally expressed. All scale bars = 20μm, unless otherwise indicated. Bu, bulge. Inf, Infundibulum. Dashed lines, HF-dermal border. For a, c- g, at least three biological replicates were used; representative images are shown. See also Source Data.
Extended Data Fig. 6
Extended Data Fig. 6. Bulk Transcriptome Analysis of NFI-dKO bulge-SCs.
a, b, Volcano plots showing differential gene expression of WT vs. NFI-dKO (a) or WT vs. Nfix cKO (b) bulge-SCs. Note that Nfix ablation on its own has little effect on bulge-SC transcriptomes. n=23491 genes were analyzed/genotype. c, Overlap of WT vs. NFI-dKO gene expression changes and NFIB ChIP-occupancy to identify transcriptional targets sensitive to NFIB levels. All transcriptome analyses were performed on 2 mice/genotype. Statistical analysis was performed using unpaired, two-tailed t-test and corrected using the Benjamini and Hochberg method.
Extended Data Fig. 7
Extended Data Fig. 7. Single Cell Transcriptome Analysis of Telogen Skin Epidermis.
a, FACS-purification of 2nd telogen skin progenitors from Sox9-CreER/Nfixfl/fl/R26-YFP (non-phenotypic) vs. NFI-dKO mice. Hair follicles were YFP+ and INTEGRIN α6+, while epidermal SCs (EpdSCs) were YFPneg, INTEGRIN α6+ and SCA1+. Representative plots for three biological replicates. b, Validation of FACS-purification strategy for single cell RNA-seq analysis. tSNE plot showing low Sox9 expression in the YFPneg cluster (EpdSC), whereas all YFP+ populations are Sox9+ (HF). n=2 mice per group. c, Correlation plots of single-cell RNA-seq libraries shows minimal batch to batch variation. n=2 mice per group. Correlation coefficients were calculated by Pearson’s method. d, tSNE plots showing expression of known epidermal lineage markers to determine the identity of individual clusters. n=2 mice per group. e, tSNE plot showing the unique cluster in NFI-dKO mice is Cd34neg. n=2 mice per group.
Extended Data Fig. 8
Extended Data Fig. 8. NFI-TFs are Required to Maintain Bulge-SC Identity.
a, Replicate analysis of ATAC-seq experiments show correlation coefficients of >0.94, indicating good reproducibility. Correlation coefficients were calculated by Pearson’s method. b, Reduction of chromatin accessibility at bulge-SC TF-bound loci upon loss of NFI-TFs. Note loci co-occupied by NFIB and bulge-SC TFs show a greater decrease of chromatin accessibility. In boxplots, the median (line), first and third quartiles (box), and whiskers (highest and lowest values) are shown. TF bindings sites are based on prior in vivo ChIP-seq on bulge-SCs,–,,. ATAC-seq (this study) was used to determine differential accessibility at bulge-SC TF ChIP-bound loci. Statistics was analyzed using unpaired, two-tailed t-test. Number of peaks analyzed: SOX9: n=1813 (NFIB-bound), n=1175 (no NFIB binding); LHX2: n=1363 (NFIB-bound), n=1453 (no NFIB binding); NFATc1: n=1503 (NFIB-bound), n=4199 (no NFIB binding); pSMAD1: n=1547 (NFIB-bound), n=1778 (no NFIB binding); TCF3: n=7840 (NFIB-bound), n=7668 (no NFIB binding); TCF4: n=5346 (NFIB-bound), n=4371 (no NFIB binding); TLE: n=2901 (NFIB-bound), n=2840 (no NFIB-binding); bulge SE H3K27ac: n=970 (NFIB-bound), and n=2017 (no NFIB binding). c, Comparison of bulge-SC-TF ChIP-peaks reveals high co-occupancy with NFIB. d, Differential chromatin accessibility at NFIB ChIP-occupied super-enhancers in WT vs. Nfib/Nfix-dKO bulge-SCs (measured by ATAC-seq). e, Immunofluorescence analysis shows gradual reduction in bulge-SC marker LHX2 over time. Scale bars = 20μm. Bu, bulge. Dashed lines, HF-dermal border. Representative images for three biological replicates. f, Replicate analysis of 2 independent ChIP-seq experiments show correlation coefficients (r) of >0.94, indicating good reproducibility. Number of peaks analyzed: H3K4me1: n=128538 (WT), n=119965 (NFI-dKO); H3K27ac: n=65493 (WT), and n=82522 (NFI-dKO). Correlation coefficients were calculated by Pearson’s method. g, Heatmap of H3K4me1, H3K27ac and H3K27me3 ChIP-seq read densities centered on NFIB-bound peaks, depicting how they change with NFI status in bulge-SC chromatin. Note that Nfib/Nfix ablation associates with reduced H3K4me1 and H2K27ac but not H3K27me3 at NFIB-bound loci. See also Source Data.
Extended Data Fig. 9
Extended Data Fig. 9. Model of NFIB and NFIX Function in the HF SC Niche.
Although our studies focused on using Sox9-CreER mice to ablate NFI proteins in the HF, we also show that LV-CreER ablation of NFI proteins in the epidermis does not affect its SCs or its differentiation program. Rather, NFIB and NFIX act on the bulge-SCs and without them, a primary scarring alopecia phenotype is generated. At the chromatin level, NFI proteins act in the bulge-SC niche to maintain chromatin accessibility of bulge-SC super-enhancers while repressing epidermal enhancers. When NFI proteins are absent, many bulge-SC super-enhancers are silenced while some epidermal enhancers become ectopically activated, leading to a lineage infidelity state.
Fig. 1 |
Fig. 1 |. Nfib and Nfix Redundantly Govern Bulge-SC Maintenance.
a, Schematic depicting the HF during quiescence (telogen) and relevant progenitor populations. b, Venn diagram showing enrichment of NFIB ChIP-seq peaks within bulge-SC super-enhancers (SEs) compared with typical enhancers (TEs). c, In vivo ATAC-seq and NFIB ChIP-seq tracks of the bulge-SC TF gene Nfib and its associated active super-enhancers marked by H3K27ac. Red bars denote location of super-enhancers. Exon/intron structure shown at bottom, with arrowheads indicating direction of transcription. d, NFIB immunofluorescence in 2nd telogen HFs. Newest bulge is always associated with the underlying dermal papilla, DAPI-stained. Representative image of three biological replicates. e, Gene expression (RNA-seq) profiles of NFI family members in skin epithelial progenitors. f, NFIX immunofluorescence in 2nd telogen HFs. Relative to NFIB, NFIX exhibits broader expression among skin epithelial progenitors. Representative image of three biological replicates. g, In vivo ATAC-seq and NFIB ChIP-seq tracks of the bulge-SC TF gene Nfix and its associated active super-enhancers marked by H3K27ac. Red bars denote location of super-enhancers. h, Strategy for inducible knockout of Nfib ± Nfix selectively in HFs. i, Images of NFI-dKO mice at 2wks and 2mo following targeting. Representative images of five biological replicates. j, Immunofluorescence comparing bulge-SC marker expression in telogen HFs of WT, Nfib cKO, Nfix cKO and Nfib/Nfix-dKO mice. Arrows point to decline of CD34+ bulge-SCs only in double Nfib/Nfix targeted (dKO) mice. Mean and standard deviation are shown (3–5 HFs analyzed/mouse). P values from one-way ANOVA (2 weeks timepoints; n = 3 mice) or unpaired two-tailed t-test (2 months timepoint; n = 3 mice). Asterisk denotes autofluorescence of hair shafts. All scale bars = 20μm. Bu, bulge. SG, Sebaceous gland. Inf, Infundibulum. Isth, Isthmus. Epi, Epidermis. Dashed lines, HF-dermal border. See also Source Data.
Fig. 2 |
Fig. 2 |. NFI-Deficiency Leads to a Phenotype Resembling Primary Cicatricial (Scarring) Alopecia.
a, b, Hematoxylin & Eosin images of Nfib/Nfix-dKO skin at 2 months post-TAM (a) reveals similarities to human primary cicatricial alopecia (PCA) (b). Representative images of three biological replicates. c, Immunofluorescence and quantifications reveal infiltration of immune cells (CD45+) around the HFSC niche at 2 months post ablation of Nfib/Nfix relative to control. YFP labels Sox9-CreER-targeted HFs. Mean and standard deviation are shown. P value is from unpaired, two-tailed t-test based on n=69 WT HFs and n=41 NFI-dKO HFs (total, pooled from 3 mice). d, Experimental design, immunofluorescence and quantifications comparing 2nd telogen HFs of WT and NFI-dKO mice at 2 months post-TAM ± immunosuppression by dexamethasone (DEX). Note that DEX fails to prevent decline of CD34+ bulge-SCs in NFI-dKOs. DEX-treated NFI-dKO HFs were also shorter compared to DEX-treated WT HFs. These features were consistent with stem cell exhaustion. Mean and standard deviation are shown (3–6 HFs analyzed/mouse for CD34 quantifications, and 6–9 HFs analyzed/mouse for HF length measurements). P values comparing WT (n=3 mice) vs. dKO (n=4 mice) are from unpaired, two-tailed t-test. e, Immunohistochemistry of representative human scalp biopsies shows reduced expression of NFIB and NFIX in PCA compared to normal skin. ORS, outer root sheath. (right) Quantifications for 17 normal and 25 PCA replicates. Scale bars = 20μm, unless otherwise specified. Bu, bulge. Inf, Infundibulum. Dashed lines, HF-dermal border. Asterisk denotes autofluorescence. See also Source Data.
Fig. 3 |
Fig. 3 |. Loss of Nfib and Nfix Alters Bulge-SC Identity.
a, Heatmap of mRNAs differentially expressed between FACS-purified CD34+/INTEGRIN α6+/ YFP+/SCA1neg bulge-SCs from WT and NFI-dKO mice, 2 weeks post-TAM. Duplicate datasets from 2 mice are shown. padj<0.01, p values were calculated from unpaired, two-tailed t-test and corrected using the Benjamini and Hochberg method. n=23491 genes were analyzed/genotype. Fold-changes in parentheses. Asterisks denote direct NFIB transcriptional targets. Note that Cd34 levels (green) were comparable in the two cohorts purified and analyzed. b, (left) Single cell RNA-seq analyses of INTEGRIN α6+/YFP+ skin progenitors. Unbiased clustering of transcriptomes of individual basal progenitors from control (Sox9-CreER;Nfixfl/fl;R26-YFP) telogen skin. Each cell is represented as a dot, colored by a clustering algorithm and plotted on the tSNE graph. (right) tSNE analysis of 2 batches of single-cell RNA-seq libraries shows minimal batch to batch variation (2 mice). c, Overlap of transcriptomes of control and Nfib/Nfix-deficient HF progenitors (2 mice). Note the emergence of a new cluster, not seen in control HF progenitors. d, Quantifications of progenitors per cluster in control vs. Nfib/Nfix-deficient HFs. Note that among the progenitor pools of Nfib/Nfix-dKO HFs, in addition to the unique cluster, there is also a relative loss of bulge-SCs with more cells exhibiting features of upper bulge cells and more committed, lineage-primed hair germ cells.
Fig. 4 |
Fig. 4 |. NFI-TFs Maintain Bulge-SC Chromatin Landscapes.
a, ATAC-seq of chromatin isolated from FACS-purified WT or NFI-dKO bulge-SCs, analyzed at 2 weeks post-TAM. 2 independent experiments. b, TF-motif analysis of chromatin uniquely accessible in WT bulge-SCs (lost in NFI-dKO) reveals enrichment of motifs for bulge-SC identity TFs. P-values calculated by analyzing n=8190 WT-unique ATAC peaks (hypergeometric distribution analysis). c, NFIB ChIP-seq and ATAC-seq tracks of bulge-SC TF gene Lhx2 and its super-enhancer (black bar) in NFI-dKO and control bulge-SCs. d, (left), Differential chromatin accessibility at NFIB ChIP-occupied loci in WT vs. NFI-dKO bulge-SCs. (right), Upon NFI-ablation, NFIB-bound loci exhibit a greater reduction in chromatin accessibility than the genome as a whole. The median (line), first and third quartiles (box), and whiskers (highest and lowest values) are shown. N=86681 (all) and n=12279 NFIB-bound ATAC peaks were analyzed. e, Differential chromatin accessibility (ATAC-seq) and levels of histone modifications (ChIP-seq) at total and NFIB ChIP-occupied enhancers in WT vs. NFI-dKO bulge-SCs. Super-enhancers (SE) and typical enhancers (TE) for bulge-SCs were previously defined. The median (line), first and third quartiles (box), and whiskers (highest and lowest values) are shown. Number of peaks analyzed: ATAC: n=2145 (SE), n=17244 (TE), n=779 (NFIB-bound-SE), n=4940 (NFIB-bound-TE); H3K4me1: n=3238 (SE), n=20857 (TE), n=961 (NFIB-bound-SE), n=5181 (NFIB-bound-TE); H3K27ac: n=3237 (SE), n=20884 (TE), n=961 (NFIB-bound-SE), and n=5191 (NFIB-bound-TE). f, H3K27ac super-enhancer landscapes in WT and NFI-dKO bulge-SCs. g, (left) NFI-dependent gene expression changes (RNA-seq) depending upon accessible chromatin and NFIB ChIP-occupancy. N=22860 (all), n=2480 (NFIB-bound ATAC-peaks decreased in NFI-dKO), n=51 genes (NFIB-bound ATAC-peaks increased in NFI-dKO). (right) Boxplots comparing the relative impact of NFI-status on gene expression (regulated by SEs or TEs) in bulge-SCs. N=300 SE genes and n=10515 TE genes. In boxplots (left and right), the median (line), first and third quartiles (box), and whiskers (highest and lowest values) are shown. h, Differential chromatin accessibility at identity genes in WT vs. NFI-dKO bulge-SCs or transit-amplifying cells (TACs). The median (line), first and third quartiles (box), and whiskers (highest and lowest values) are shown. N=2987 Bulge-SE ATAC peaks and n=2954 TAC-SE ATAC peaks. Unpaired two-tailed t-test used for all analyses.
Fig. 5 |
Fig. 5 |. NFI-Deficiency Leads to Lineage Infidelity in Bulge-SCs.
a, Motif analysis identifies enriched TF motifs associated with bulge-SC ATAC-peaks that were gained within two weeks of Nfib/Nfix ablation. Note that these de novo peaks harbor motifs for TFs that are activated in normal EpdSCs and by bulge-SCs exposed to wound/stress situations. P-values were calculated by comparing n=9202 NFI-dKO unique ATAC peaks to random background sequences (hypergeometric distribution analysis). b, ATAC tracks reveal enhanced chromatin accessibility within Klf5 regulatory regions in Nfib/Nfix-dKO compared to control bulge-SCs. Note similarities between Nfib/Nfix-dKO bulge-SC Klf5 ATAC profiles and those of wounded WT bulge and WT EpdSCs. c, Immunofluorescence (left) reveals induced co-expression of SOX9 and KLF5 (arrows) within 2 weeks of Nfib/Nfix ablation is even more prominent at 2 months, suggestive of chronic lineage infidelity. (right) tSNE plots showing Sox9/Klf5 co-expression in the unique population of NFI-dKO progenitors that began to emerge early after Nfib/x targeting. Single cell analysis from 2 biologically independent mice per group. d, Expression levels of bulge-SC, EpdSC and stress-related genes among the two weeks CD34+ bulge-SC populations of NFI-dKO and WT skins, as well as the CD34neg de novo NFI-dKO progenitor population. Note similar but more pronounced changes in the CD34neg de novo NFI-dKO progenitors, which our combined analyses indicate is a more advanced state of bulge-SCs following NFI loss. All scale bars = 20μm. Bu, bulge. Dashed lines, HF-dermal border.
Fig. 6 |
Fig. 6 |. NFI-TF Dynamics Play an Essential Role During Wound-Repair.
a, Dermabrasion selectively removes EpdSCs while leaving behind bulge bulge-SCs. This mobilizes bulge-SCs to re-epithelialize the epidermis. Mobilized bulge-SCs co-express epidermal (KLF5) and follicular (SOX9) TFs throughout the repair process. b, Transient suppression of Nfib and Nfix in mobilized bulge-SCs during wound-repair. c, Following dermabrasion wounding, stimulated WT bulge-SCs that do not participate in re-epithelialization of the epidermis will launch a new hair cycle. Without NFI TFs, this does not happen, and instead the wounded skin shows epidermal hyperthickening. (right) Quantifications of interfollicular distances, which also widen, reflective of global HF degeneration in NFI-dKO skin. Mean and standard deviation are shown. P-value was calculated from unpaired, two-tailed t-test based on n=74 WT HFs and n=37 NFI-dKO HFs. d, In utero delivery of LV-CreER for inducible ablation of Nfib/Nfix in the adult epidermis does not impair EpdSCs or their ability to maintain homeostasis. K5 marks basal epithelial cells. K10 labels differentiating cells. LORICRIN and INVOLUCRIN are markers of terminal epidermal differentiation. Representative images of three biological replicates are shown in a, b, c, d. Scale bars = 20μm, unless otherwise specified. Bu, bulge. Dashed lines, HF-dermal border. See also Source Data.

Similar articles

Cited by

References

    1. Avgustinova A, and Benitah SA Epigenetic control of adult stem cell function. Nat Rev Mol Cell Biol. 17, 643–658 (2016). - PubMed
    1. Scadden DT Nice neighborhood: emerging concepts of the stem cell niche. Cell 157, 41–50 (2014). - PMC - PubMed
    1. Gonzales KAU, and Fuchs E Skin and Its Regenerative Powers: An Alliance between Stem Cells and Their Niche. Dev. Cell 43, 387–401 (2017). - PMC - PubMed
    1. Paksa A, and Rajagopal J The epigenetic basis of cellular plasticity. Curr Opin Cell Biol. 49, 116–122 (2017). - PMC - PubMed
    1. Arwert EN, Hoste E, and Watt FM Epithelial stem cells, wound healing and cancer. Nat. Rev. Cancer 12, 170–180 (2012). - PubMed

Publication types