. 2020 Jul;16(7):731-739.
doi: 10.1038/s41589-020-0533-x. Epub 2020 May 11.

A small molecule G6PD inhibitor reveals immune dependence on pentose phosphate pathway

Affiliations

A small molecule G6PD inhibitor reveals immune dependence on pentose phosphate pathway

Jonathan M Ghergurovich et al. Nat Chem Biol. 2020 Jul.

Abstract

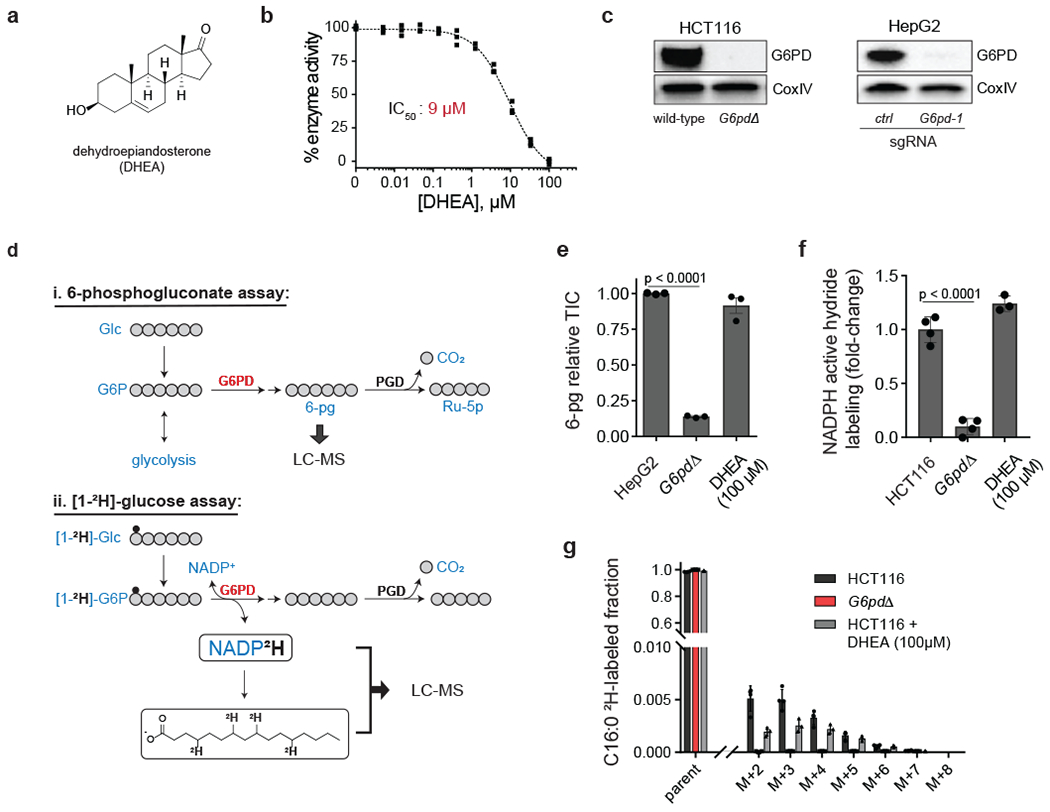
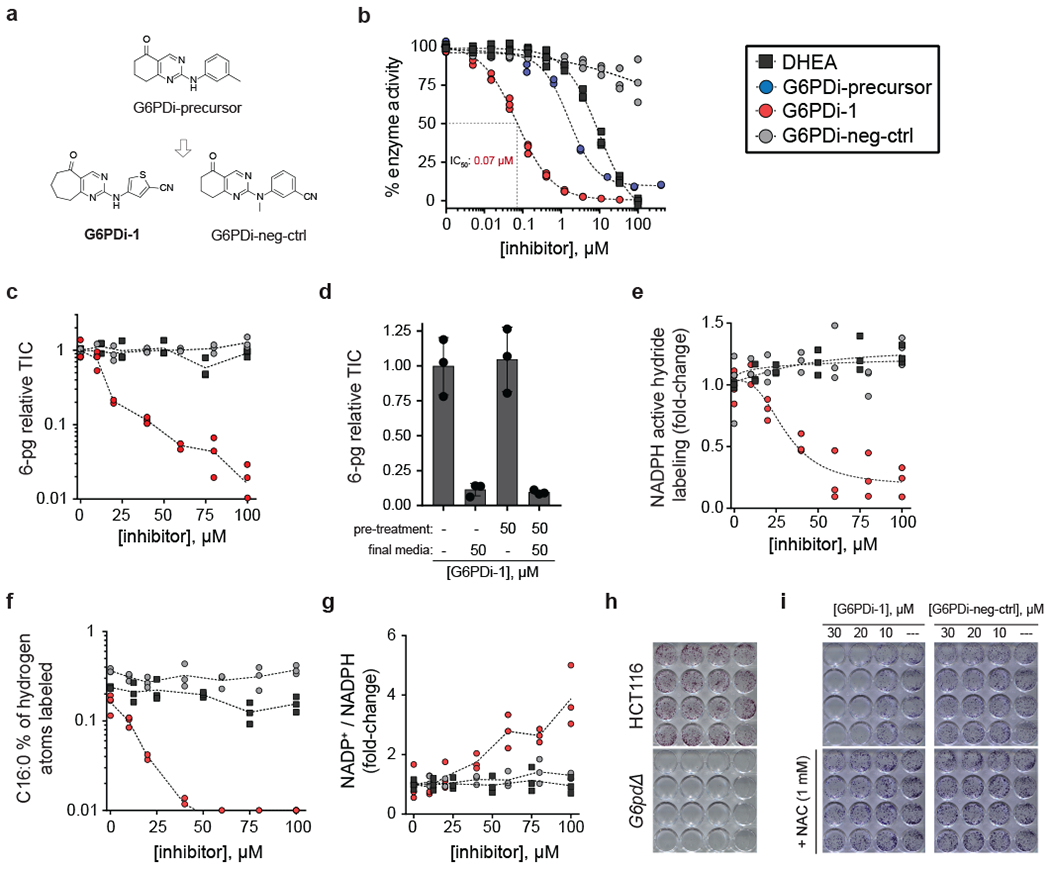
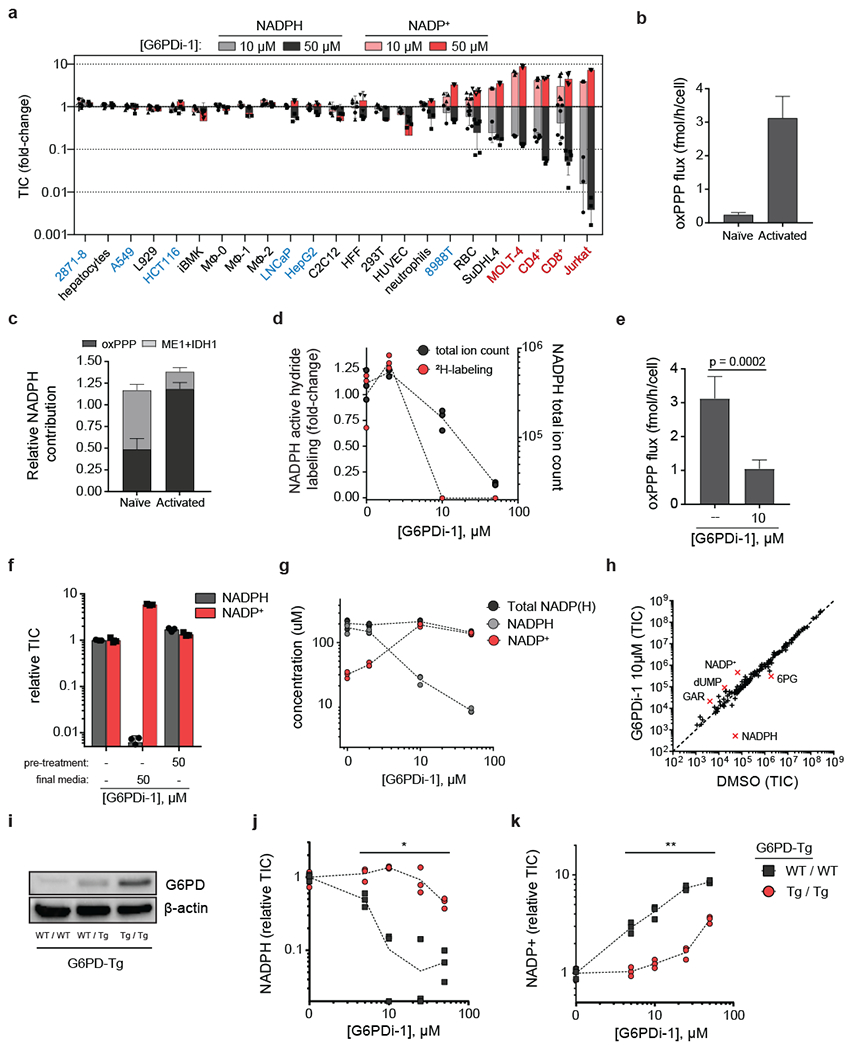
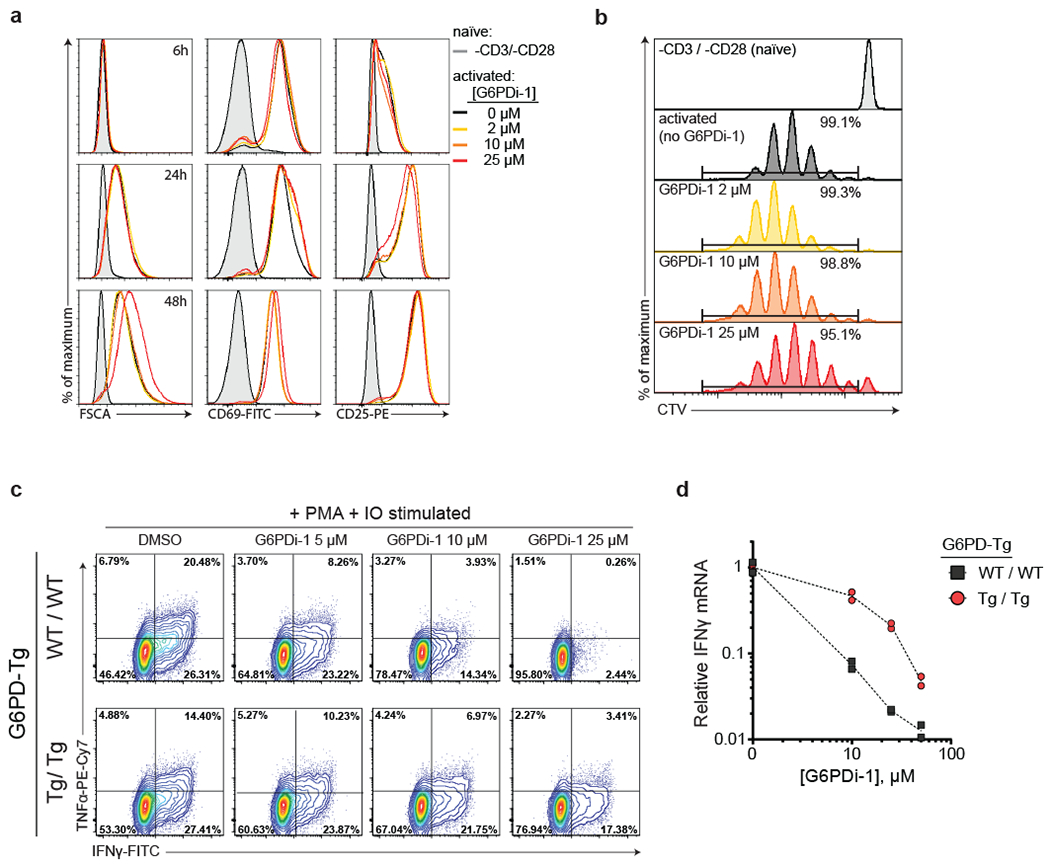
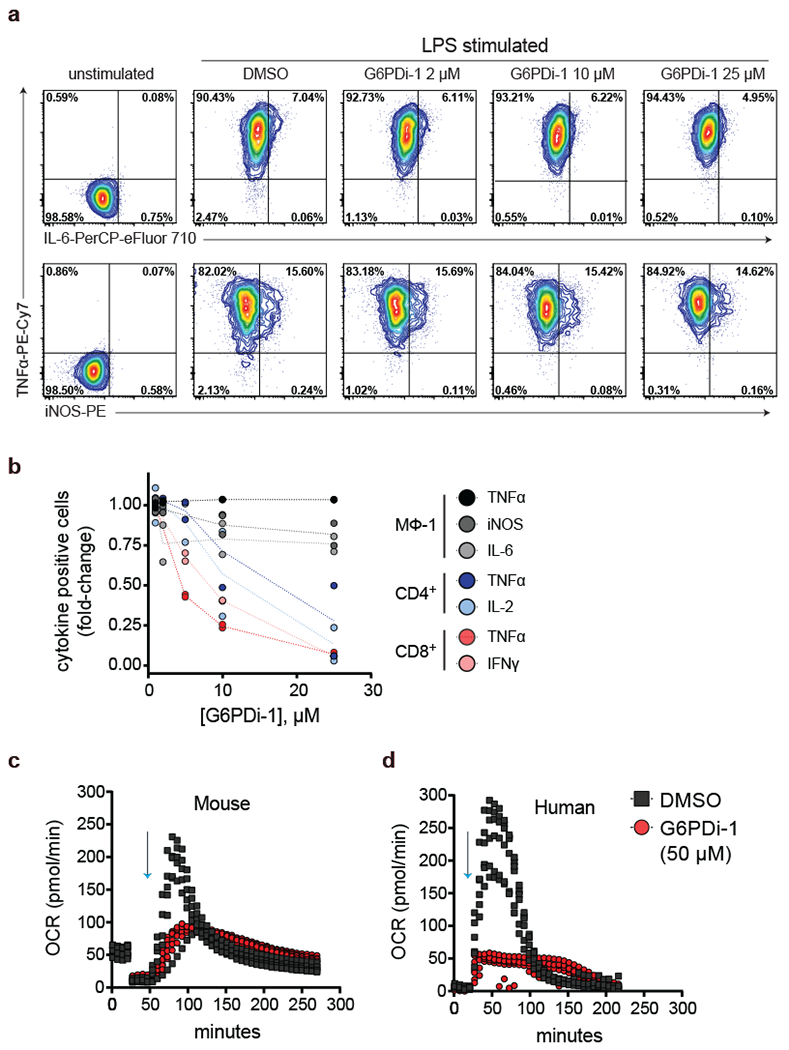
Glucose is catabolized by two fundamental pathways, glycolysis to make ATP and the oxidative pentose phosphate pathway to make reduced nicotinamide adenine dinucleotide phosphate (NADPH). The first step of the oxidative pentose phosphate pathway is catalyzed by the enzyme glucose-6-phosphate dehydrogenase (G6PD). Here we develop metabolite reporter and deuterium tracer assays to monitor cellular G6PD activity. Using these, we show that the most widely cited G6PD antagonist, dehydroepiandosterone, does not robustly inhibit G6PD in cells. We then identify a small molecule (G6PDi-1) that more effectively inhibits G6PD. Across a range of cultured cells, G6PDi-1 depletes NADPH most strongly in lymphocytes. In T cells but not macrophages, G6PDi-1 markedly decreases inflammatory cytokine production. In neutrophils, it suppresses respiratory burst. Thus, we provide a cell-active small molecule tool for oxidative pentose phosphate pathway inhibition, and use it to identify G6PD as a pharmacological target for modulating immune response.


Conflict of interest statement

Competing interests

Princeton University has filed a patent relating to the novel G6PD inhibitors and their uses. J.D.R. is a co-founder of Raze Therapeutics, advisor and stock owner in Kadmon, Agios, C.R.P., LEAF, and Bantam Pharmaceuticals and consultant to Pfizer. No competing interests were disclosed by the other authors.

Figures

Figure 1.
Figure 1.. Cellular target engagement assays reveal lack of effective G6PD inhibition by DHEA.
a, Chemical structure of the steroid derivative dehydroepiandosterone (DHEA). b, In vitro activity of DHEA against recombinant human G6PD (mean ± SD, n = 3). c, Western blots of G6PD knockout cells generated using CRISPR-Cas9 (HCT116 knockout is clonal; HepG2 is batch; “ctrl” represents an intergenic control). See Supplementary Figure 16 for uncropped gels. Representative results of 2 independent experiments. d, Assays for G6PD cellular activity: (i) 6-phosphogluconate (6-pg) levels in HepG2 cells, (ii) deuterium (2H, small black circle) incorporation into NADPH (active hydride) and free palmitic acid from [1-2H]-glucose in HCT116 cells. e, f, g, DHEA (100 μM, 2 h) does not phenocopy G6PD knockout (TIC, total ion count by LC-MS) (mean ± SD, n = 3). p value calculated using a two-tailed unpaired Student’s t-test.
Figure 2.
Figure 2.. A non-steroidal, cell active inhibitor of G6PD.
a, Chemical structures. b, In vitro dose response curves (n = 3). c, 6-pg dose response curves (HepG2 cells) (n = 3). d, Reversibility of the cellular activity of G6PDi-1. HepG2 cells were pre-treated with indicated media for two hours, followed by incubation with final media for two hours (mean ± SD, n = 3). e, NADPH active hydride 2H-labeling dose response curves (HCT116 cells, [1-2H]-glucose tracer) n = 3). f, Free palmitic acid 2H-labeling dose response curves (HCT116 cells, [1-2H]-glucose tracer) (n = 3). g, NADP+/NADPH ratio dose response curves (HCT116 cells) (n = 3). h, Representative crystal violet staining of colonies formed from HCT116 and G6PD knockout cells. i, Colony formation of HCT116 cells treated with increasing doses of G6PDi-1 and G6PDi-neg-ctrl. Representative results of 3 independent experiments. NAC = N-acetylcysteine.
Figure 3.
Figure 3.. G6PDi-1 reveals T cells depend on oxPPP for maintaining cellular NADPH.
a, LC-MS quantification of NADPH and NADP+ pools across a variety of normal and transformed cell types in response to G6PDi-1 (mean ± SD, n = 6 for RBC, CD4+ and CD8+ T cells, n=3 for the rest of cells). TIC = total ion count. Cell names in red are T cell lineage, blue are cell lines derived from solid tumors. Abbreviations: 2871–8 = lung adenocarcinoma (mouse); A549 = lung adenocarcinoma (human); L929 = fibroblast (mouse); HCT116 = colorectal carcinoma (human); iBMK = immortalized baby kidney epithelial (mouse); MΦ = mouse bone-marrow derived macrophages: unstimulated (MΦ−0), stimulated with LPS+IFNγ (MΦ −1), stimulated with IL4 (MΦ −2); LNCaP = prostate adenocarcinoma (human); HepG2 = hepatocellular carcinoma (human); C2C12 = immortalized myoblasts (mouse); HFF = fibroblasts (human); 293T = immortalized embryonic kidney epithelial (human); HUVEC = umbilical vein endothelial (human); 8988T = pancreatic adenocarcinoma (human); RBC = red blood cells (mouse); SuDHL4 = B cell lympohoma (human); MOLT-4 = T cell acute lymphoblastic leukemia (human); CD4+ and CD8+ = active primary T cells (mouse); Jurkat = immortalized T lymphocyte (human). b, Total oxPPP flux as determined by 14CO2 emission in naïve mouse CD8+ T cells (unstimulated and cultured with IL-7) and activated mouse CD8+ T cells (day 4 post plate-bound αCD3/αCD28 stimulation and cultured with IL-2) (mean ± SD, n = 2 for naïve, n = 5 for active). c, Fraction cellular NADPH from the oxPPP, malic enzyme 1 (ME1) and isocitrate dehydrogenase (IDH1) in naïve and activated CD8+ T cells (mean ± SD, n = 3) (for tracers, see Supplementary figure10b–c). d, NADPH concentration and active hydride 2H-labeling dose response to G6PDi-1 after 2 h ([1-2H]-glucose tracer) (n = 3). e, G6PDi-1 blocks oxPPP flux as determined by 14CO2 emission (mean ± SD, n = 5). p value calculated using a two-tailed Student’s t-test. f, NADP+/NADPH shift in response to G6PDi-1 is rapidly reversible. Active CD8+ T cells were pre-treated with indicated media for 2 h, followed by incubation with final media for 2 h (mean ± SD, n = 3). (G) Absolute NADPH and NADP+ pools after G6PDi-1 (2 h) (n = 3). h, Water-soluble metabolite in active CD8+ T cells treated with G6PDi-1 (2 h) (mean, n = 3). Metabolites displaying a fold-change > 4 are highlighted in red. i, Western blots of G6PD (combined endogenous and transgenic) in active CD8+ T cells from G6pd overexpressing mice (G6PD-Tg mice). “WT / WT” = wild-type mice (no G6pd transgene expression); “WT / Tg” = heterozygous expression; “Tg / Tg” = homozygous expression. See Supplementary Figure 16 for uncropped gels. Representative results of 2 independent experiments. j-k, Dose response to G6PDi-1 of NADPH (j)and NADP+ (k) in active CD8+ T cells from wild-type or G6pd overexpressing mice (n = 3). * and ** denote significant differences between WT/WT and Tg/Tg mice at each of the tested doses using a a two-tailed unpaired Student’s t-test. The following p values were obtained for NADPH levels: 5 μM, p = 0.011, 10 μM, p < 0.0001, 25 μM, p = 0.019, 50 μM, p = 0.0010. The following p values were obtained for NADP+ levels: 5 μM, p = 0.0011, 10 μM, p = 0.0012, 25 μM, p < 0.0001, 50 μM, p = < 0.0001.
Figure 4.
Figure 4.. G6PDi-1 suppresses T cell cytokine production while having a minimal effect on initial activation or proliferation
a, Flow cytometry analysis of cell size (FSCA) and activation markers (CD69 and CD25) of mouse naïve CD8+ T cells either rested in naïve state or stimulated by CD3/CD28 + IL-2 in the presence of increasing concentrations of G6PDi-1. Representative results of 2 independent experiments. b, Proliferation of CD8+ T cells either rested in naïve state or stimulated by CD3/CD28 + IL-2 in the presence of increasing concentrations of G6PDi-1 at day 4 post-activation based on Cell Trace Violet (CTV) dilution. Representative results of 2 independent experiments. c, Intracellular cytokines in active CD8+ T cells from wild-type or G6pd overexpressing mice after a 6 h stimulation with PMA and IO in the presence of the indicated dose of G6PDi-1.(c-d) Representative results of 2 independent experiments. d, Corresponding Ifng mRNA in active CD8+ T cells from wild-type or G6pd overexpression mice (normalized to Gapdh expression and no G6PDi-1 control) (n = 2).
Figure 5.
Figure 5.. G6PDi-1 suppresses neutrophil oxidative burst
a, Intracellular cytokines in bone marrow derived macrophages after a 6 h stimulation with LPS and IFNγ in the presence of the indicated dose of G6PDi-1. Representative results of 2 independent experiments. b, Cytokine effects of G6PDi-1 across cell types (n = 2). c-d, Neutrophil oxidative burst as measured by the Seahorse Extracellular Flux Analyzer. Oxygen consumption rate (OCR) was monitored in mouse (c) and human (d) neutrophils that were activated with PMA (100 nM, indicated by blue arrows) in the presence of 50 μM G6PDi-1 or vehicle control (n = 6).

Comment in

References

    1. Voet D, Voet JG & Pratt CW Fundamentals of biochemistry: life at the molecular level. (2016).
    1. Stanton RC Glucose-6-Phosphate Dehydrogenase, NADPH, and Cell Survival. IUBMB life 64, 362–369, doi:10.1002/iub.1017 (2012). - DOI - PMC - PubMed
    1. Uhlen M et al. Proteomics. Tissue-based map of the human proteome. Science (New York, N.Y.) 347, 1260419, doi:10.1126/science.1260419 (2015). - DOI - PubMed
    1. Kowalik MA, Columbano A & Perra A Emerging Role of the Pentose Phosphate Pathway in Hepatocellular Carcinoma. Frontiers in Oncology 7, doi:10.3389/fonc.2017.00087 (2017). - DOI - PMC - PubMed
    1. Zhang Q et al. Overexpression of G6PD Represents a Potential Prognostic Factor in Clear Cell Renal Cell Carcinoma. Journal of Cancer 8, 665–673, doi:10.7150/jca.16858 (2017). - DOI - PMC - PubMed

Publication types

MeSH terms