Review
. 2020 Sep;472(9):1249-1272.
doi: 10.1007/s00424-020-02383-4. Epub 2020 May 12.

Glucose transporters in pancreatic islets

Affiliations
Review

Glucose transporters in pancreatic islets

Constantin Berger et al. Pflugers Arch. 2020 Sep.

Abstract

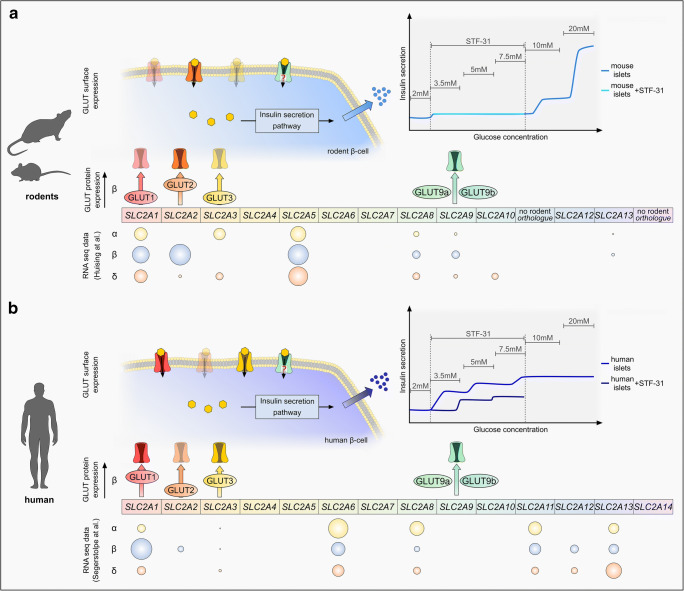
The fine-tuning of glucose uptake mechanisms is rendered by various glucose transporters with distinct transport characteristics. In the pancreatic islet, facilitative diffusion glucose transporters (GLUTs), and sodium-glucose cotransporters (SGLTs) contribute to glucose uptake and represent important components in the glucose-stimulated hormone release from endocrine cells, therefore playing a crucial role in blood glucose homeostasis. This review summarizes the current knowledge about cell type-specific expression profiles as well as proven and putative functions of distinct GLUT and SGLT family members in the human and rodent pancreatic islet and further discusses their possible involvement in onset and progression of diabetes mellitus. In context of GLUTs, we focus on GLUT2, characterizing the main glucose transporter in insulin-secreting β-cells in rodents. In addition, we discuss recent data proposing that other GLUT family members, namely GLUT1 and GLUT3, render this task in humans. Finally, we summarize latest information about SGLT1 and SGLT2 as representatives of the SGLT family that have been reported to be expressed predominantly in the α-cell population with a suggested functional role in the regulation of glucagon release.

Keywords: GLUTs; Glucose transport; Pancreatic islet; SGLTs; α-Cell; β-Cell.


Conflict of interest statement

The authors declare that they have no conflicts of interest.

Figures

Fig. 1
Fig. 1
Physiology of the human and rodent β- and α-cell. a Insulin secretion from β-cells (blue) is triggered at high glucose concentrations. Glucose enters the cell mainly via GLUTs. The contribution of SGLT to glucose uptake in β-cells is not yet confirmed. Intracellularly, glucose is phosphorylated by the glucokinase and converted to pyruvate during glycolysis. Pyruvate enters the mitochondria where it is metabolized in the Krebs cycle, resulting in the generation of ATP. Elevation in the ATP/ADP ratio induces the closure of ATP-sensitive potassium channels (KATP) leading to the depolarization of the cell membrane. Opening of voltage-gated sodium channels (VGSC) causes a further depolarization by the influx of sodium ions (Na+) causing an influx of calcium ions (Ca2+) via voltage-gated calcium channels (VGGC). Elevation of the intracellular Ca2+-concentration [Ca2+]i triggers the exocytosis of insulin-filled vesicles by which insulin is released. Insulin secretion is mediated by the triggering pathway, which includes the rapid increase of [Ca2+]i resulting in a fast insulin response, as well as by the metabolic amplifying pathway that generates a second, continous release of insulin. Glucagon secretion from α-cells is less well understood. Of the several theories, which are currently discussed, one possible mechanism is illustrated in the displayed α-cell (yellow). According to this idea, α-cells share many features of the β-cells including uptake glucose via GLUTs and presumably SGLT1. Contrary to β-cells, KATPs are thought to close already at a low ATP/ADP ratio resulting in glucagon secretion, whereas a further increase of intracellular ATP induces the closure of VGSCs and VGGCs, thereby inhibiting glucagon release. Insulin and glucagon have opposing effects on peripheral cells and mediate signals for a reduction or rise of plasma glucose levels. b Analysis of glucose transport of human and rat β- and rat α-cells measured by the uptake of 3-O-Methyl-d-glucose (3-OMG).  In the rat β-cell (left) glucose uptake via specific glucose carriers (orange) is faster than the subsequent glucose phosphorylation by glucokinase. The activation of the triggering pathway as well as the metabolic amplifying pathway results in a biphasic insulin secretion in response to a rapid increase of glucose concentrations. Human β-cells (middle) exhibit a different subset of glucose transporters (yellow) that presumably results in a slower glucose uptake and a smaller gap between glucose uptake and usage compared to rat β-cells. Glucose uptake rate in rat α-cells (right) is comparable to human β-cells and similarly mediated by a specific subset of glucose transporters (red). Glucose-stimulated glucagon secretion decreases at high glucose concentration
Fig. 2
Fig. 2
Comparison of GLUT mRNA and protein expression in rodent and human islet cells. a Overview of Slc2 gene and proposed GLUT protein expression in rodents. RNA seq data: gene expression of murine Slc2 genes was determined by analyzing RNA sequencing data of murine FACS-sorted α-, β-, and δ-cells published by DiGruccio et al. [25]. Gene expression is shown as spheres representing the natural log of the normalized expression values (ln(RPKM)). Sphere size corresponds to the mRNA abundance of each gene normalized to the highest value of the analyzed dataset. GLUT protein expression: schematic representation of documented GLUT protein expression in murine β-cells. The position of the GLUTs along the arrow indicates the protein abundance estimated according to published studies. GLUT surface expression: schematic illustration of the proposed GLUT expression pattern in rodent β-cells, suggesting GLUT2 (orange) to cover a dominant role in glucose transport in comparison to GLUT1 (translucent red) and GLUT3 (translucent yellow). The contribution of GLUT9a and GLUT9b (green) remains speculative. Insulin release: Scheme of GSIS demonstrating the responsiveness of mouse islets to different glucose concentration. Mouse islets show an increased insulin secretion at high glucose concentration and show no reaction upon the addition of the selective GLUT1 inhibitor STF-31 [114]. b Overview of SLC2 expression and proposed GLUT protein expression in humans. RNA seq data: gene expression of human SLC2 genes was determined by analyzing single cell RNA sequencing data of human α-, β- and δ-cells published by Segerstolpe et al. [133]. (see also http://sandberg.cmb.ki.se/pancreas/). Spheres represent gene expression determined by the natural log of the normalized expression values (ln(RPKM)). Sphere size reflects the mRNA abundance of each gene normalized to the highest value of the analyzed dataset. GLUT protein expression: illustration of documented GLUT expression in the human β-cell. The position of the GLUTs along the arrow indicates the protein abundance estimated according to published studies. GLUT surface expression: schematic illustration of the proposed GLUT pattern contributing to glucose transport in human β-cells comprising mostly GLUT1 (red) and GLUT3 (yellow) as well as to a less extent GLUT2 (translucent orange). The contribution of GLUT9a and GLUT9b (green) is not proven. Insulin release: scheme of GSIS of human islets demonstrating a different responsiveness of human islets to increasing glucose levels compared to murine islets according to a study by Pingitore et al. [114]. Human islets react to the transient application of the selective GLUT1 inhibitor STF-31 with a reduced amplitude in insulin release
Fig. 3
Fig. 3
Trancriptional and poststrancriptional regulation of GLUT2 in mouse β-cells under normal and altered metabolic circumstances. a Overview of transcription factors with known regulatory function on Slc2a2 gene expression in mouse β-cells and their corresponding binding sites within the Slc2a2 promoter. In addition, factors that indirecrtly regulate Slc2a2 expression by altering the transcriptional activity of PDX1 are shown. b Summary of factors and pathways affecting GLUT2 regulation and function in a normal metabolic environment (green background) and under altered metabolic conditions (red background). According to a proposed model by Ohtsubo et al. [100, 101], high amounts of free fatty acids lead to the nuclear exclusion of the transcription factors FOXA2 and HNF1a, resulting in a decreased expression of Slc2a2 and Mgat4a, encoding the glycosyltransferase Gnt-4a. Consequently, N-glyocosylation of GLUT2 is impaired preventing the binding of lectin-receptors and the stabilization of GLUT2 at the cell surface. Non-glycosylated GLUT2 is increasingly found in endo- and lysosomes, resulting in a diminished glucose uptake and an impaired GSIS. Note that SREBP-1c acts as a transcriptional regulator in the nucleus and is only displayed in the cytosplasm for reasons of a clearer presentation
Fig. 4
Fig. 4
Physiological mechanism of a proposed concept for GLUT2-induced diabetic symptoms. Under normal conditions (left), glucose uptake by far exceeds subsequent glucose phosphorylation, making glucokinase the rate-limiting step in GSIS. Accordingly, both, triggering and amplifying pathway are activated resulting in a biphasic GSIS. A slight reduction in GLUT2 surface expression (middle) has no impact on GSIS, as long as glucose uptake is ≥ glucose usage. When GLUT2 is markedly reduced (right) glucose uptake falls below the rate of glucose usage, making glucose uptake the rate-limiting step in GSIS. Consequently, the triggering pathway cannot be activated, resulting in a monopahsic GSIS. The contribution of additional GLUTs (gray) to the sustained second phase of GSIS is unclear. The mechanisms underlying retained insulin secretion are unknown

References

    1. Alcazar O, Buchwald P. Concentration-dependency and time profile of insulin secretion: dynamic perifusion studies with human and murine islets. Front Endocrinol (Lausanne) 2019;10:680. doi: 10.3389/fendo.2019.00680. - DOI - PMC - PubMed
    1. Alpers CE, Hudkins KL. Mouse models of diabetic nephropathy. Curr Opin Nephrol Hypertens. 2011;20(3):278–284. doi: 10.1097/MNH.0b013e3283451901. - DOI - PMC - PubMed
    1. Artner I, Blanchi B, Raum JC, et al. MafB is required for islet beta cell maturation. Proc Natl Acad Sci. 2007;104(10):3853–3858. doi: 10.1073/pnas.0700013104. - DOI - PMC - PubMed
    1. Bae J-S, Kim T-H, Kim M-Y, et al. Transcriptional regulation of glucose sensors in pancreatic β-cells and liver: an update. Sensors (Basel) 2010;10(5):5031–5053. doi: 10.3390/s100505031. - DOI - PMC - PubMed
    1. Barron CC, Bilan PJ, Tsakiridis T, et al. Facilitative glucose transporters: implications for cancer detection, prognosis and treatment. Metab Clin Exp. 2016;65(2):124–139. doi: 10.1016/j.metabol.2015.10.007. - DOI - PubMed

Publication types

MeSH terms

Substances

LinkOut - more resources