. 2021 Mar;73(3):920-936.
doi: 10.1002/hep.31312. Epub 2020 Dec 18.

Hepatic Molecular Signatures Highlight the Sexual Dimorphism of Nonalcoholic Steatohepatitis (NASH)

Affiliations

Hepatic Molecular Signatures Highlight the Sexual Dimorphism of Nonalcoholic Steatohepatitis (NASH)

Jimmy Vandel et al. Hepatology. 2021 Mar.

Abstract

Background and aims: Nonalcoholic steatohepatitis (NASH) is considered as a pivotal stage in nonalcoholic fatty liver disease (NAFLD) progression, given that it paves the way for severe liver injuries such as fibrosis and cirrhosis. The etiology of human NASH is multifactorial, and identifying reliable molecular players and/or biomarkers has proven difficult. Together with the inappropriate consideration of risk factors revealed by epidemiological studies (altered glucose homeostasis, obesity, ethnicity, sex, etc.), the limited availability of representative NASH cohorts with associated liver biopsies, the gold standard for NASH diagnosis, probably explains the poor overlap between published "omics"-defined NASH signatures.

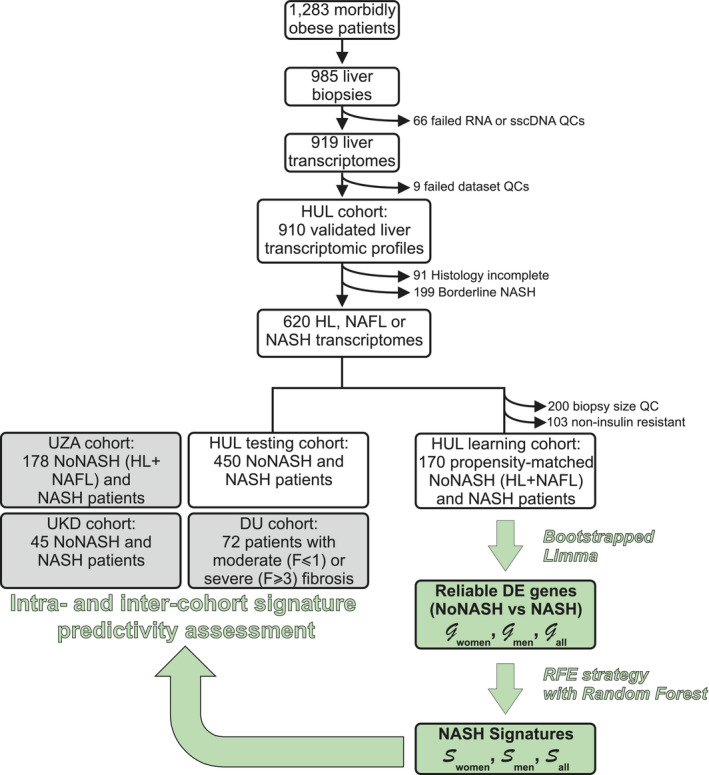
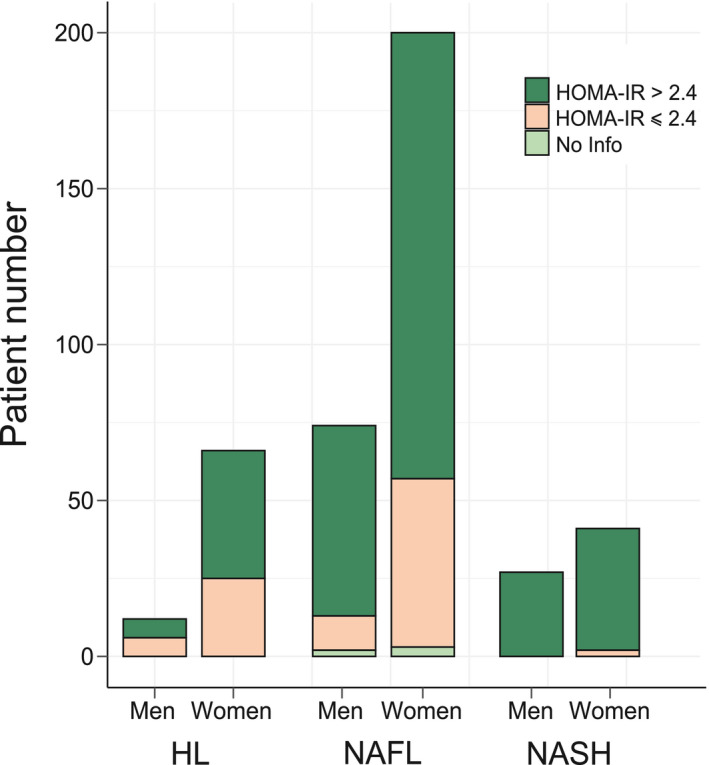
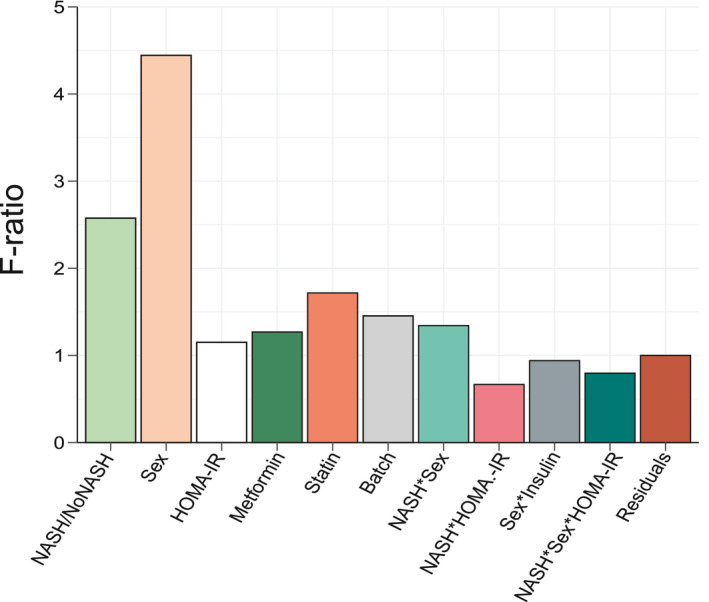
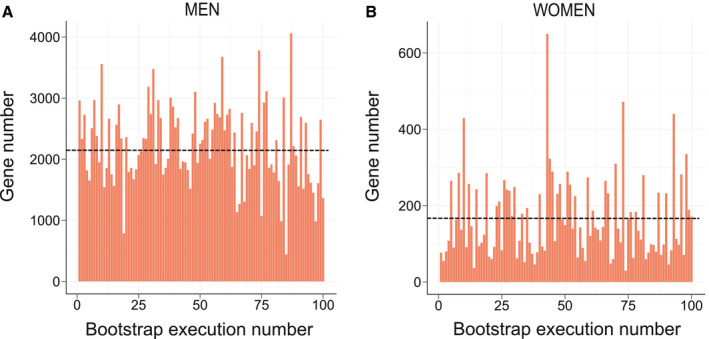
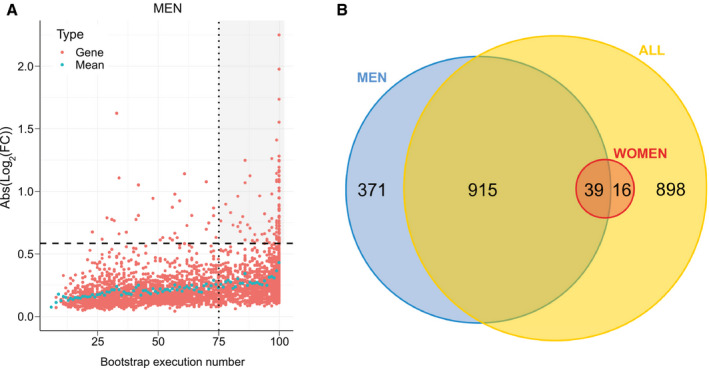
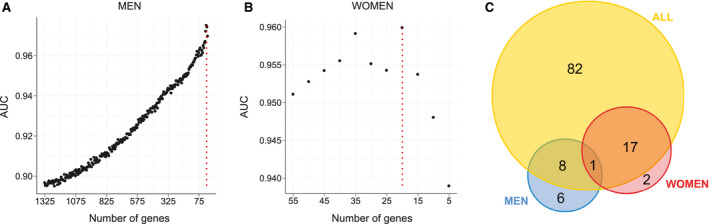
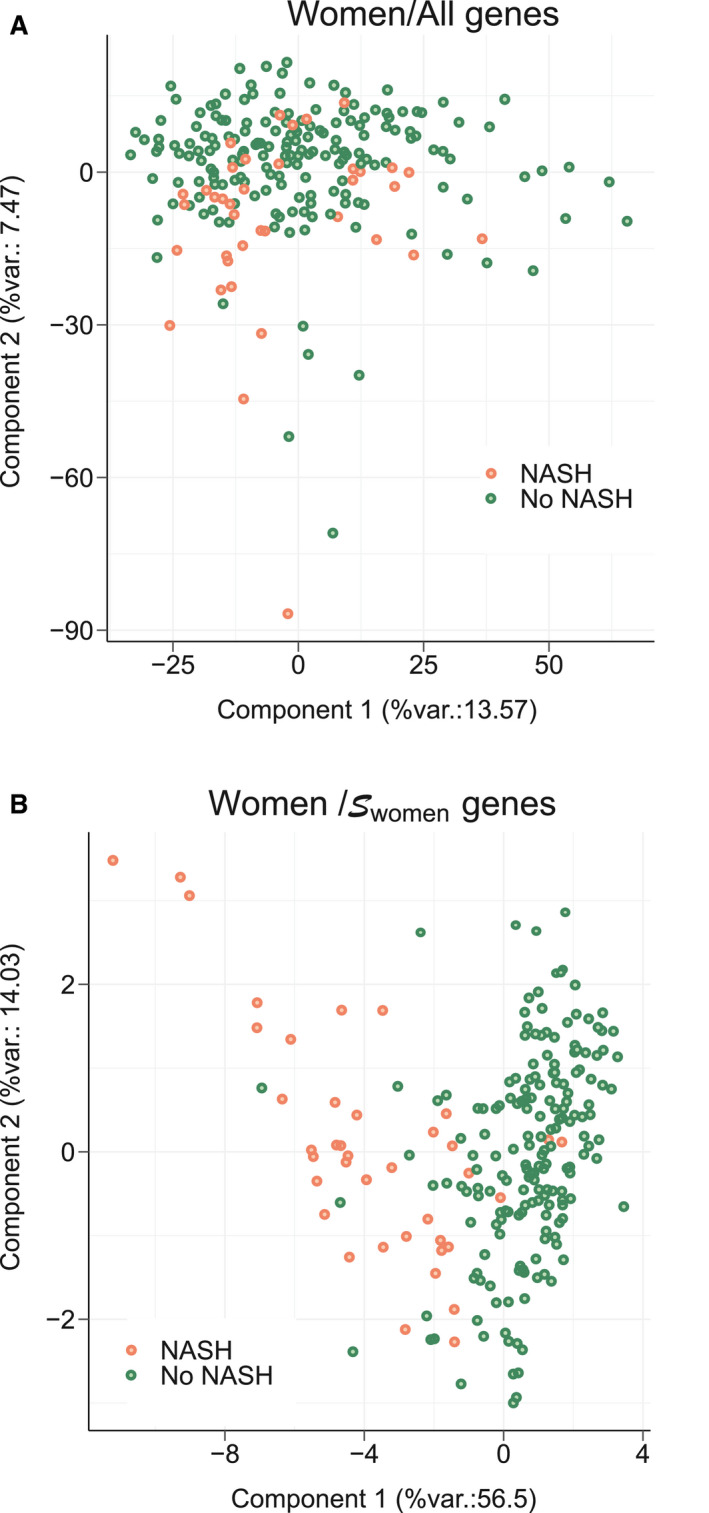
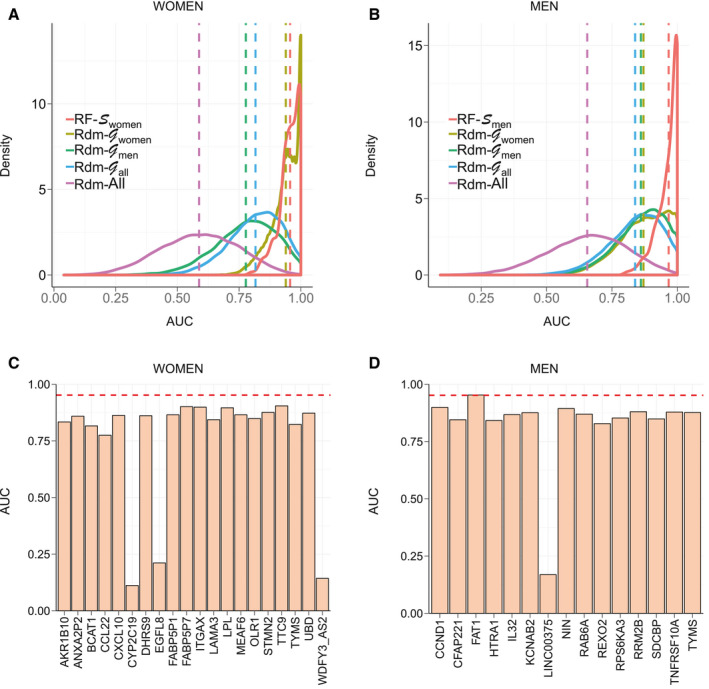
Approach and results: Here, we have explored transcriptomic profiles of livers starting from a 910-obese-patient cohort, which was further stratified based on stringent histological characterization, to define "NoNASH" and "NASH" patients. Sex was identified as the main factor for data heterogeneity in this cohort. Using powerful bootstrapping and random forest (RF) approaches, we identified reliably differentially expressed genes participating in distinct biological processes in NASH as a function of sex. RF-calculated gene signatures identified NASH patients in independent cohorts with high accuracy.

Conclusions: This large-scale analysis of transcriptomic profiles from human livers emphasized the sexually dimorphic nature of NASH and its link with fibrosis, calling for the integration of sex as a major determinant of liver responses to NASH progression and responses to drugs.


Figures

FIG. 1
FIG. 1
HUL cohort analysis. The main steps of the HUL cohort transcriptomic analysis, stratification, and bioinformatic analysis are indicated, as well as the steps during which definition and validation of proposed sex‐specific NASH signatures were undertaken. Details can be found in the Materials and Methods and Results sections. Abbreviations: QC, quality control; sscDNA, single‐stranded complementary DNA.
FIG. 2
FIG. 2
Insulin sensitivity and β‐cell function in the HUL cohort. The proportion in the HUL cohort of insulin‐resistant (HOMA‐IR index >2.4, in red) and non‐insulin‐resistant (HOMA‐IR index ≤ 2.4, in blue) patients among HL (n = 78), NAFL (n = 274), and NASH (n = 68) groups is displayed as a function of sex.
FIG. 3
FIG. 3
ANOVA. F‐ratio values of factors included in the Limma model were calculated. High F‐ratio values indicate a strong linear relationship between a given factor and gene expression values. Interaction term between factors A and B are indicated as an A*B annotation. Factors were selected on the basis of published reports.
FIG. 4
FIG. 4
Instability of the Limma‐based determination of DE genes. The number of DEGs between NoNASH and NASH patients (FDR < 10%) for (A) men and (B) women was assessed after 100 subsamplings (rate = 0.9) of the learning cohort followed Limma analysis. Mean DEG number is represented by a black dotted line.
FIG. 5
FIG. 5
Identification of reliable DE genes. (A) The absolute log2FC of DEGs was computed for the men learning cohort ( Gmen, n = 85). Each significantly DEG (FDR < 10%) is represented by a red dot. Gene reliability is established by the number of bootstrap runs for which the gene remains significantly DE (75%). Blue dots represent the mean absolute log2FC for a given bootstrap run count. Dashed line, FC = 1.5; dotted line, occurrence = 75. The gray‐shaded area includes reliable DEGs (FC > 1.5) with occurrences ≥75. (B) Number of reliably identified DEGs between NoNASH and NASH groups (men [blue], women [red], and all patients [yellow]).
FIG. 6
FIG. 6
RF models. (A,B) Classification power (AUC) of RF models. RFs were trained with a progressively reduced number of genes to identify an optimal subset of genes corresponding to the proposed signature, for men and women, established by the second step of RFE strategy. Maximal AUC is indicated by a vertical dotted red line. (C) Number of genes composing men (blue), women (red), and all patients’ (yellow) RF‐based signatures.
FIG. 7
FIG. 7
PCA. A PCA was run using gene expression values from women patients included in learning cohort based on: (A) all genes expression values or (B) Swomen genes. The percentage of the global data variance explained by each component is indicated by X and Y axis labels (%var.). Each dot represents a patient (NoNASH [blue] or NASH [yellow]).
FIG. 8
FIG. 8
AUC values of signatures and single gene predictors. (A,B) AUC distribution of RF models to predict women (left) and men (right) of the learning cohort in a cross‐validation scheme. RF models learnt using, respectively, Swomen and Smen (red) were compared in each plot to RF models learnt using random signatures built from Gwomen (khaki), Gmen (green), Gall (blue), and the full list of available genes (purple). Distribution means are represented as vertical dashed lines. (C,D) AUC of single gene predictors to predict NASH status of women (left) and men (right) patients of the learning cohort for each gene composing corresponding signatures ( Swomen and Smen). Mean AUCs reached by RF models learnt from corresponding signature in a cross‐validation scheme are represented through a red horizontal dashed line. Abbreviations: BCAT1, branched chain amino acid transaminase 1; CCL22, C‐C motif chemokine ligand 22; CFAP221, cilia‐ and flagella‐associated protein 221; CXCL10, C‐X‐C motif chemokine ligand 10; DHRS9, dehydrogenase/reductase SDR family member 9; EGFL8, EGF‐like domain multiple 8; HTRA1, HtrA serine peptidase 1; IL32, interleukin‐32; KCNAB2, potassium voltage‐gated channel subfamily A regulatory beta subunit 2; LAMA3, laminin subunit alpha 3; LINC00375, long intergenic non‐protein coding RNA 375; LPL, lipoprotein lipase; OLR1, oxidized low‐density lipoprotein receptor 1; RAB6A, RAB6A, member RAS oncogene family; REXO2, RNA exonuclease 2; RPS6KA3, ribosomal protein S6 kinase, 90 kDa, polypeptide 3; TNFRSF10A, TNF receptor superfamily member 10a; TTC9, tetratricopeptide repeat domain 9; WDFY3_AS2, WDFY3 antisense RNA 2.

References

    1. Younossi Z, Anstee QM, Marietti M, Hardy T, Henry L, Eslam M, et al. Global burden of NAFLD and NASH: trends, predictions, risk factors and prevention. Nat Rev Gastroenterol Hepatol 2018;15:11‐20. - PubMed
    1. Younossi ZM, Koenig AB, Abdelatif D, Fazel Y, Henry L, Wymer M. Global epidemiology of nonalcoholic fatty liver disease—meta‐analytic assessment of prevalence, incidence, and outcomes. Hepatology 2016;64:73‐84. - PubMed
    1. Friedman SL, Neuschwander‐Tetri BA, Rinella M, Sanyal AJ. Mechanisms of NAFLD development and therapeutic strategies. Nat Med 2018;24:908‐922. - PMC - PubMed
    1. Argo CK, Northup PG, Al‐Osaimi AM, Caldwell SH. Systematic review of risk factors for fibrosis progression in non‐alcoholic steatohepatitis. J Hepatol 2009;51:371‐379. - PubMed
    1. Singh S, Allen AM, Wang Z, Prokop LJ, Murad MH, Loomba R. Fibrosis progression in nonalcoholic fatty liver vs nonalcoholic steatohepatitis: a systematic review and meta‐analysis of paired‐biopsy studies. Clin Gastroenterol Hepatol 2015;13:643‐654.e1‐e9; quiz, e39‐e40. - PMC - PubMed

Publication types