. 2019 Dec;1(12):1209-1218.
doi: 10.1038/s42255-019-0150-8. Epub 2019 Dec 9.

Mitochondrial DNA Stress Signalling Protects the Nuclear Genome

Affiliations

Mitochondrial DNA Stress Signalling Protects the Nuclear Genome

Zheng Wu et al. Nat Metab. 2019 Dec.

Abstract

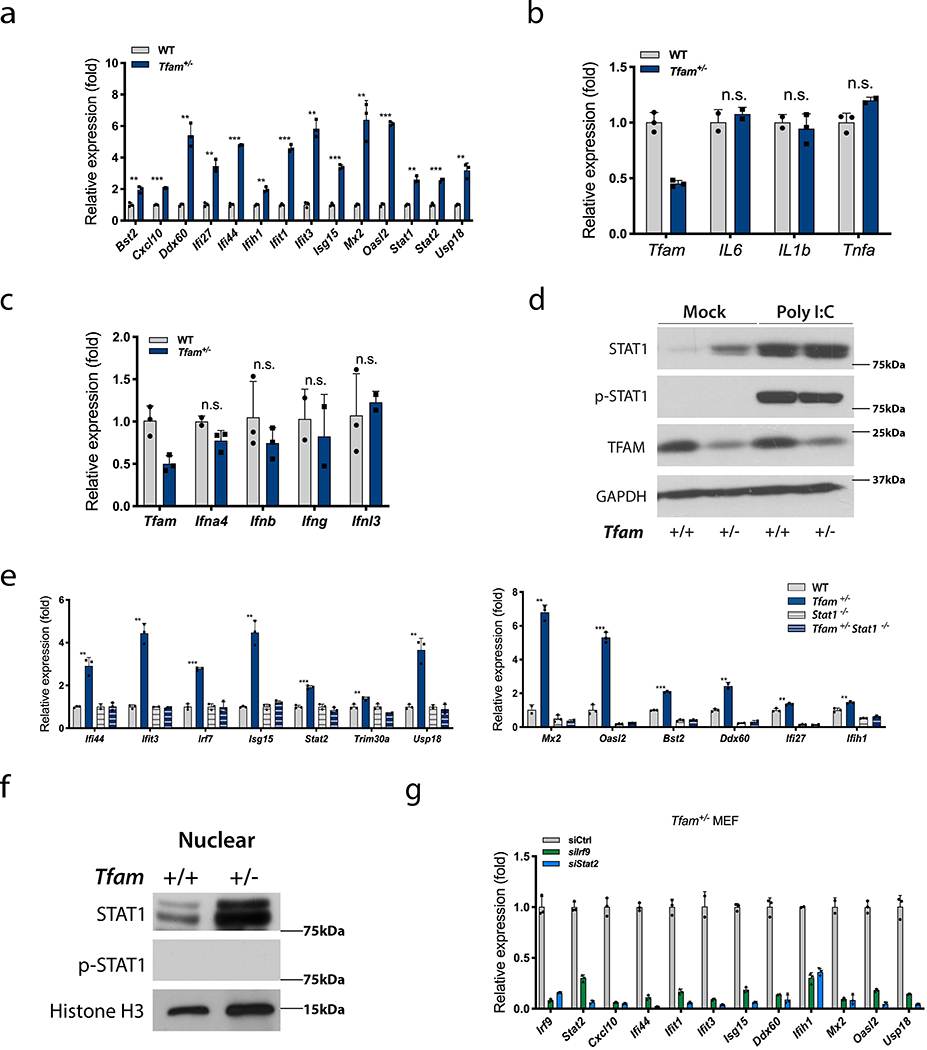
The mammalian genome comprises nuclear DNA (nDNA) derived from both parents and mitochondrial DNA (mtDNA) that is maternally inherited and encodes essential proteins required for oxidative phosphorylation. Thousands of copies of the circular mtDNA are present in most cell types that are packaged by TFAM into higher-order structures called nucleoids1. Mitochondria are also platforms for antiviral signalling2 and, due to their bacterial origin, mtDNA and other mitochondrial components trigger innate immune responses and inflammatory pathology2,3. We showed previously that instability and cytoplasmic release of mtDNA activates the cGAS-STING-TBK1 pathway resulting in interferon stimulated gene (ISG) expression that promotes antiviral immunity4. Here, we find that persistent mtDNA stress is not associated with basally activated NF-κB signalling or interferon gene expression typical of an acute antiviral response. Instead, a specific subset of ISGs, that includes Parp9, remains activated by the unphosphorylated form of ISGF3 (U-ISGF3) that enhances nDNA damage and repair responses. In cultured primary fibroblasts and cancer cells, the chemotherapeutic drug doxorubicin causes mtDNA damage and release, which leads to cGAS-STING-dependent ISG activation. In addition, mtDNA stress in TFAM-deficient mouse melanoma cells produces tumours that are more resistant to doxorubicin in vivo. Finally, Tfam +/- mice exposed to ionizing radiation exhibit enhanced nDNA repair responses in spleen. Therefore, we propose that damage to and subsequent release of mtDNA elicits a protective signalling response that enhances nDNA repair in cells and tissues, suggesting mtDNA is a genotoxic stress sentinel.


Conflict of interest statement

Competing Interests Statement. The authors have no competing interests to declare with regard to the data presented in the manuscript.

Figures

Extended Data Fig. 1
Extended Data Fig. 1. Additional analysis of innate immune signalling in MEFs.
a, Heat map of normalized expression values of the indicated ISGs (red font), interferon genes (black font), and NF-κB target genes (blue font) from our previously published microarray analysis4 of WT and Tfam+/− MEFs (two of each). b-d, qRT-PCR analyses of the indicated ISGs (b), NF-κB target genes (c) and interferon genes (d) in WT MEFs transfected with control (Ctrl) or Tfam siRNA for 72 hours. e, Western blot probing the indicated NF-κB pathway proteins, TFAM and VDAC (loading control) in WT and Tfam+/− littermate MEFs. (n=3 independent experiments.) f, qRT-PCR analysis of interferon β (Ifnb) gene expression in WT MEFs transfected with 2 μg poly(I:C) or lipofectamine only (Mock) for 9 hours. g, qRT-PCR analysis of the indicated ISGs in WT MEFs cultured overnight in the presence of control media (plain), media conditioned by WT or Tfam+/− MEFs, or media conditioned by WT MEFs stimulated with poly(I:C) for 9 hours (PIC-stimulated). The data shown are from one of two (f and g) or three (b-d) biological replicates with the error bars indicating the mean ± SD of three technical replicates. The other biological replicates are provided as Supplementary Figures. All data were analysed with two-tailed unpaired student’s t tests. Asterisks indicate significance as follows: ** P < 0.01, *** P < 0.001, n.s. not significant (P > 0.05).
Extended Data Fig. 2
Extended Data Fig. 2. Additional analysis of the STAT1 null (Stat1−/−) condition in WT (Tfam+/+ Stat1+/+) and Tfam+/− MEFs.
a, Western blot of STAT1, TFAM and GAPDH (loading control) in littermate MEFs of the indicated Tfam and Stat1 genotypes (bottom) that were transfected with 2 μg of Poly(I:C) or lipofectamine only (Mock) for 12 hours. (n=3 independent experiments). MEFs described in a were analysed (all normalized to WT) for b, mtDNA abundance (relative mtDNA copy number) by qPCR with D-loop primers; c, mitochondrial mass using MitoTracker Green (MTG) and flow cytometry (mean fluorescence intensity, MFI, in arbitrary units, A.U., is plotted), and d, mitochondrial membrane potential using MitoTracker Deep Red (MTDR) and flow cytometry (MFI in A.U. is plotted). e, MEFs of the indicated genotypes were analysed by immunofluorescence for mitochondrial and mtDNA nucleoid morphology using antibodies against HSP60 (Mito., magenta) and DNA (DNA, cyan), respectively (n=3 independent experiments). Images are Z-stack projections and scale bar represents 10 μm. f, qRT-PCR analysis of the ISGs Cxcl10 and Ifit1 in MEFs of the indicated genotypes. g, qRT-PCR analysis of the indicated ISGs in Tfam+/− MEFs transfected with control (Ctrl) or Irf3 siRNAs for 72 hours. h, qRT-PCR analysis of the indicated ISGs in Tfam+/− Stat1−/− MEFs transfected with control (Ctrl) or Irf3 siRNAs for 72 hours. i, Western blot showing siRNA knock-down of IRF9 or STAT2 in Tfam+/− MEFs compared to control (Ctrl) siRNA treated cells. GAPDH was probed as the loading control. (n=3 independent experiments). j, qRT-PCR analysis of the indicated ISGs in Tfam+/− Stat1−/− MEFs transfected with control (Ctrl) or Irf9 siRNAs for 72 hours. k, qRT-PCR analysis of the indicated ISGs in Tfam+/− Stat1−/− MEFs transfected with control (Ctrl) or Stat2 siRNAs for 72 hours. c-d, error bars indicate mean ± SD of n=3 biological replicates. For b the data shown are from one of two biological replicates with the error bars indicating the mean ± SD of three technical replicates. For g, h, j and k, the data shown are from one of three biological replicates with the error bars indicating the mean ± SD of three technical replicates. The other two biological replicates and the FACS gating strategy are provided as Supplementary Figures. Asterisks indicate significance as follows: ** P < 0.01, *** P < 0.001, **** P < 0.0001, n.s. not significant (P > 0.05).
Extended Data Fig. 3
Extended Data Fig. 3. Additional DNA damage and repair analysis in MEFs.
a, Pie charts showing the percentage of reported U-ISGF3-induced11 (green) and IRDS-related14 (blue) ISGs that are upregulated in Tfam+/− MEFs. The specific ISGs in these signatures are shown in the Table to the right, with the genes common to all three groups in bold. b-d, Stat1−/− and Tfam+/− Stat1−/− MEFs were treated with 1μM doxorubicin for 48 hours followed by (b) Apoptosis analysis by flow cytometry using Annexin V and Propidium Iodide (PI); (Contour plots represent n=3 biological replicates). (c) Quantification of flow cytometry analysis in b. for live cells (Annexin V and PI low), apoptotic cells (Annexin V high and PI low), and dead cells (Annexin V and PI high); (d) Cell viability analysis using the alamarBlue assay. c, d, Error bars indicate mean ± SD of (c) n=3 or (d) n=8 biological replicates. e and f, Analysis of nuclear DNA repair rate (i.e. the rate of γH2A.X and p-53BP1 foci resolution during recovery after 2 Gy IR). Nuclei are labelled with DAPI (blue), while γH2A.X (magenta), and p-53BP1 (green) were detected by immunofluorescence. Plotted to the right of the images is the average number of foci per nucleus at the indicated times. g and h, Analysis of the rate of induction of the nDNA damage response (i.e. the rate of γH2A.X and p-53BP1 foci formation) upon 2 Gy IR. Imaging was done as described in e and f. Plotted to the right is the percentage of positive cells (>20 γH2A.X foci per nucleus or >15 p-53BP1 foci per nucleus) at the indicated times. e-h, Scale bars represent 15 μm. e-h, Error bars indicate means ± SD of n=3 biological replicates, except for the 7.5 min time point in g and h, which are from n=2 biological replicates. In each replicate, 50 nuclei were quantified. All data were analysed with two-tailed unpaired student’s t tests. Asterisks indicate significance as follows: * P < 0.05, ** P < 0.01, n.s. not significant (P > 0.05).
Extended Data Fig. 4
Extended Data Fig. 4. Additional data supporting the role of PARP9 in mtDNA-stress-mediated enhancement of nDNA damage responses.
a, Heat map of PARP family gene expression from previously published microarray data in WT and Tfam+/− littermate MEFs (two of each). b, qRT-PCR analysis of Parp9 expression in WT (Tfam+/+ Stat1+/+), Tfam+/−, Stat1−/− and Tfam+/− Stat1−/− littermate MEFs. c, qRT-PCR analysis of Parp9 expression at the indicated times after transfection with two Parp9 siRNAs (#1 and #2). b and c, the data shown are from one of three biological replicates with the error bars indicating the mean ± SD of three technical replicates. The other two biological replicates are provided as Supplementary Figures. d, Tfam+/− MEFs were transfected with control (Ctrl) or one of two Parp9 siRNAs (#1 and #2) for 48 hours and then assessed for cell viability using the alamarBlue assay after treatment with 1.0 or 1.5 μM doxorubicin (Dox) for 24 hours. Error bars indicate mean ± SD of n=4 biological replicates. e-h, Analysis of DNA repair rate (i.e. the rate of γH2A.X and p-53BP1 foci resolution during recovery after (e and f) 2 Gy IR or (g and h) 12 hours of 1μM doxorubicin-mediated damage. Nuclei are labelled with DAPI (blue), while γH2A.X (magenta), and p-53BP1 (green) were detected by immunofluorescence. (e-h) Plotted to the right of the images is the average number of foci per nucleus at the indicated times. Scale bars represent 15 μm. Error bars indicate means ± SD of n=3 biological replicates, with 50 nuclei quantified in each. All data were analysed with two-tailed unpaired student’s t tests. Asterisks indicate significance as follows: * P < 0.05, ** P < 0.01, *** P < 0.001.
Extended Data Fig. 5
Extended Data Fig. 5. Additional data supporting mtDNA stress-mediated ISG induction in MEFs.
a, Western blot probing STAT1, p-STAT1 (Y701), γH2A.X (DNA damage marker) and GAPDH (loading control) in WT MEFs treated with the indicated doses of doxorubicin (Dox) for 24 hours. (n=3 independent experiments). b, qRT-PCR analysis of the indicated ISGs in WT (Stat1+/+) and Stat1 null (Stat1−/−) littermate MEFs challenged with (+Dox) or without 500 nM Dox for 24 hours. c, WT MEFs treated with (Dox) or without (Ctrl) 1μM doxorubicin were analysed by immunofluorescence for mitochondrial and mtDNA nucleoid morphology by immunofluorescence against HSP60 (Mito., magenta) and DNA (DNA, cyan). (n=3 independent experiments). Images are Z-stack projections and scale bar represents 10 μm. d and f, mtDNA abundance (relative mtDNA copy number) by qPCR with D-loop primers in WT MEFs exposed to (d) 100 μM 2’−3’-dideoxycytidine (ddC) or (f) 450 ng/mL ethidium bromide (EtBr) for 10–12 days. e, g, qRT-PCR analysis of the ISGs Ifit1 and Ifit3 in (e) Control (Ctrl) and ddC-treated MEFs (described in d) challenged with (+Dox) or without (-Dox) 500nM for doxorubicin for 16 hours, and (g) Control (Ctrl) and EtBr-treated MEFs (described in f) transfected with 2 μg dsDNA90 or lipofectamine only (Mock) for 9 hours. h, mtDNA abundance (relative mtDNA copy number) by qPCR with D-loop primers in LMTK- cells with (ρ+) or without (ρ˚) mtDNA. i, qRT-PCR analysis of the ISGs Ifit1 and Ifit3 in LMTK- ρ+ and ρ˚ cells (described in h) challenged with 500 nM Dox for 24 hours. j and k, MEFs were pre-treated with 100 μM chloramphenicol (Chlo) for 24 hours followed by 500 nM Doxorubicin (Dox) for 24 hours. j, Western blot using an OXPHOS complex cocktail (mtDNA-encoded subunit is in red, nucleus-encoded subunits in black), γH2A.X (DNA damage marker) or actin (loading control) (n=3 independent experiments). k, qRT-PCR analysis of the ISGs Ifit1 and Ifit3. For e and g the data shown are from one of two biological replicates with the error bars indicating the mean ± SD of three technical replicates. For b, d, f, h and i, the data shown are from one of three biological replicates with the error bars indicating the mean ± SD of three technical replicates. The other biological replicates are provided as Supplementary Figures. All data were analysed with two-tailed unpaired student’s t tests. Asterisks indicate significance as follows: ** P < 0.01, *** P < 0.001, **** P < 0.0001.
Extended Data Fig. 6
Extended Data Fig. 6. Doxorubicin promotes mtDNA stress-mediated ISG induction in MC-38 mouse colon cancer cells.
MC-38 cells treated with (+Dox) or without (-Dox) 150 nM doxorubicin for 24 hours and analysed by a, qRT-PCR analysis of the indicated ISGs and b, Western blot probing STAT1, p-STAT1 (Y701), γH2A.X (DNA damage marker) and GAPDH (loading control). (n=3 independent experiments) c, d, mtDNA abundance (relative mtDNA copy number) by qPCR with D-loop primers in WT MEFs exposed to (c) 100μM 2’−3’-dideoxycytidine (ddC) or (d) 200ng/mL ethidium bromide (EtBr) for 48 hours. e, qRT-PCR analysis of the ISGs Ifit1 and Ifit3 in control (Ctrl) and ddC treated MC-38 cells (described in c) challenged with (+Dox) or without (-Dox) 150 nM doxorubicin for 24 hours. f, qRT-PCR analysis of the ISGs Ifit1 and Ifit3 in control (Ctrl) and EtBr-treated MC-38 cells (described in d) challenged with (+Dox) or without (-Dox) 150 nM doxorubicin for 24 hours. g, qRT-PCR analysis of the indicated ISGs in MC-38 cells treated with 3 μM mitochondria-targeted doxorubicin (mitoDox) or DMSO (Mock) for 48 hours. h, Western blot analysis in MC-38 cell pools transduced with the indicated gene-specific guide RNA (gRNA) or scrambled (Scr) gRNA control to determine the knockout efficiency. (n=1 only to validate) Vinculin was probed as the loading control. i-k, qRT-PCR analysis of the ISGs Ifit1 and Ifit3 in MC-38 cell pools transduced with the indicated gRNAs (described in h) that were transfected with (i) 2 μg dsDNA90 or (j) 2 μg Poly(I:C) for 8 hours or (k) challenged with 150 nM doxorubicin for 24 hours. For i and j, the data shown are from one of two biological replicates with the error bars indicating the mean ± SD of three technical replicates. For a, c-g and k, the data shown are from one of three biological replicates with the error bars indicating the mean ± SD of three technical replicates. The other biological replicates are provided as Supplementary Figures. All data were analysed with two-tailed unpaired student’s t tests. Asterisks indicate significance as follows: ** P < 0.01, *** P < 0.001, **** P < 0.0001.
Extended Data Fig. 7
Extended Data Fig. 7. TFAM deficiency induces mtDNA stress and DNA-damage resistance in MC-38 mouse colon cancer cells.
a-e, WT and TFAM deficient (TFD) MC-38 cells (see Methods section) were analysed. a, qRT-PCR analysis of Tfam mRNA. b, western blot probing STAT1 (L.E., long exposure; S.E., short exposure), TFAM and GAPDH (loading control) (n=3 independent experiments). c, mtDNA abundance (relative mtDNA copy number) by qPCR with D-loop primers. d, mitochondrial and mtDNA nucleoid morphology analyses by immunofluorescence against HSP60 (Mito., magenta) and DNA (DNA, cyan) (n=3 independent experiments). Images are Z-stack projections and scale bar represents 10 μm. e, qRT-PCR analysis of the indicated ISGs. f, Western blot analysis in WT and TFD MC-38 cell pools transduced with the indicated gene-specific guide RNA (gRNA) or scrambled (Scr) control gRNA to determine the knockout efficiency (n=1, only to validate). GAPDH was probed as the loading control. g, qRT-PCR analysis of the indicated ISGs in WT and TFD MC-38 cell pools transduced with the indicated gene-specific gRNAs (described in f). h, Cell survival analysis of WT and TFD MC-38 cells challenged with 500 nM doxorubicin for 48 hours using the alamarBlue assay (n=7 biological replicates). a, c, e and g, the data shown are from one of three biological replicates with the error bars indicating the mean ± SD of three technical replicates. The other two biological replicates are provided as Supplementary Figures. All data were analysed with two-tailed unpaired student’s t tests. Asterisks indicate significance as follows:. ** P < 0.01, *** P < 0.001, **** P < 0.0001.
Extended Data Fig. 8
Extended Data Fig. 8. Additional analysis of mtDNA stress and DNA-damage resistance in YUMMER mouse melanoma cells.
a, Western blot of STAT1, TFAM and GAPDH (loading control) in WT and Tfam deficient (TFD) YUMMER cells (n=3 independent experiments). b, Colony formation analysis of WT and TFD YUMMER cells challenged with 250nM doxorubicin (Dox) for 4 hours. Plotted to the right is the quantification of relative cell survival (n=3 biological replicates). c, Western blot analysis in WT and TFD MC-38 cell pools transduced with the indicated gene-specific guide RNA (gRNA) or scrambled (Scr) control gRNA to determine the knockout efficiency (n=1, just to validate). GAPDH was probed as the loading control. d, Western blot of HA, TFAM and β-actin (Actin, loading control) in parental WT and TFD YUMMER cells, or WT and TFD YUMMER cells stably overexpressing empty vectors (EV) or HA-Flag-TFAM (OE) (n=3 independent experiments). e and f, YUMMER cells described in d were analysed as follows. e, mtDNA abundance (relative mtDNA copy number) by qPCR with D-loop primers. f, qRT-PCR analysis of the indicated ISGs. g, Mitochondrial and mtDNA nucleoid morphology analysis by immunofluorescence against HSP60 (Mito., magenta) and DNA (DNA, cyan)(n=3 independent experiments). Images are Z-stack projections and scale bar represents 10μm. The data shown are from one of three biological replicates with the error bars indicating the mean ± SD of three technical replicates. The other two biological replicates are provided as Supplementary Figures. ** P < 0.01, *** P < 0.001.
Extended Data Fig. 9
Extended Data Fig. 9. ISG expression inversely correlates with mRNA expression of Tfam and other mtDNA-metabolism-related genes.
a-c, RNA data from the CCLE (Cancer Cell Line Encyclopedia) was analysed. a, shown is the analysis of cells in the upper and lower quartiles of Tfam RNA expression, for expression the indicated ISGs, three interferon genes IFNA1, IFNB1 and IFNG (bold) and GAPDH (negative control). b, shown is the analysis of cells in the upper and lower quartiles of Lig3 (top row), Nthl1 (middle row), and Polg (bottom row) RNA expression, for expression of the indicated ISG. c, shown is the analysis of cells in the upper and lower quartiles of Sod2 (top row), SDHD (middle row) and VDAC1 (bottom row) RNA expression, for expression of the indicated ISGs. P values were calculated using Wilcoxon rank-sum test and displayed under each box plot.
Figure 1.
Figure 1.. Innate immune signalling by chronic mtDNA stress requires U-ISGF3 but is not associated with NF-κB or interferon gene activation.
a-c, qRT-PCR analysis of (a) the indicated ISGs, (b) NF-κB target genes and (c) IFN genes in WT and Tfam+/− littermate MEFs. d, Western blot of STAT1, p-STAT1 (Y701), TFAM and GAPDH (loading control) in WT and Tfam+/− littermate MEFs transfected with 2μg Poly I:C or lipofectamine only (Mock) for 12 hours. (n=3 independent experiments) e, qRT-PCR analysis of the indicated ISGs in WT, Tfam+/−, Stat1−/− and Tfam+/− Stat1−/− littermate MEFs. f, Western blot of STAT1, p-STAT1 (Y701) and histone H3 (nuclear marker and loading control) in purified nuclear extracts from WT and Tfam+/− littermate MEFs. (n=3 independent experiments). g, qRT-PCR analysis of the indicated ISGs in Tfam+/− MEFs transfected with siRNA against Irf9 or Stat2 for 72 hours. Data were normalized to cells transfected with a siRNA control (siCtrl), which was given a value of 1.0. The data shown are from one of three biological replicates with the error bars indicating the mean ± SD of three technical replicates. The other two biological replicates are provided as Supplementary Figures. All data were analysed with two-tailed unpaired student’s t tests. Asterisks indicate significance as follows: **p < 0.01, ***p < 0.001, n.s. not significant (p > 0.05).
Figure 2.
Figure 2.. mtDNA-stress signalling enhances nuclear DNA damage and repair responses.
WT and Tfam+/− MEFs were treated with 1μM doxorubicin (Dox) for 48 hours and analysed for cell death parameters. a, direct visualization of phase images collected using a 4x objective (scale bar represents 200 μm, phase images represent n=3 biological replicates); b, Cell viability analysis using alamarBlue. Error bars indicate means ± SD of n=4 (1μM Dox) or n=3 (1.5μM Dox) biological replicates. c, apoptosis analysis by flow cytometry using Annexin V and Propidium Iodide (PI) followed by flow cytometry analysis. (Contour plots represent n=3 biological replicates.) d, Quantification of flow cytometry analysis in c. for live cells (Annexin V and PI low), apoptotic cells (Annexin V high and PI low) and dead cells (Annexin V and PI high). Error bars indicate means ± SD of n=3 biological replicates. b, e and f, Analysis of nDNA repair rate (i.e. the rate of γH2A.X and p-53BP1 foci resolution during recovery after 12 hours of doxorubicin-mediated damage) in WT and Tfam+/− littermate MEFs. Nuclei are labelled with DAPI (blue), while γH2A.X (magenta) and p-53BP1 (green) were detected by immunofluorescence. Plotted to the right of the images is the average number of foci per nucleus at the indicated times after doxorubicin was removed. g and h, Analysis of the rate of induction of the nDNA damage response (i.e. the rate of γH2A.X and p-53BP1 foci formation) in WT and Tfam+/− littermate MEFs. Cells were analysed at the indicated time points after addition of 1μM doxorubicin. Imaging was done as described in e, f. Plotted to the right is the percentage of positive cells (>20 γH2A.X foci per nucleus or >15 p-53BP1 foci per nucleus) as a function of the time after doxorubicin addition. i and j, Analysis of the rate of induction of the nDNA damage response as described in g and h in Tfam+/− littermate MEFs transfected with two independent Parp9 siRNAs (#1 or #2) or a control (Ctrl) siRNA for 48 hours. e-j, Error bars indicate means ± SD of n=3 biological replicates in which 50 nuclei were quantified. k and l, Analysis of nDNA repair in vivo. WT and Tfam+/− mice with (IR) or without (Ctrl) exposure to 10Gy IR were sacrificed 24 hours post-exposure. Mouse spleens (n=3 per group) were fixed and stained to quantify nuclear γH2A.X and p-53BP1 foci. Plotted to the right is the number of “foci positive” splenocytes defined as DAPI-positive nuclei (blue) with more than 5 γH2A.X (magenta) or 11 p-53BP1 (green) foci. Scale bars represent 20 μm. Error bars indicate means ± SD (n=3 biological replicates, >400 nuclei each). All data were analysed with two-tailed unpaired student’s t tests. Asterisks indicate significance as follows: * p < 0.05, ** < 0.01, *** p < 0.001.
Figure 3.
Figure 3.. Damage and release of mtDNA mediates ISG expression.
WT MEFs were treated with (+Dox) or without (-Dox) 500 nM doxorubicin for 24 hours and subjected to a, qRT-qPCR analysis of the indicated ISGs; b, flow cytometry analysis using MitoSox. The mean fluorescence intensity (MFI) is plotted; c, mtDNA damage analysis by a long-PCR assay. Error bars indicate means ± SD of three biological replicates. d, Western blot analysis of whole cell extract (WCE), Pellet (Pel) and cytoplasmic (Cyt) fractions (see Methods section) derived from WT MEFs treated with (+) or without (−) 500nM doxorubicin (Dox) for 24 hours. GAPDH was used to mark the cytoplasmic (Cyt) fraction, in which the lack of mitochondrial and nuclear contamination was assessed by probing for HSP60 and histone H3. γH2A.X was probed as a marker of DNA damage. (n=3 independent experiments). e, Analysis of mtDNA present in purified cytoplasmic fractions (described in d) by qPCR (three different mtDNA primers were used: Dloop, Dloop2 and ND4). f, WT MEFs with (EtBr) or without (Ctrl) prior ethidium bromide treatment to deplete mtDNA were treated with (+Dox) or without (-Dox) 500nM doxorubicin for 24 hours and analysed by qRT-PCR for expression of the ISGs Ifit1 and Ifit3. g, qRT-PCR analysis of the indicated ISGs in WT MEFs treated with DMSO (Mock) or 3μM mitochondria-targeted doxorubicin (mitoDox) for 24 hours. h and i, qRT-PCR analysis of the indicated ISGs in LMTK cells with (ρ+) or without (ρ˚) mtDNA that were treated with DMSO (Mock) or 3μM mitoDox for 48 hours. a, e-i, The data shown are from one of three biological replicates with the error bars indicating the mean ± SD of three technical replicates. The other two biological replicates and the FACS gating strategy are provided as Supplementary Figures. b and c, Error bars indicate means ± SD of n=3 biological replicates. All data were analysed with two-tailed unpaired student’s t tests. Asterisks indicate significance as follows: * p < 0.05, ** p < 0.01, *** p < 0.001, n.s. not significant, (p > 0.05).
Figure 4.
Figure 4.. Analysis of mtDNA-stress phenotypes in TFAM-deficient mouse melanoma cells and associated chemoresistance in vivo.
TFAM-deficient (TFD) YUMMER1.7 mouse melanoma cells were generated by CRISPR-Cas9 editing and analysed compared to unedited (WT) control cells. a, mtDNA abundance (relative mtDNA copy number) by qPCR with Dloop primers. b, qRT-PCR analysis of the indicated ISGs. c, analysis of cell viability in response to 48 hours of 500nM doxorubicin using an alamarBlue assay. (n=6 biological replicates.) d, Immunofluorescence of mitochondria (anti-HSP60, magenta) and mtDNA nucleoids (anti-DNA, cyan). Images are Z-stack projections and scale bar represents 10 μm. (n=3 independent experiments) e, qRT-PCR analysis of the indicated ISGs in WT or TFD YUMMER1.7 cell pools transduced with the indicated gene-specific guide RNA (gRNA) or scrambled (scr) gRNA control. a, b and e, The data shown are from one of three biological replicates with the error bars indicating the mean ± SD of three technical replicates. The other two biological replicates are provided as Supplementary Figures. f, The same cell lines as in e were treated with 500nM doxorubicin for 48 hours and then subjected to cell viability analysis using the alamarBlue assay. (n=4 biological replicates). g, Schematic of protocol used for assessment of doxorubicin chemoresistance in vivo using WT and TFD YUMMER1.7 cells. h, Growth measurements of WT and TFD YUMMER1.7 tumours in mice with (Dox) or without (Ctrl) doxorubicin treatment. Tumour volume is plotted as a function of days after cell transplant and the day of Dox treatment is indicated. Error bars indicate means ± SD of n=8 biological replicates. i, Tumour volume (mm3) of WT or TFD tumours on day 8 (WT) and day 18 (TFD) are plotted, which are the days when the control (-Dox) tumours in reached 1000 mm3 (h and i, n=8 mice per group). All data were analysed with two-tailed unpaired student’s t tests. Asterisks indicate significance as follows: * P < 0.05, ** P < 0.01, *** P < 0.001, n.s. not significant (P > 0.05).

References

    1. Bogenhagen DF, Rousseau D & Burke S The layered structure of human mitochondrial DNA nucleoids. J Biol Chem 283, 3665–3675, 10.1074/jbc.M708444200 (2008). - DOI - PubMed
    1. West AP, Shadel GS & Ghosh S Mitochondria in innate immune responses. Nat Rev Immunol 11, 389–402, 10.1038/nri2975 (2011). - DOI - PMC - PubMed
    1. West AP & Shadel GS Mitochondrial DNA in innate immune responses and inflammatory pathology. Nat Rev Immunol 17, 363–375, 10.1038/nri.2017.21 (2017). - DOI - PMC - PubMed
    1. West AP et al. Mitochondrial DNA stress primes the antiviral innate immune response. Nature 520, 553–557, 10.1038/nature14156 (2015). - DOI - PMC - PubMed
    1. Zhong Z et al. New mitochondrial DNA synthesis enables NLRP3 inflammasome activation. Nature 560, 198–203, 10.1038/s41586-018-0372-z (2018). - DOI - PMC - PubMed

Publication types

MeSH terms