. 2020 Jun 22;60(6):3157-3171.
doi: 10.1021/acs.jcim.0c00307. Epub 2020 May 29.

Structural Determinants of Phosphopeptide Binding to the N-Terminal Src Homology 2 Domain of the SHP2 Phosphatase

Affiliations

Structural Determinants of Phosphopeptide Binding to the N-Terminal Src Homology 2 Domain of the SHP2 Phosphatase

Massimiliano Anselmi et al. J Chem Inf Model. .

Abstract

SH2 domain-containing tyrosine phosphatase 2 (SHP2), encoded by PTPN11, plays a fundamental role in the modulation of several signaling pathways. Germline and somatic mutations in PTPN11 are associated with different rare diseases and hematologic malignancies, and recent studies have individuated SHP2 as a central node in oncogenesis and cancer drug resistance. The SHP2 structure includes two Src homology 2 domains (N-SH2 and C-SH2) followed by a catalytic protein tyrosine phosphatase (PTP) domain. Under basal conditions, the N-SH2 domain blocks the active site, inhibiting phosphatase activity. Association of the N-SH2 domain with binding partners containing short amino acid motifs comprising a phosphotyrosine residue (pY) leads to N-SH2/PTP dissociation and SHP2 activation. Considering the relevance of SHP2 in signaling and disease and the central role of the N-SH2 domain in its allosteric regulation mechanism, we performed microsecond-long molecular dynamics (MD) simulations of the N-SH2 domain complexed to 12 different peptides to define the structural and dynamical features determining the binding affinity and specificity of the domain. Phosphopeptide residues at position -2 to +5, with respect to pY, have significant interactions with the SH2 domain. In addition to the strong interaction of the pY residue with its conserved binding pocket, the complex is stabilized hydrophobically by insertion of residues +1, +3, and +5 in an apolar groove of the domain and interaction of residue -2 with both the pY and a protein surface residue. Additional interactions are provided by hydrogen bonds formed by the backbone of residues -1, +1, +2, and +4. Finally, negatively charged residues at positions +2 and +4 are involved in electrostatic interactions with two lysines (Lys89 and Lys91) specific for the SHP2 N-SH2 domain. Interestingly, the MD simulations illustrated a previously undescribed conformational flexibility of the domain, involving the core β sheet and the loop that closes the pY binding pocket.


Conflict of interest statement

The authors declare no competing financial interest.

Figures

Figure 1
Figure 1
Structure of SHP2: N-SH2 domain and whole protein. (A) The structure of the N-SH2 domain of SHP2 has the βαβββββαβ topology typical of SH2 domains. Loop BC (purple) is part of the pY binding pocket, loop DE (blue) inserts in the PTP active site in the autoinhibited SHP2 conformation, and loops EF (orange) and BG (red) control access to the groove where the phosphopeptide binds. The crystallographic structures of the N-SH2 domain (A) in the autoinhibited conformation of SHP2 and (B) when bound to a phosphopeptide differ mainly for a rearrangement of the EF loop, which in the autoinhibited state blocks the peptide binding site of the N-SH2 domain. SHP2 comprises three domains: N-SH2 (light blue), C-SH2 (orange), and PTP (pink). (C) In the absence of external stimuli, the N-SH2 domain blocks the catalytic site of the PTP domain. (D) Binding of the SH2 domain to phosphorylated sequences or pathogenic mutations favor a conformational transition leading to a rearrangement of the domains and to activation. The SHP2 structures in panels (C) and (D) are reported with their PTP domain in a similar orientation. PDB codes: (A,C) 2SHP, (B) 1AYA, (D) 6CRF.
Figure 2
Figure 2
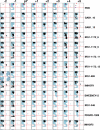
Dynamics of bound peptides. Left panel: RMSF of peptides bound to N-SH2. Residues whose RMSF is less than 1 Å larger than the minimal value are colored in cyan. Middle panel: side-chain order parameter Θ. Values close to unity indicate very narrow dihedral angle distributions and therefore bonds that are rigid with respect to rotation. Bars are colored according to the following scheme: Θ lower than 0.25 (red), between 0.25 and 0.75 (gray), and greater than 0.75 (blue). A bold “x” indicates residues for which the side-chain order parameter cannot be defined (glycines and alanines). Right panel: most representative structures of the IRS1-1172_12 and IMHOF9 simulations, with the peptide backbone size and color (from blue to red) assigned based on the mobility of each residue.
Figure 3
Figure 3
Backbone conformation of the bound peptide residues in PDB X-ray structures and in the simulations. Ramachandran plots of residues from positions −2 to +5 with respect to pY are shown. Crystallographic structures are reported in the first line (“PDB”), with the following color code: 1AYA: green, 1AYB: red, 3TL0: purple, 4QSY: black, 5DF6: orange, 5X7B: brown, 5X94: blue. The allowed regions of the Ramachandran plot are reported in cyan in the background. Angles ϕ and ψ are reported on the x and y axes, respectively, with values from −180 to +180°. The background shows the allowed regions for a standard amino acid or for Pro or Gly where present (adapted from ref (71)).
Figure 4
Figure 4
Main H-bonds between the peptide and protein backbones. Most representative structure of the IRS1-1172_12 simulation. H-bonds are highlighted by green lines.
Figure 5
Figure 5
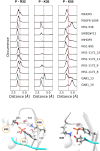
Most common ion-pair interactions between the pY phosphate and N-SH2 residues in MD trajectories. Top panel: distribution of distances between the phosphotyrosine phosphate and protein residues. Distances of less than 4 Å (vertical red dashed lines) are indicative of a stable salt bridge. Bottom panels: N-SH2 residues that interact with the phosphate group of pY (see Table 5) are shown on the left in the most representative structure of the IRS1-1172_8 simulation; the structure on the right shows the alternative arrangement of K35, where it interacts with the pY and a phosphopepeptide anionic residue in −1 (most representative structure of the GAB1_10 simulation).
Figure 6
Figure 6
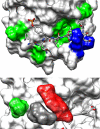
Most representative conformation in the IRS1-1172_8 MD simulation, illustrating the main specificity determining side-chain interactions. Top: hydrophobic regions of the domain surface are shown in green, while cationic K89 and K91 are reported in blue. Bottom: interactions of the L – 2 residue (gray surface), which inserts between the pY ring (red) and V14 (green).
Figure 7
Figure 7
Solvent exposure of phosphopeptide residues; except for pY, each residue is colored in green when its solvent accessibility is lower than 50% and in red when it is higher than 50%. For MD simulations, an average value is reported. Hydrophobic, anionic, and cationic residues are colored in green, red, and blue, respectively.
Figure 8
Figure 8
Most common intermolecular ion-pair interactions between the phosphopeptide side chains and the N-SH2 domain. Distribution of charged group distances populated in each MD trajectory. Distances of less than 4 Å (vertical red dashed lines) are indicative of a stable salt bridge. Dashed horizontal lines indicate that the corresponding phosphopeptide sequences lack an anionic residue at these positions and therefore cannot form the ion pair.
Figure 9
Figure 9
N-SH2 domain conformational variability in the MD simulations. Root-mean-square fluctuations (RMSF) of the N-SH2 domain backbone in the cumulative trajectory including all 12 simulations. The domain secondary structure is reported at the bottom for reference. The most mobile loops are highlighted in red in the figure. The blue-shaded area represents the standard deviation of the RMSF profile calculated between the twelve 1 μs trajectories.
Figure 10
Figure 10
Structural parameters in simulated and experimental structures. Left: conformation of the pY pocket, as measured from the average distance between residues in the pY-loop (BC, residues 34–38) and T42 (βC3) in N-SH2 or structurally equivalent residues in other SH2 domains (see the Supporting Information). Center: conformation of the loops controlling access to the selectivity-determining region, as measured from the minimum distance between the EF loop (residues 66–69) and BG loop (residues 84–96). Right: conformation of the central β sheet as measured from the interstrand distance between the C atom of D40 (βC1) and N atom of Q57 (βD’1) or structurally equivalent residues in other SH2 domains. Data from the overall MD simulation of 12 N-SH2:peptide complexes are shown in black, along with analogous data from X-ray (red) and NMR (green) structures of SH2 domains. Values for experimental structures of isolated N-SH2 domains are shown as blue (when phosphopeptide-bound) or red dots (with no bound peptide). Values for structures of the domain in the whole SHP2 protein are reported as cyan (autoinhibited conformation) or orange dots (active conformation). Average ± standard deviation values of distances spanned by the individual simulations are indicated by black horizontal bars, reported in the order of Table 3, with GAB1_10 at the bottom and IMHOF5 at the top.
Figure 11
Figure 11
Conformational variability of the peptide-bound N-SH2 domain. Most representative structures of simulations IRS1-1172_9 and IRS1-1172_11, showing the conformational transitions of BC (purple), EF (orange), and BG (red) loops and of the central β sheet connecting strands C and D. The DE loop is highlighted in blue. The peptide surface is shown in yellow.

References

    1. Sadowski I.; Stone J. C.; Pawson T. A noncatalytic domain conserved among cytoplasmic protein-tyrosine kinases modifies the kinase function and transforming activity of Fujinami sarcoma virus P130gag-fps. Mol. Cell. Biol. 1986, 6, 4396–4408. 10.1128/MCB.6.12.4396. - DOI - PMC - PubMed
    1. Yaffe M. B. Phosphotyrosine-binding domains in signal transduction. Nat. Rev. Mol. Cell Biol. 2002, 3, 177–186. 10.1038/nrm759. - DOI - PubMed
    1. Liu B. A.; Jablonowski K.; Raina M.; Arcé M.; Pawson T.; Nash P. D. The human and mouse complement of SH2 domain proteins—establishing the boundaries of phosphotyrosine signaling. Mol. Cell 2006, 22, 851–868. 10.1016/j.molcel.2006.06.001. - DOI - PubMed
    1. Liu B. A.; Engelmann B. W.; Nash P. D. The language of SH2 domain interactions defines phosphotyrosine-mediated signal transduction. FEBS Lett. 2012, 586, 2597–2605. 10.1016/j.febslet.2012.04.054. - DOI - PubMed
    1. Mayer B. J.What Have We Learned from SH2 Domains? In SH2 Domains; Liu B. A., Machida K., Eds.; Humana Press: New York, 2017; pp 37–43.

Publication types

MeSH terms

Substances