. 2020 May 12:9:e54090.
doi: 10.7554/eLife.54090.

Bmal1 integrates mitochondrial metabolism and macrophage activation

Affiliations

Bmal1 integrates mitochondrial metabolism and macrophage activation

Ryan K Alexander et al. Elife. .

Abstract

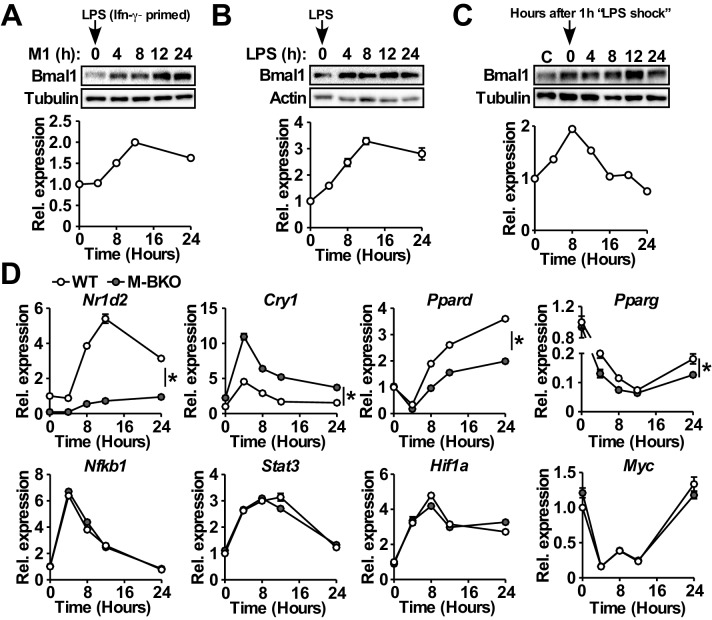
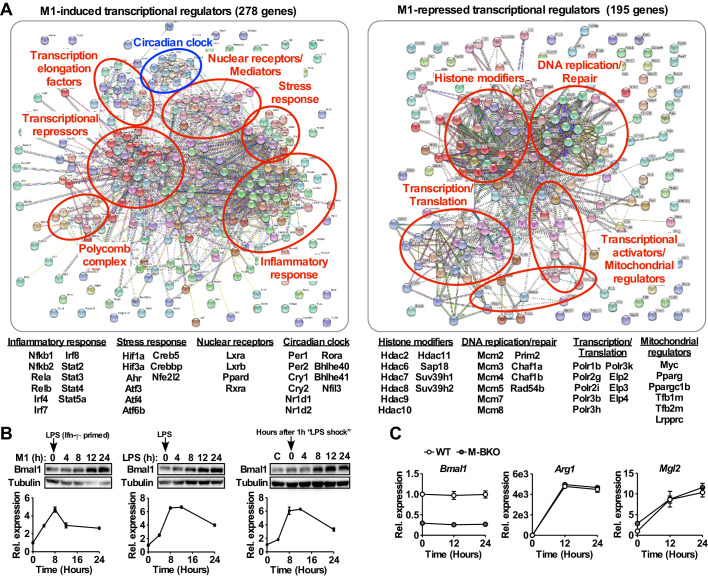
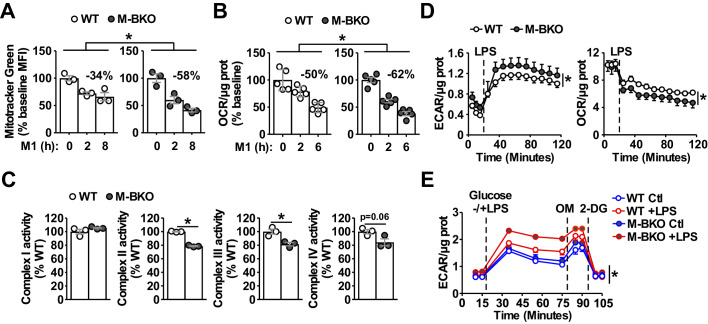
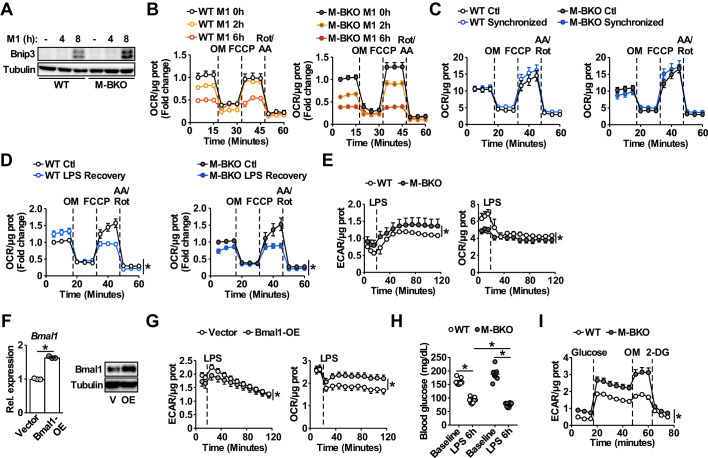
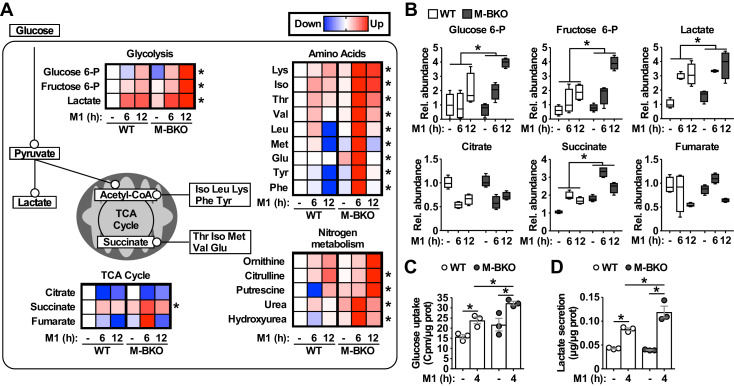
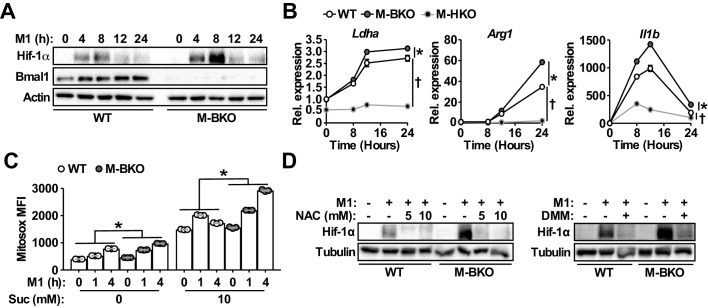
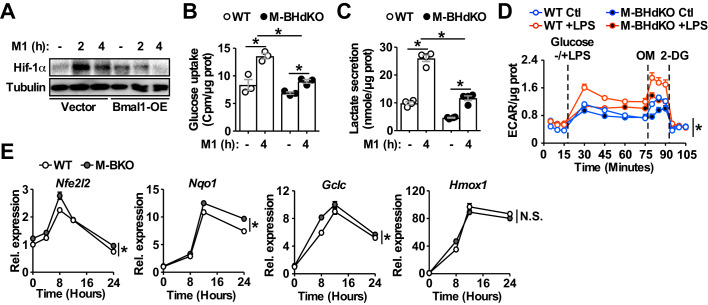
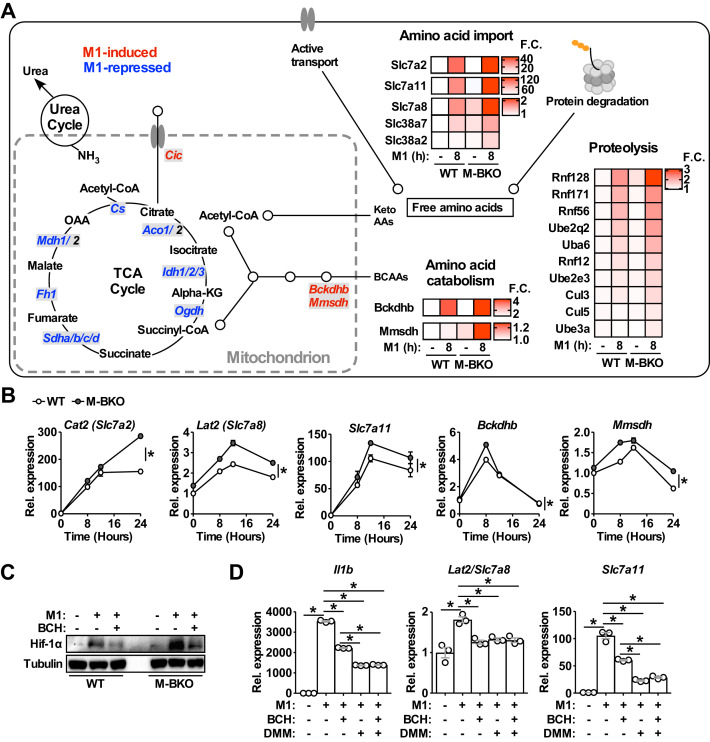
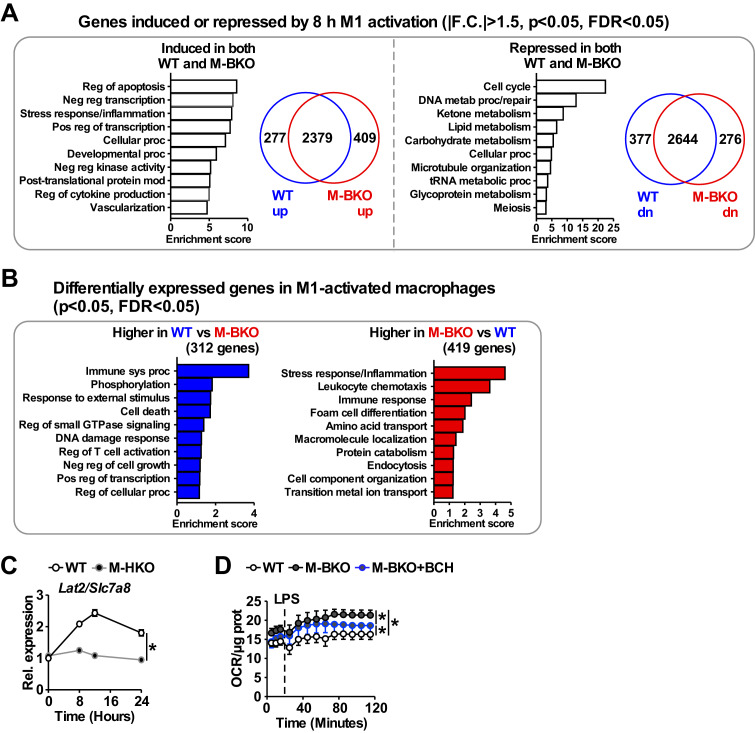
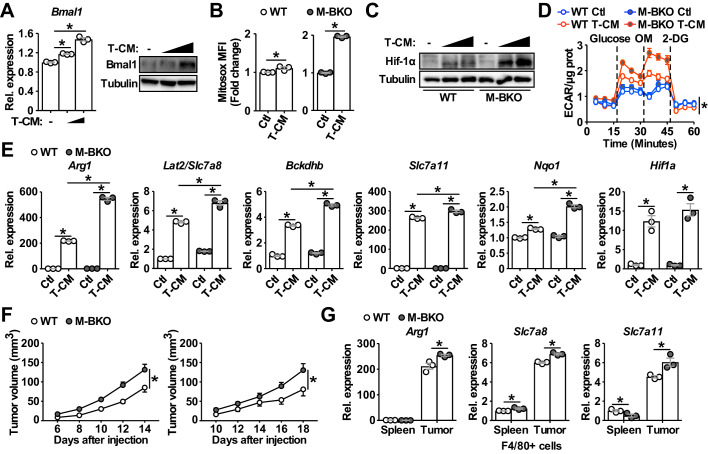
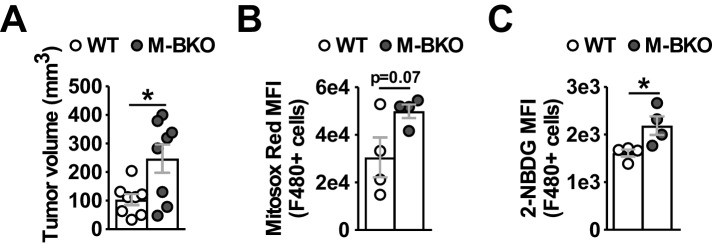
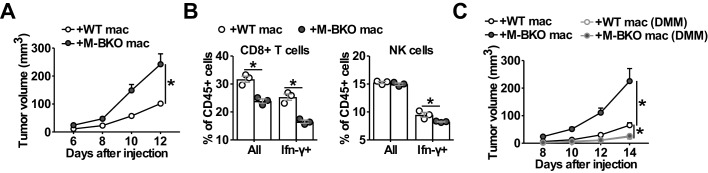
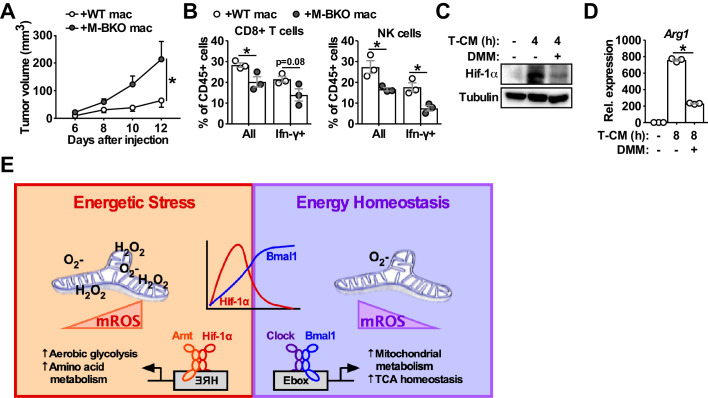
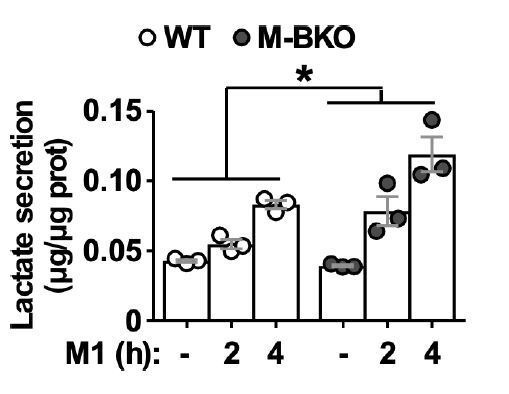
Metabolic pathways and inflammatory processes are under circadian regulation. Rhythmic immune cell recruitment is known to impact infection outcomes, but whether the circadian clock modulates immunometabolism remains unclear. We find that the molecular clock Bmal1 is induced by inflammatory stimulants, including Ifn-γ/lipopolysaccharide (M1) and tumor-conditioned medium, to maintain mitochondrial metabolism under metabolically stressed conditions in mouse macrophages. Upon M1 stimulation, myeloid-specific Bmal1 knockout (M-BKO) renders macrophages unable to sustain mitochondrial function, enhancing succinate dehydrogenase (SDH)-mediated mitochondrial production of reactive oxygen species as well as Hif-1α-dependent metabolic reprogramming and inflammatory damage. In tumor-associated macrophages, aberrant Hif-1α activation and metabolic dysregulation by M-BKO contribute to an immunosuppressive tumor microenvironment. Consequently, M-BKO increases melanoma tumor burden, whereas administering the SDH inhibitor dimethyl malonate suppresses tumor growth. Therefore, Bmal1 functions as a metabolic checkpoint that integrates macrophage mitochondrial metabolism, redox homeostasis and effector functions. This Bmal1-Hif-1α regulatory loop may provide therapeutic opportunities for inflammatory diseases and immunotherapy.

Keywords: anti-tumor activity; cell biology; energy metabolism; macrophage; mouse.


Conflict of interest statement

RA, YL, NK, KS, CX, AH, SL, DJ, NL, CL No competing interests declared

Figures

Figure 1.
Figure 1.. Macrophage Bmal1 is induced by M1 activation.
(A–C) Bmal1 protein levels (top) and relative gene expression determined by qPCR (bottom) in bone-marrow-derived macrophages (BMDM) during a 24-hr time course of M1 activation (10 ng/ml Ifn-γ overnight priming + 10 ng/ml LPS) (A), treatment with LPS alone (100 ng/ml) (B), or acute LPS treatment for 1 hr (100 ng/mL) (C). For M1- and LPS-only treatments, LPS was spiked in at time zero without medium change. For acute LPS treatment, cells were grown with LPS for one hour followed by culture in DMEM, 2% FBS without LPS (time zero indicates medium change). N = 3 biological replicates were used for qPCR. (D) Relative expression of circadian clock and inflammatory transcriptional regulators in M1-activated macrophages, as determined by qPCR. N = 3 biological replicates, statistical analysis performed using two-way ANOVA for WT vs M-BKO across the time course. Data are presented as mean ± S.E.M. *, p<0.05. Experiments were repeated at least twice.
Figure 1—figure supplement 1.
Figure 1—figure supplement 1.. The circadian clock is a transcriptional module that is induced by M1 activation.
(A) Annotated protein–protein interaction maps generated by STRING of transcriptional regulators that were significantly induced (left) or repressed (right) in WT macrophages by 8 hours M1 activation (Ifn-γ priming followed by stimulation with 10 ng/mL LPS) compared to time-matched controls (Ifn-γ priming without LPS), determined by RNA-seq (p<0.05, FDR <0.05, |F.C.|>1.5). N = 3 biological replicates. F.C., fold change. See Table 1 for the complete gene list. (B) Bmal1 protein levels (top panels) and relative gene expression determined by qPCR (bottom panels) in mouse embryonic fibroblasts during a 24-hr time course of M1 activation (10 ng/ml Ifn-γ overnight priming + 10 ng/ml LPS, left panels), treatment with LPS only (100 ng/ml, middle panels), or 1 hr acute LPS treatment (100 ng/mL, right panels). For M1- and LPS-only treatments, LPS was spiked in at time zero without medium change. For acute LPS treatment, cells were grown with LPS for one hour followed by culture in DMEM, 2% FBS without LPS (time zero indicates medium change). N = 3 biological replicates for qPCR. (C) Gene expression during a 24-hr time course of Il-4 treatment in WT and M-BKO macrophages determined by qPCR. N = 3 biological replicates. Data are presented as mean ± S.E.M. *, p<0.05. Cell culture experiments were repeated at least twice.
Figure 2.
Figure 2.. Bmal1 is required to maintain mitochondrial metabolism.
(A) Assessment of mitochondrial mass in macrophages throughout a time course of M1 activation using Mitotracker Green (mean fluorescence intensity, MFI) determined by flow cytometry. N = 3 biological replicates, statistical analysis was performed using two-way ANOVA for WT vs M-BKO across the time course. (B) Basal oxygen consumption rate (OCR) in Ifn-γ-primed macrophages pretreated without or with LPS (10 ng/mL) for 2 or 6 hr before the assay. See Figure 2—figure supplement 1B for the full assay results. The assay medium contained minimal DMEM with 5 mM glucose and 1 mM sodium pyruvate, pH 7.4. N = 5 biological replicates, statistical analysis was performed using two-way ANOVA for WT vs M-BKO across the time course. (C) Activities of ETC complexes in isolated mitochondria from WT and M-BKO macrophages after 6 hours M1 stimulation. N = 3 biological replicates, statistical analysis was performed using Student’s T test. (D) Extracellular flux analysis in Ifn-γ-primed macrophages measuring the changes in extracellular acidification rate (ECAR, left panel) and oxygen consumption rate (OCR, right panel) following LPS injection (100 ng/mL). The assay medium contained 5 mM glucose and 1 mM pyruvate in minimal DMEM with 2% dialyzed FBS, pH 7.4. N = 5 biological replicates, statistical analysis was performed using two-way ANOVA for WT vs M-BKO across the time course. (E) Glycolytic stress test in Ifn-γ-primed macrophages measuring ECAR following glucose (25 mM) injection, with or without LPS (100 ng/mL). Maximal glycolytic rate was determined by injection of oligomycin (OM, 2 μM), and glycolysis-dependent ECAR was determined by injection of 2-deoxyglucose (2-DG, 50 mM). The assay medium contained minimal DMEM with 2% dialyzed FBS, pH 7.4. N = 5 biological replicates, statistical analysis was performed using two-way ANOVA for WT vs M-BKO across the time course. Data are presented as mean ± S.E.M. *, p<0.05. Experiments were repeated at least twice.
Figure 2—figure supplement 1.
Figure 2—figure supplement 1.. Effects of Bmal1 gene deletion and overexpression on glycolytic versus oxidative metabolism.
(A) Immunoblot of the mitophagy regulator Bnip3 in M1-activated WT and M-BKO BMDMs. (B) Mitostress test measuring oxygen consumption rate (OCR) in Ifn-γ-primed macrophages pretreated without or with LPS (10 ng/mL) for 2 or 6 hr before the assay. Following three measurements of basal respiration, sequential injections of oligomycin (OM, 2 μM), carbonyl cyanide-4-phenylhydrazone (FCCP, 0.5, μM) and rotenone and antimycin A (rot/AA, 1 μM) were carried out to determine uncoupled respiration, spare respiratory capacity, and non-mitochondrial respiration, respectively. The assay medium contained minimal DMEM with 5 mM glucose and 1 mM sodium pyruvate, pH 7.4. N = 5 biological replicates. (C) Mitostress test measuring OCR in macrophages without (control, Ctl) or with serum shock resulting from treatment with 50% FBS for 2 hr to synchronize the circadian clock (Synchronized). Cells were recovered in fresh growth medium containing 10% FBS and the assay was performed 16 hr after the serum shock treatment. N = 5 biological replicates. (D) Mitostress test measuring OCR in macrophages without or with acute LPS treatment. Cells were cultured in growth medium with 2% FBS without (Ctl) or with 100 ng/mL LPS for 2 hr (LPS recovery), followed by recovery in fresh growth medium with 2% FBS for 24 hr prior to the assay. N = 5 biological replicates, statistical analysis was performed using two-way ANOVA for Ctl vs LPS recovery across the time course. (E) Extracellular flux analysis of thioglycollate-elicited peritoneal macrophages measuring the changes in ECAR (left panel) and OCR (right panel) following LPS injection (final concentration 1 μg/mL). The assay medium contained 5 mM glucose and 1 mM pyruvate in minimal DMEM with 2% dialyzed FBS, pH 7.4. N = 5 biological replicates, statistical analysis was performed using two-way ANOVA for WT vs M-BKO across the time course. (F) Bmal1 mRNA expression determined by qPCR (left) and protein levels (right) in RAW264.7 macrophage stable lines. Bmal1-OE, Bmal1 overexpressing stable line. Cells that were transduced with empty vector were used as the control. N = 3 biological replicates for qPCR, statistical analysis was performed using Student’s T test. V, vector control; OE, Bmal1 overexpression. (G) Measurement of the changes in ECAR (left) and OCR (right) in Ifn-γ-primed RAW264.7 stable lines after injection with LPS (final concentration 100 ng/mL). The assay medium contained 25 mM glucose and 1 mM pyruvate in minimal DMEM with 2% dialyzed FBS, pH 7.4. N = 5 biological replicates, statistical analysis was performed using two-way ANOVA for control vs Bmal1 OE across the time course. (H) Blood glucose levels in 4-month-old WT and M-BKO male mice before and 6 hr after i.p. injection with 10 μg LPS per g body weight. N = 10 mice, statistical analysis was performed using Student’s T test. (I) Glycolytic stress test in splenic macrophages isolated from mice in panel (D) that were sacrificed 6 hr after LPS injection. ECAR was measured before and after injection with glucose (25 mM). Maximal glycolytic rate was determined by injection of oligomycin (OM, 2 μM). Glycolysis-dependent ECAR was determined by injection of 2-deoxyglucose (2-DG, 50 mM). The assay medium contained minimal DMEM, pH 7.4. N = 10 biological replicates, statistical analysis was performed using two-way ANOVA for WT vs M-BKO across the time course. Data are presented as mean ± S.E.M. *, p<0.05. Experiments were repeated at least twice.
Figure 3.
Figure 3.. Bmal1 deletion induces a metabolic shift for glycolytic and amino-acid metabolism.
(A) Summary of steady-state metabolomics data for differentially regulated metabolites from WT and M-BKO macrophages throughout a 12-hour M1 activation time course. Data are presented as heat maps (normalized to WT control for each metabolite, each panel is the average of four biological replicates). Statistical analysis was performed using two-way ANOVA for WT vs M-BKO across the time course. (B) Box plots of the relative abundances of select metabolites in panel (A). (C, D) Uptake of [3H]−2-deoxyglucose (C) and lactate secretion (D) in control or M1-activated macrophages. N = 3 biological replicates, statistical analysis was performed using Student’s T test. Cell culture assays were repeated at least twice.
Figure 4.
Figure 4.. Bmal1 loss-of-function increases oxidative stress and Hif-1α protein accumulation.
(A) Immunoblots of Hif-1α and Bmal1 protein levels in WT and M-BKO macrophages during a 24-hr time course of M1 activation. (B) Relative expression of Hif-1α target genes in WT, M-BKO and M-HKO macrophages determined by qPCR. N = 3 biological replicates, statistical analysis was performed using two-way ANOVA for WT vs M-BKO or WT vs M-HKO across the time course. (C) Measurement of mROS using MitoSox Red (mean fluorescence intensity, MFI) in mitochondria isolated from control or M1-activated macrophages. Succinate (Suc, 10 mM) was included during MitoSox Red staining where indicated. N = 3 biological replicates, statistical analysis was performed using two-way ANOVA for WT vs M-BKO across the time course. (D) Hif-1α protein levels in control or 8-hr M1-activated macrophages co-treated with or without N-acetylcysteine (NAC) or 10 mM dimethylmalonate (DMM). Data are presented as mean ± S.E.M. *, p<0.05 for WT vs M-BKO and p<0.05 for WT vs M-HKO. Experiments were repeated at least twice.
Figure 4—figure supplement 1.
Figure 4—figure supplement 1.. Increased oxidative stress and Hif-1α activity in M1 activated M-BKO macrophages.
(A) Hif-1α protein levels in M1-activated (primed with 10 ng/mL Ifn-γ and stimulated with 50 ng/mL LPS) control and Bmal1-OE RAW264.7 stable lines. (B, C) Uptake of [3H]−2-deoxyglucose and lactate secretion in control or M1-activated macrophages. N = 3 biological replicates, statistical analysis was performed using Student’s T test. M-BHdko: myeloid-specific Bmal1 and Hif1a double knockout. (D) Glycolytic stress test in Ifn-γ-primed macrophages measuring ECAR following glucose (25 mM) injection without or with LPS (100 ng/mL). Maximal glycolytic rate was determined by injection of oligomycin (OM, 2 μM), and glycolysis-dependent ECAR was determined by injection of 2-deoxyglucose (2-DG, 50 mM). The assay medium contained minimal DMEM with 2% dialyzed FBS, pH 7.4. N = 5 biological replicates. The difference between LPS-treated WT and M-BHdKO macrophages was determined by two-way ANOVA across the time course. (E) Expression of Nrf2 target genes determined by qPCR throughout a 24-hr time course following M1 stimulation. N = 3 biological replicates, statistical analysis was performed using two-way ANOVA for WT vs M-BKO across the time course. Data are presented as mean ± S.E.M. *, p<0.05. Experiments were repeated at least twice.
Figure 5.
Figure 5.. Genes involved in amino-acid uptake and catabolism are upregulated in M-BKO macrophages.
(A) Schematic representation of M1-regulated genes involved in amino-acid and TCA metabolism determined by RNA-seq. Genes in blue are downregulated whereas genes in red are upregulated by 8 hours M1 activation in both WT and M-BKO macrophages. Genes that are differentially regulated in these two genotypes are displayed in heat maps on the right. F.C., fold change. N = 3 biological replicates. BCAAs, branch chain amino acids; Keto AAs, ketogenic amino acids; Cic, mitochondrial citrate carrier. (B) Relative expression of differentially regulated genes identified by RNA-seq and validated by qPCR in a 24-hr time course of M1 activation. N = 3 biological replicates, statistical analysis was performed using two-way ANOVA for WT vs M-BKO across the time course. (C) Hif-1α protein levels in control or 6-hr M1-activated macrophages with or without co-treatment of the neutral amino-acid transport inhibitor 2-amino-2-norbornanecarboxylic acid (BCH, 10 mM). (D) Gene expression in control or 6-hr M1-activated macrophages with or without co-treatment of 10 mM BCH and/or the complex II inhibitor dimethyl malonate (DMM, 10 mM) determined by qPCR. N = 3 biological replicates, statistical analysis was performed using Student’s T test. Data are presented as mean ± S.E.M. *, p<0.05. Cell culture experiments were repeated at least twice.
Figure 5—figure supplement 1.
Figure 5—figure supplement 1.. Transcriptome analysis of genes that are regulated by M1 stimulation in WT and M-BKO macrophages.
(A) Functional annotation clustering by biological process and Venn diagram of genes identified by RNA-seq that are mutually induced (2379 genes, left) or suppressed (2644 genes, right) by 8-h M1 activation in WT and M-BKO macrophages. N = 3 biological replicates. F.C., fold change. (B) Enriched biological processes associated with genes that are differentially expressed in M1-activated WT and M-BKO macrophages. (C) Relative expression of the neutral amino-acid transporter Slc7a8 (Lat2) in WT and myeloid Hif1a knockout (M-HKO) macrophages as determined by qPCR. WT samples were from Figure 5B. N = 3 biological replicates, statistical analysis was performed using two-way ANOVA for WT vs M-HKO across the time course. (D) Determination of glutamine utilization by extracellular flux analysis. OCR was measured before and after LPS injection (final concentration 1 μg/mL), and the assay medium contained 5 mM glutamine in minimal DMEM with 2% dialyzed FBS, pH 7.4. N = 5 biological replicates, statistical analysis was performed using two-way ANOVA for WT vs M-BKO and for WT or M-BKO vs M-BKO cells co-treated with the neutral amino-acid transport inhibitor 2-amino-2-norbornanecarboxylic acid (BCH, 10 mM) across the time course. Data are presented as mean ± S.E.M. *, p<0.05. Cell culture experiments were repeated at least twice.
Figure 6.
Figure 6.. Bmal1 regulates tumor-associated macrophage polarization.
(A) Bmal1 gene expression (left panel) and protein levels (right panel) in WT macrophages treated with control medium or increasing doses of B16-F10 tumor-conditioned medium (T-CM, diluted 1:3 or 1:1 with control medium) for 8 hr. N = 3 biological replicates for qPCR, statistical analysis was performed using Student’s T test. (B) Measurement of mROS using MitoSox Red (mean fluorescent intensity, MFI) in mitochondria from macrophages treated with control medium or T-CM diluted 1:1 with control medium for 1 hr. N = 3 biological replicates, statistical analysis was performed using Student’s T test. (C) Hif-1α protein levels in WT and M-BKO macrophages treated with control medium, T-CM diluted 1:1 with control medium, or undiluted T-CM for 4 hr. (D) Glycolytic stress test in macrophages pretreated with control medium or T-CM diluted 1:1 with control medium for 4 hr. N = 5 biological replicates. Statistical analysis was performed using two-way ANOVA comparing T-CM-treated M-BKO with WT cells across the time course. (E) Relative expression of genes involved in amino-acid metabolism and oxidative stress response in macrophages treated with control medium or T-CM diluted 1:3 with control medium for 8 hr, as determined by qPCR. N = 3 biological replicates, statistical analysis was performed using Student’s T test. (F) Tumor volume in male (left) and female (right) WT and M-BKO mice. 300,000 B16-F10 cells were injected subcutaneously into the right flank. N = 18 (male) and 8 (female) mice, statistical analysis was performed using two-way ANOVA for WT vs M-BKO mice across the time course. (G) Gene expression for F4/80+ cells isolated from B16-F10 tumors or spleens of female mice 14 days after injection. Tissues from six mice per genotype were pooled into three groups for leukocyte isolation. Statistical analysis was performed using Student’s T test. Data are presented as mean ± S.E.M. *, p<0.05. Experiments were repeated at least twice.
Figure 6—figure supplement 1.
Figure 6—figure supplement 1.. Increased mROS levels and glucose uptake in M-BKO TAMs.
(A) Tumor volumes of B16-F10 subcutaneous allografts in 3-month-old female WT and M-BKO mice 14 days after tumor cell injection. Each mouse was injected with 500,000 B16-F10 cells in the right and left flanks, and tumors from each mouse were pooled for immune cell isolation and flow cytometry. N = 4 mice, with two tumors per mouse. (B, C) mROS production and glucose uptake by tumor-associated CD45+F4/80+ cells determined by flow cytometry (mean fluorescent intensities) of Mitosox Red and 2-NBDG staining, respectively. N = 4. Statistical analysis was performed using Student’s T test. Data are presented as mean ± S.E.M. *, p<0.05.
Figure 7.
Figure 7.. Macrophage Bmal1 modulates the antitumor activity.
(A) Tumor volume in WT male mice co-injected with 500,000 B16-F10 cells and either 500,000 WT or M-BKO macrophages as indicated. N = 22 mice, statistical analysis was performed using two-way ANOVA to compare WT vs M-BKO macrophage co-injection across the time course. (B) Flow cytometric analysis of tumor-infiltrating CD8+ T cells (CD45+CD3+CD8a+ cells, left panel) and NK cells (CD45+CD3NK1.1+ cells, right panel) stimulated ex vivo with phorbol 12-myristate 13-acetate and ionomycin for Ifn-γ co-staining. Tumors represented in panel (A) were pooled into three groups prior to isolation of infiltrating leukocytes for flow cytometry. Statistical analysis was performed using Student’s T test. (C) Tumor volume in WT male mice co-injected with 500,000 B16-F10 cells and either 500,000 WT or M-BKO macrophages, supplemented without or with dimethylmalonate (DMM, approximately 150 mg/kg body weight per day in mouse diet). N = 8 mice, statistical analysis was performed using two-way ANOVA to compare WT vs M-BKO macrophage co-injection on control diet, or to compare WT macrophage co-injection on the control diet vs WT or M-BKO macrophage co-injection on the DMM-supplemented diet across the time course. Data are presented as mean ± S.E.M. *, p<0.05. Experiments were repeated at least twice.
Figure 7—figure supplement 1.
Figure 7—figure supplement 1.. Macrophage Bmal1 regulates tumor growth in a cell-autonomous manner.
(A) Tumor volume in M-BKO male mice co-injected with 500,000 B16-F10 cells and either 500,000 WT or M-BKO macrophages as indicated. N = 6 mice, statistical analysis was performed using two-way ANOVA to compare WT vs M-BKO macrophage co-injection across the time course. (B) Flow cytometric analyses of tumor-infiltrating CD8+ T cells (CD45+CD3+CD8a+ cells, left panel) and NK cells (CD45+CD3NK1.1+ cells, right panel) stimulated ex vivo with phorbol 12-myristate 13-acetate and ionomycin for Ifn-γ co-staining. Tumors that are represented in panel (A) were pooled into three groups prior to isolation of infiltrating leukocytes for flow cytometric analyses. Statistical analysis was performed using Student’s T test. Data are presented as mean ± S.E.M. *, p<0.05. (C) Hif-1α protein levels in WT macrophages treated with (from left to right) control medium or B16-F10 tumor-conditioned medium (T–CM) diluted 1:1 with control medium without or with co-treatment with 10 mM dimethyl malonate (DMM) for 4 hr. (D) Arg1 gene expression in WT macrophages treated as in panel (C) for 8 hr. N = 3 biological replicates. Statistical analysis was performed using Student’s T test. Experiments were repeated at least twice. (E) Schematic showing the working model for Bmal1–Hif-1α crosstalk in the regulation of macrophage bioenergetics and effector functions. Both M1 and tumor-associated macrophages share similar energetically stressed states. Bmal1 preserves mitochondrial oxidative metabolism while reducing oxidative stress to modulate Hif-1α activity and support proper effector functions. Deletion of Bmal1 in the macrophage leads to reliance on glycolytic metabolism and alternative fuel utilization, notably amino-acid metabolism, which further promotes mROS production and Hif-1α protein stabilization. Increased amino-acid utilization by M-BKO macrophages may lead to depletion of amino acids that are critical for lymphocyte activation and cytotoxic function, thereby suppressing anti-tumor immunity in the tumor microenvironment.
Author response image 1.

Similar articles

Cited by

References

    1. Andrejeva G, Rathmell JC. Similarities and distinctions of Cancer and immune metabolism in inflammation and tumors. Cell Metabolism. 2017;26:49–70. doi: 10.1016/j.cmet.2017.06.004. - DOI - PMC - PubMed
    1. Arts RJ, Plantinga TS, Tuit S, Ulas T, Heinhuis B, Tesselaar M, Sloot Y, Adema GJ, Joosten LA, Smit JW, Netea MG, Schultze JL, Netea-Maier RT. Transcriptional and metabolic reprogramming induce an inflammatory phenotype in non-medullary thyroid carcinoma-induced macrophages. OncoImmunology. 2016;5:e1229725. doi: 10.1080/2162402X.2016.1229725. - DOI - PMC - PubMed
    1. Bell EL, Klimova TA, Eisenbart J, Moraes CT, Murphy MP, Budinger GR, Chandel NS. The qo site of the mitochondrial complex III is required for the transduction of hypoxic signaling via reactive oxygen species production. Journal of Cell Biology. 2007;177:1029–1036. doi: 10.1083/jcb.200609074. - DOI - PMC - PubMed
    1. Buck MD, Sowell RT, Kaech SM, Pearce EL. Metabolic instruction of immunity. Cell. 2017;169:570–586. doi: 10.1016/j.cell.2017.04.004. - DOI - PMC - PubMed
    1. Canaple L, Rambaud J, Dkhissi-Benyahya O, Rayet B, Tan NS, Michalik L, Delaunay F, Wahli W, Laudet V. Reciprocal regulation of brain and muscle Arnt-like protein 1 and peroxisome proliferator-activated receptor alpha defines a novel positive feedback loop in the rodent liver circadian clock. Molecular Endocrinology. 2006;20:1715–1727. doi: 10.1210/me.2006-0052. - DOI - PubMed

Publication types

MeSH terms

Associated data