. 2020 Nov;15(11):1213-1227.
doi: 10.1080/15592294.2020.1762368. Epub 2020 May 12.

A novel CpG-methylation-based nomogram predicts survival in colorectal cancer

Affiliations

A novel CpG-methylation-based nomogram predicts survival in colorectal cancer

Xiaokang Wang et al. Epigenetics. 2020 Nov.

Abstract

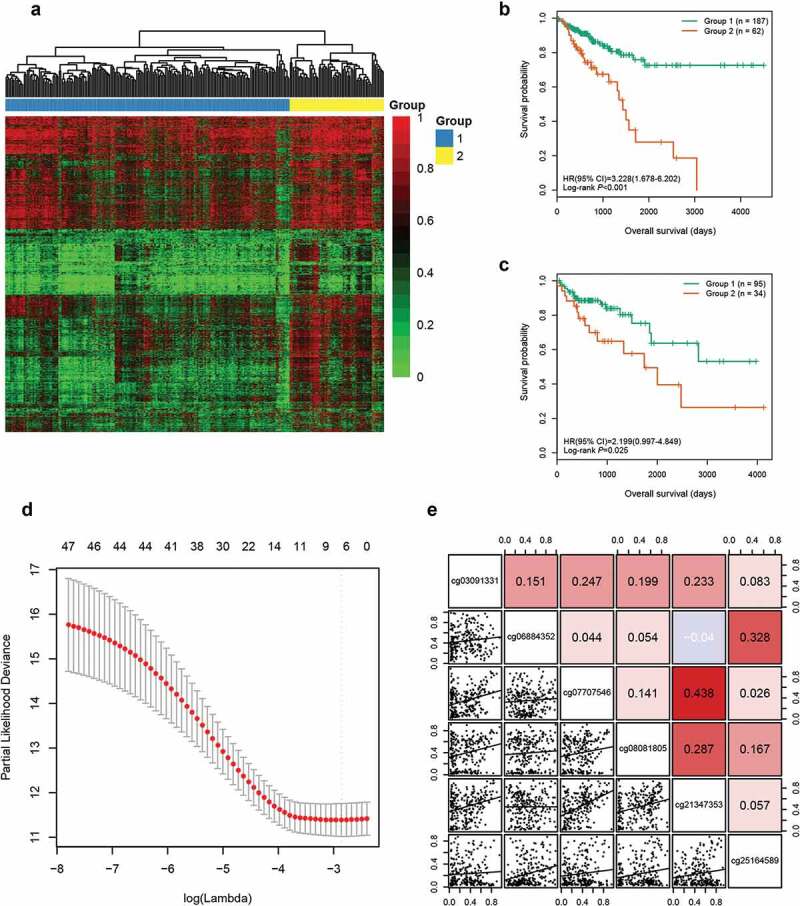
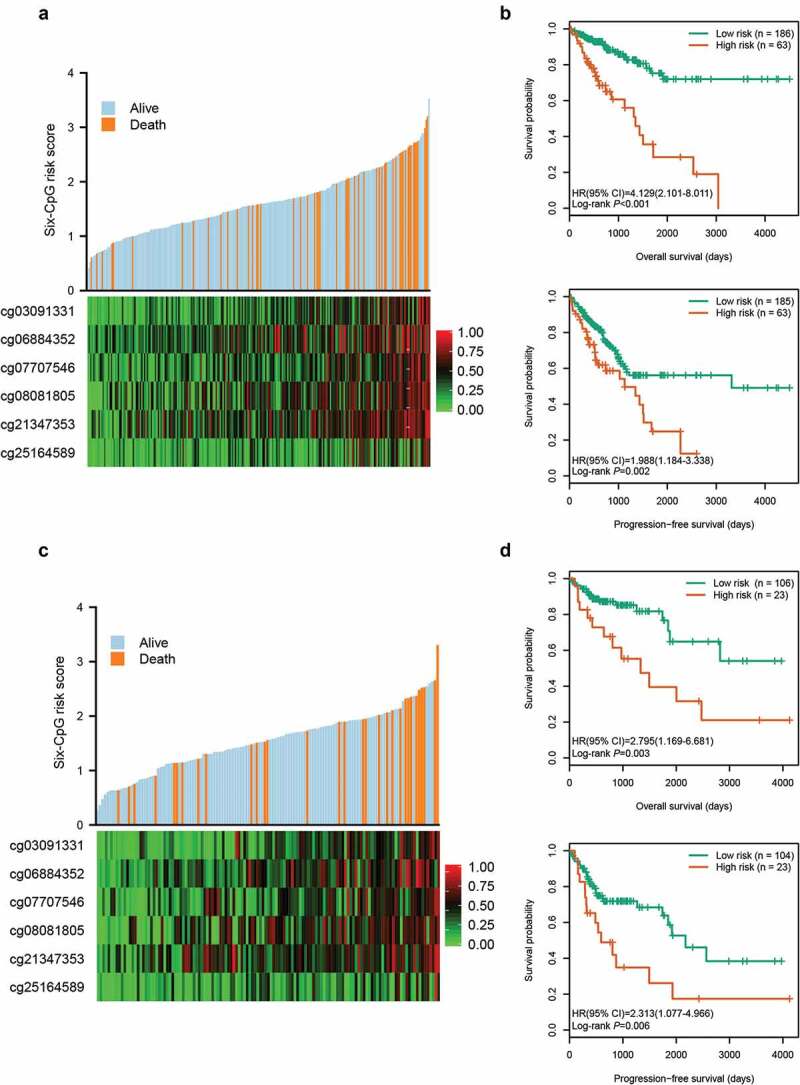
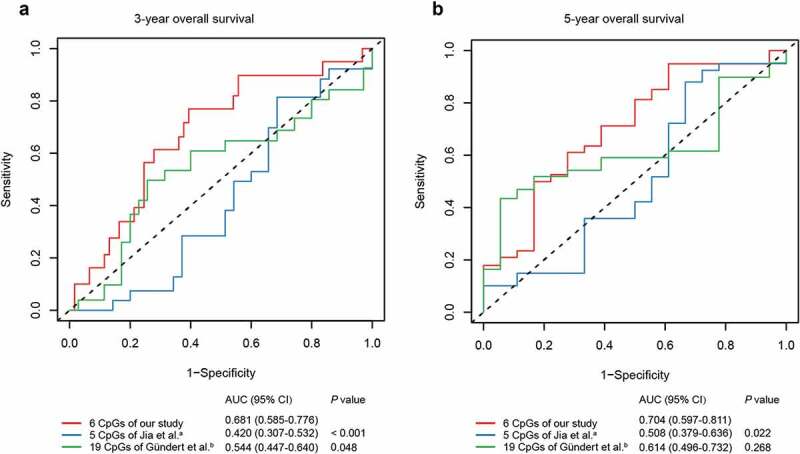
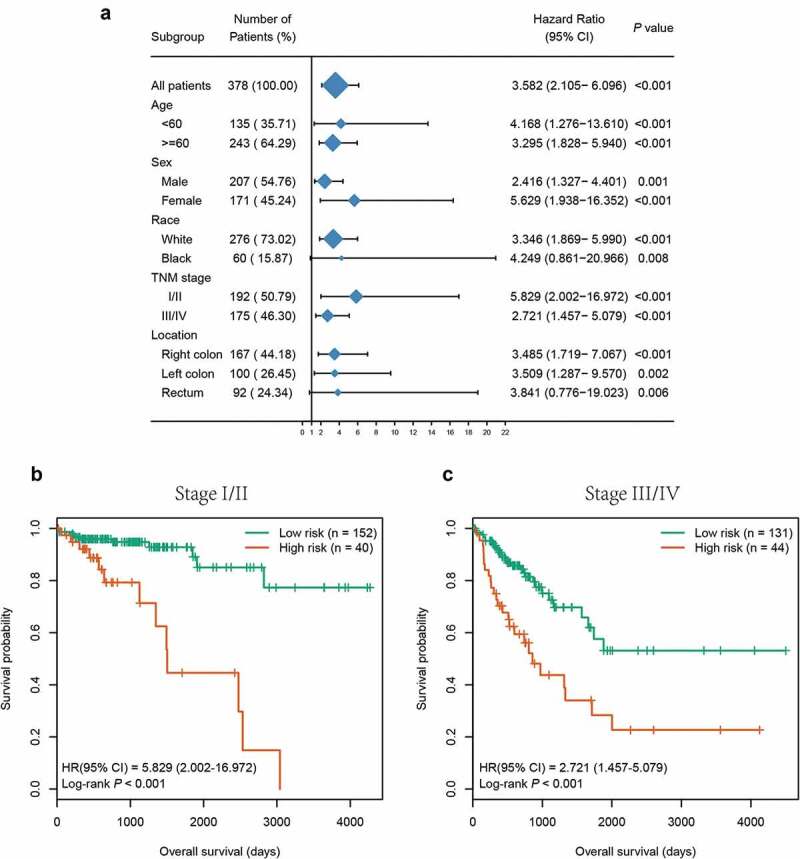
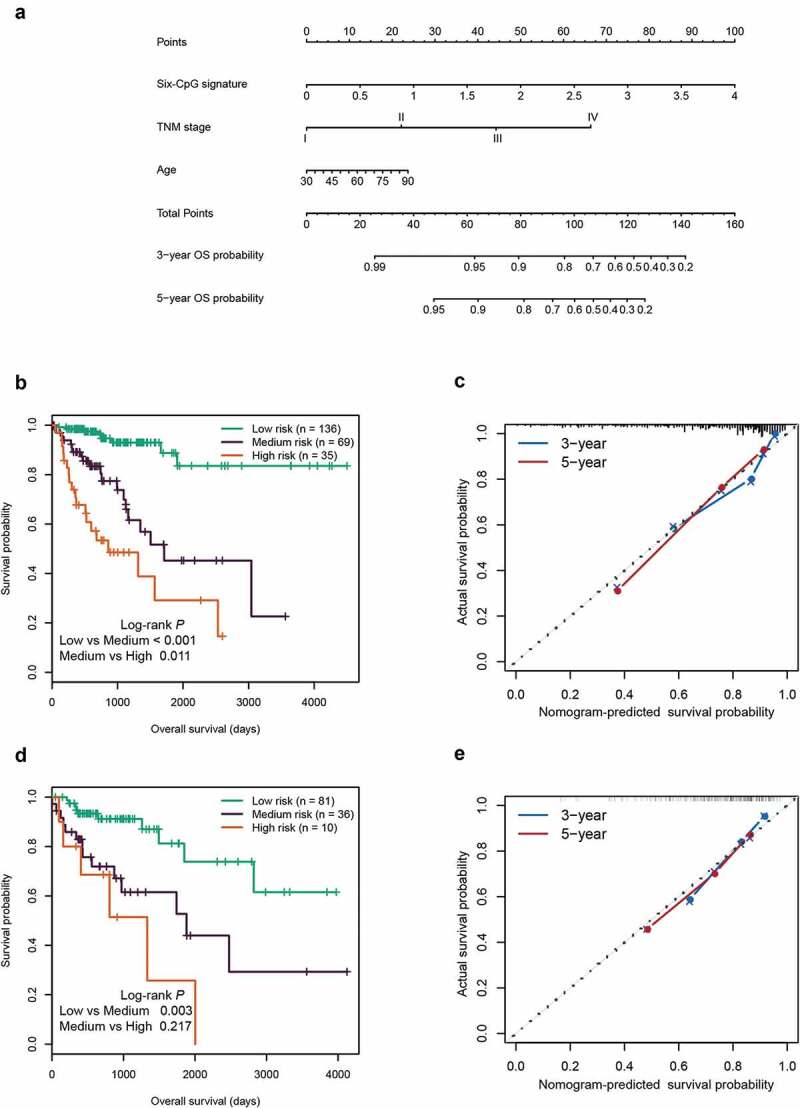
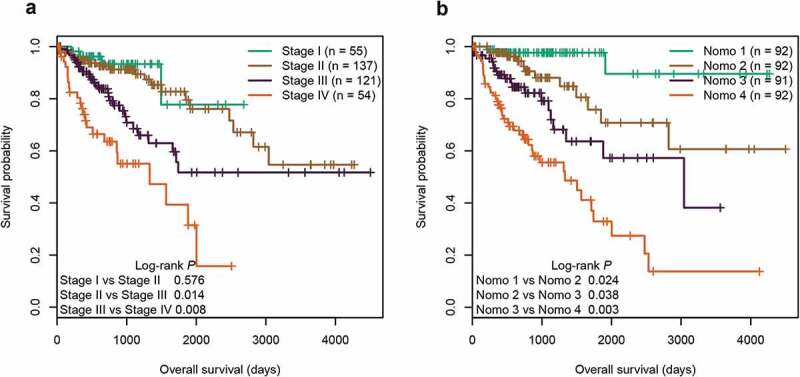
Aberrant DNA methylation is significantly associated with the prognosis of patients with colorectal cancer (CRC). Therefore, the aim of this study was to develop a CpG-methylation-based nomogram for prognostic prediction in CRC. First, 378 CRC patients with methylation data from The Cancer Genome Atlas were randomly divided into training cohort (n = 249) and test cohort (n = 129). A multistep screening strategy was performed to identify six CpG sites that were significantly associated with overall survival in the training cohort. Then, Cox regression modelling was performed to construct a prognostic signature based on the candidate CpG sites. The six-CpG signature successfully separated patients into high-risk and low-risk groups in both training and test cohorts, and its performance was superior to that of previously published methylation markers (P < 0.05). Furthermore, we established a prognostic nomogram incorporating this signature, TNM stage, and age. The nomogram exhibited better prediction for overall survival in comparison with the three independent prognostic factors in the training cohort (C-index: 0.798 vs 0.620 to 0.737; P < 0.001). In the test cohort, the performance of nomogram was also superior to that of the three independent prognostic factors (C-index: 0.715 vs 0.590 to 0.665; P < 0.05). Meanwhile, the calibration curves for survival probability showed good agreement between prediction by nomogram and actual observation in both training and test cohorts. Together, the present study provides a novel CpG-methylation-based nomogram as a promising predictor for overall survival of CRC patients, which may help improve decision-making regarding the personalized treatments of patients with CRC.

Keywords: DNA methylation; colorectal cancer; nomogram; prognosis; survival analysis.


Conflict of interest statement

No potential conflict of interest was reported by the authors.

Figures

Figure 1.
Figure 1.
Identification of six candidate CpGs in the training cohort. (a) Unsupervised hierarchical clustering and heatmap for 249 CRC patients based on 3299 CpGs associated with OS. Each column corresponds to an individual patient and each row corresponds to an individual CpG. (b) Kaplan-Meier survival curves of the two groups generated by the clustering. (c) Kaplan-Meier survival curves of the two groups generated by the supervised hierarchical clustering in the test cohort. (d) Ten-fold cross-validation for regularized cox regression with L1 penalty identified six candidate CpGs. The two dotted vertical lines are drawn at the optimal values by minimum criteria and 1-standard error criteria, respectively. The tuning parameter λ = 0.057 with log (λ) = −2.863 was determined by minimum criteria. (e) Correlations among the methylation levels of the six CpGs
Figure 2.
Figure 2.
Risk score distribution and survival analysis of the six-CpG signature in training and test cohorts. The distribution of risk score, survival status, and CpG methylation level for patients in training cohort (a) and test cohort (c). Kaplan–Meier survival curves of the OS and PFS of patients using the six-CpG signature in training cohort (b) and test cohort (d)
Figure 3.
Figure 3.
Correlations among CpG methylation, gene expression, and OS. (a–f) Kaplan‐Meier survival curves of six CpGs in 378 CRC patients. (g) Kaplan‐Meier survival curves of NPY2R gene in 580 CRC patients. The optimal cut-off was determined by the X-tile plots. Colouration of the plot represents the strength of the association at each division, ranging from low (dark, black) to high (green or red). Red represents the inverse association between the risk score and OS, whereas green represents a direct association. The dark dots in the X-tile plots are the cut-off points based on the highest χ2-value with Kaplan–Meier survival analysis. Hyper: Hypermethylation; Hypo: Hypomethylation; HE: High expression; LE: Low expression
Figure 4.
Figure 4.
GSEA analysis between the high- and low-risk groups in the entire cohort. Enrichment plots of representative gene sets in the high-risk group (FDR < 0.01)
Figure 5.
Figure 5.
ROC curves of the six-CpG signature and other prognostic methylation markers in test cohort for predicting OS at 3 years (a) and 5 years (b). aJia et al. reported seven CpGs as prognostic markers in CRC. Five of them had methylation values in TCGA-COAD and TCGA-READ datasets. bGündert et al. reported 20 CpGs as prognostic markers in CRC. Nineteen of them had methylation values in TCGA-COAD and TCGA-READ datasets
Figure 6.
Figure 6.
Subgroup analysis of the six-CpG signature in the entire cohort. (a) The results of Kaplan–Meier survival analysis of the six-CpG signature in different subgroups stratified by clinicopathological characteristics. Kaplan–Meier survival curves of the six-CpG signature in patients with different TNM stage, including stage I/II (b) and stage III/IV (c)
Figure 7.
Figure 7.
Construction and validation of the prognostic nomogram. (a) Nomogram for predicting the 3-year and 5-year OS of patients with CRC. Kaplan‐Meier curves of three subgroups stratified by the total points of the nomogram in training cohort (b) and test cohort (d). The calibration curves for predicting the 3-year and 5-year OS in the training cohort (c) and test cohort (e)
Figure 8.
Figure 8.
Kaplan‐Meier survival curves of four subgroups stratified by TNM staging system (a) or the total points of the nomogram (b) in the entire cohort

Similar articles

Cited by

References

    1. Bray F, Ferlay J, Soerjomataram I, et al. Global cancer statistics 2018: GLOBOCAN estimates of incidence and mortality worldwide for 36 cancers in 185 countries. CA Cancer J Clin. 2018. November;68(6):394–424. . - PubMed
    1. Guraya SY, Pattern S.. Time of recurrent colorectal cancer after curative surgery. Clin Colorectal Cancer. 2019. June;18(2):e223–e228. - PubMed
    1. Lin HH, Wei NC, Chou TY, et al. Building personalized treatment plans for early-stage colorectal cancer patients. Oncotarget. 2017. February 21;8(8):13805–13817. - PMC - PubMed
    1. Sahnane N, Magnoli F, Bernasconi B, et al. Aberrant DNA methylation profiles of inherited and sporadic colorectal cancer. Clin Epigenetics. 2015. December 21;7:131. . - PMC - PubMed
    1. Weisenberger DJ, Siegmund KD, Campan M, et al. CpG island methylator phenotype underlies sporadic microsatellite instability and is tightly associated with BRAF mutation in colorectal cancer. Nat Genet. 2006. July;38(7):787–793. . - PubMed

Publication types

Substances