Review
. 2020 Oct 1;41(5):733-755.
doi: 10.1210/endrev/bnaa015.

The Evolution of Insulin and How it Informs Therapy and Treatment Choices

Affiliations
Review

The Evolution of Insulin and How it Informs Therapy and Treatment Choices

Irl B Hirsch et al. Endocr Rev. .

Abstract

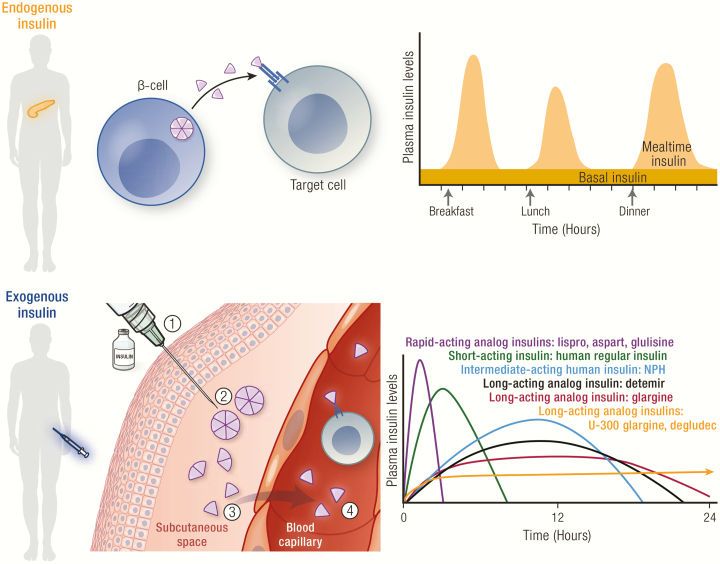
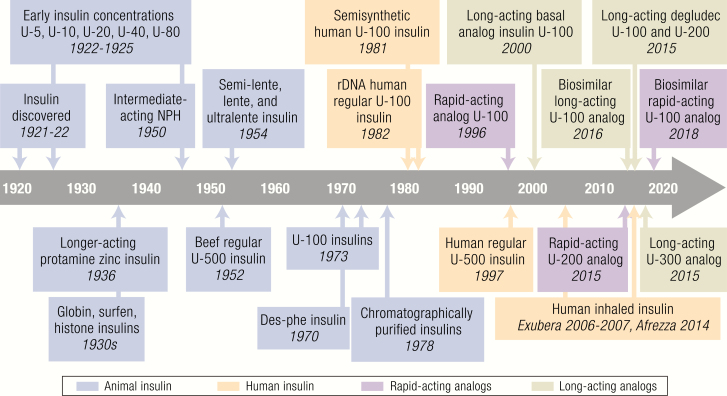
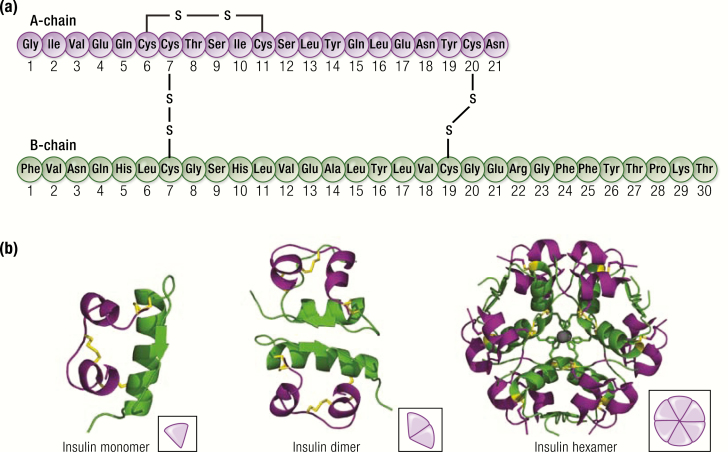
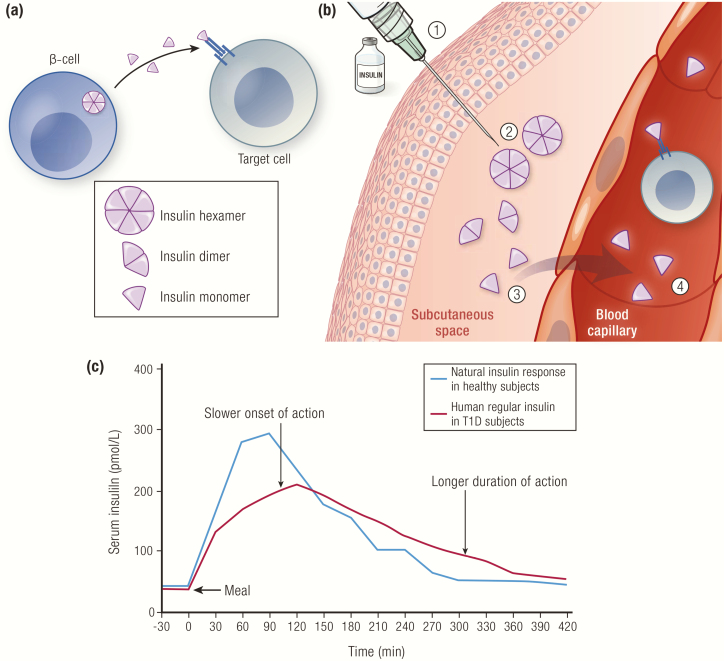
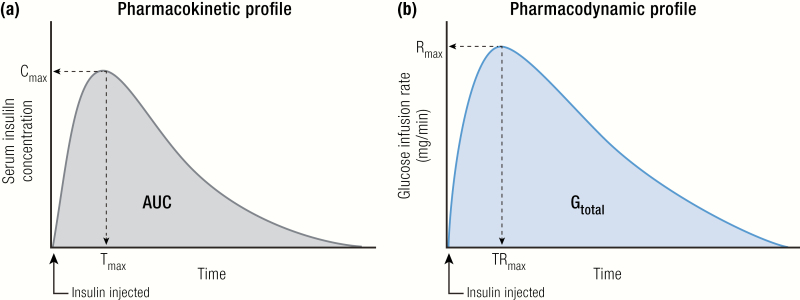
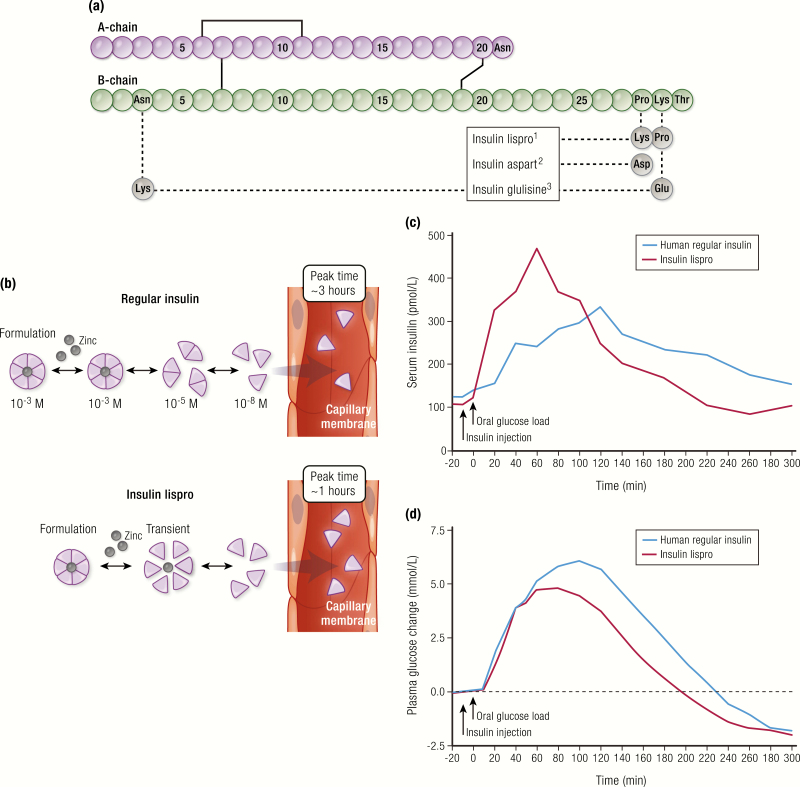
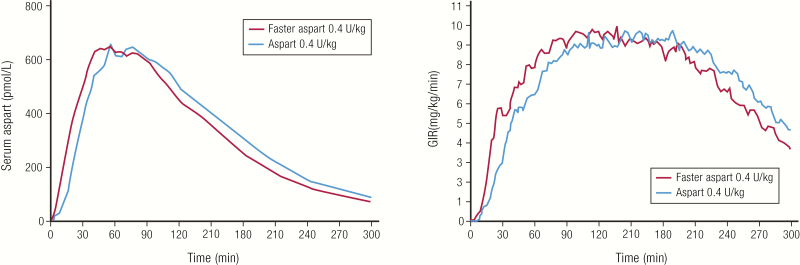
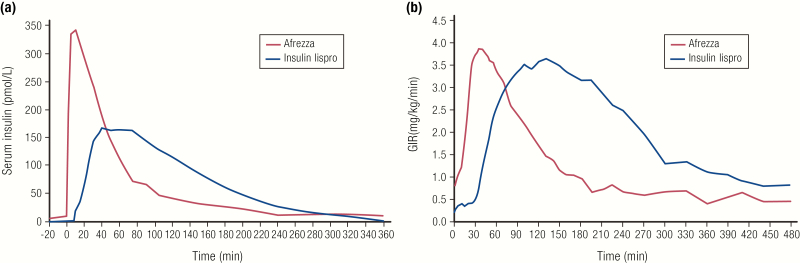
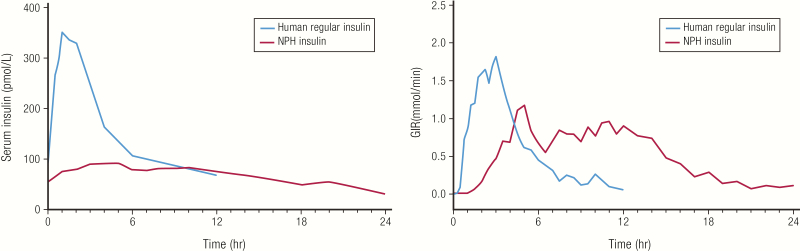
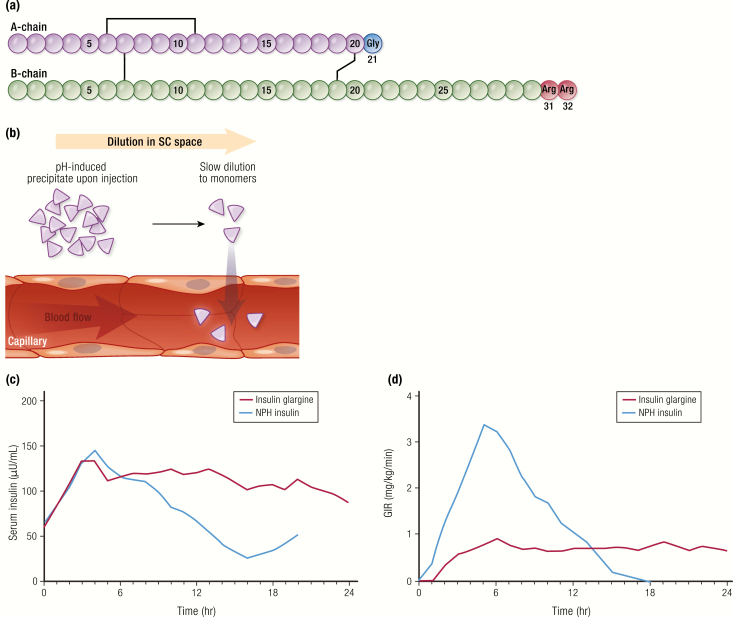
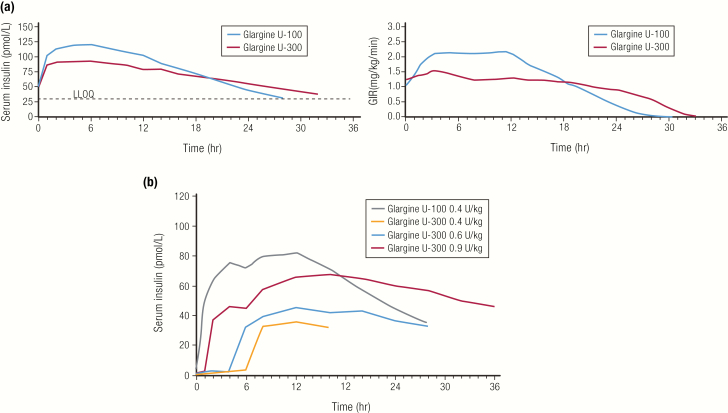
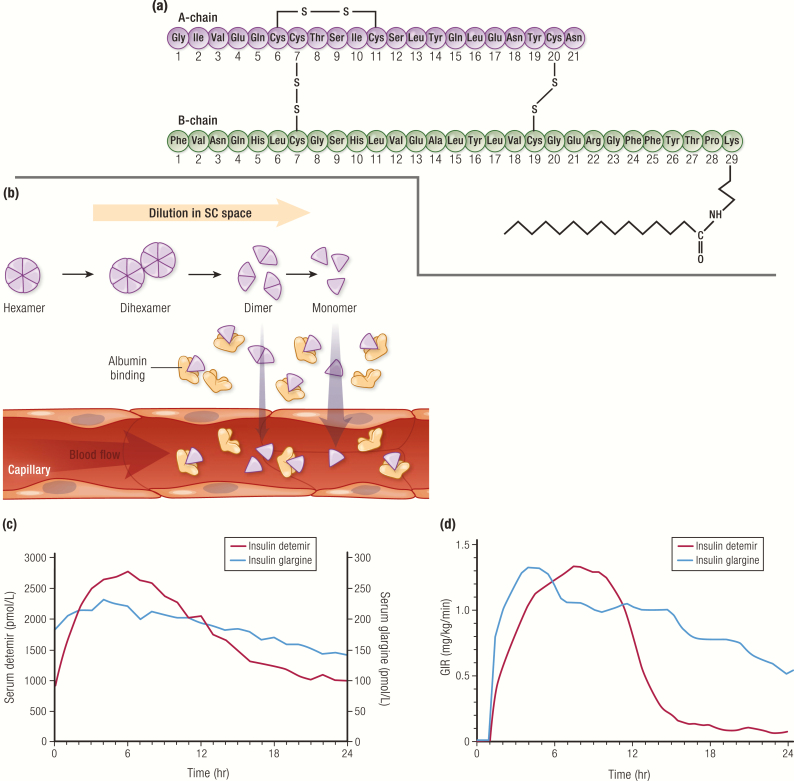
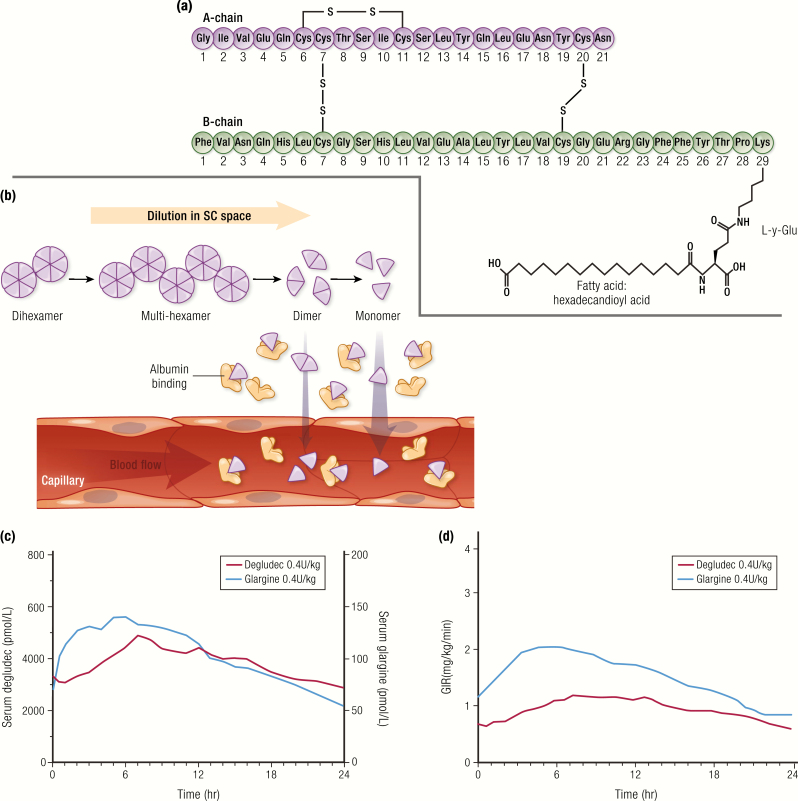
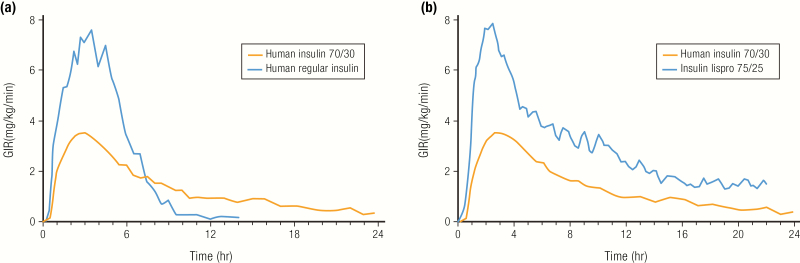
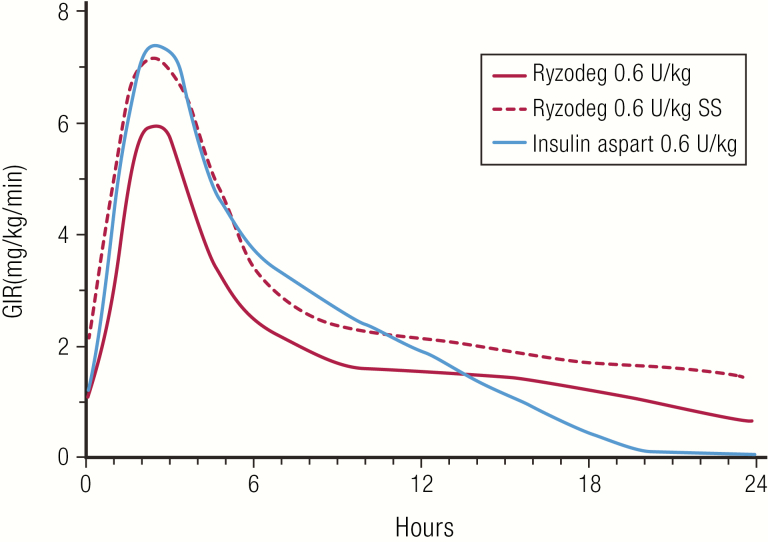
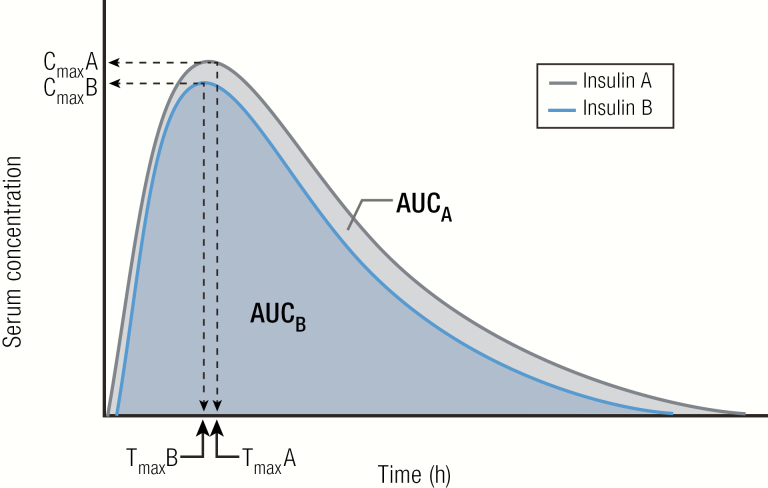
Insulin has been available for the treatment of diabetes for almost a century, and the variety of insulin choices today represents many years of discovery and innovation. Insulin has gone from poorly defined extracts of animal pancreata to pure and precisely controlled formulations that can be prescribed and administered with high accuracy and predictability of action. Modifications of the insulin formulation and of the insulin molecule itself have made it possible to approximate the natural endogenous insulin response. Insulin and insulin formulations had to be designed to produce either a constant low basal level of insulin or the spikes of insulin released in response to meals. We discuss how the biochemical properties of endogenous insulin were exploited to either shorten or extend the time-action profiles of injectable insulins by varying the pharmacokinetics (time for appearance of insulin in the blood after injection) and pharmacodynamics (time-dependent changes in blood sugar after injection). This has resulted in rapid-acting, short-acting, intermediate-acting, and long-acting insulins, as well as mixtures and concentrated formulations. An understanding of how various insulins and formulations were designed to solve the challenges of insulin replacement will assist clinicians in meeting the needs of their individual patients.

Keywords: insulin; long-acting; pharmacodynamics; pharmacokinetics; rapid-acting.


Figures

Graphical Abstract
Graphical Abstract
Figure 1.
Figure 1.
Timeline of insulin development with approximate historical dates. Abbreviations: NPH, neutral protamine Hagedorn; rDNA, recombinant DNA; U = units.
Figure 2.
Figure 2.
Structure of human insulin. A: Amino acid sequence of human insulin. B: Three-dimensional structure of insulin monomer (A-chain in purple; B-chain in green; protein data bank [PDB] ID = 1LPH), insulin dimer (PDB ID = 1LPH), and insulin hexamer (comprised of 3 dimers and 2 Zn2+) (PDB ID = 2INS). (https://www.rcsb.org/pdb/static.do?p=general_information/about_pdb/index.html); 1LPH, 2INS=PDB ID for respective structures)
Figure 3.
Figure 3.
Role of insulin hexamers in insulin PK. A: Insulin hexamers in pancreatic β-cells disassemble into monomers upon dilution in the blood stream and diffuse into tissues where they bind to insulin receptors on target cells. B: (1) Regular insulin is formulated as hexamers in the presence of zinc; (2) insulin is injected into the SC space; (3) insulin hexamers dissociate into dimers then monomers in the SC space; (4) the size of the monomers permits absorption across the microvascular endothelium into the blood. C: Pharmacokinetics profile of endogenous insulin (blue line) following a meal in healthy subjects (n = 6), and of exogenous insulin (red line) when human regular insulin (0.1 U/kg SC) was injected 5 minutes before the meal in subjects with type 1 diabetes (n = 6). Data from Pampanelli S, Torlone E, Ialli C, Del Sindaco P, Ciofetta M, Lepore M, et al. Improved postprandial metabolic control after subcutaneous injection of a short-acting insulin analog in IDDM of short duration with residual pancreatic beta-cell function. Diabetes Care. 1995;18(11):1452–1459.
Figure 4.
Figure 4.
Pharmacokinetics and PD profiles, explained. A: Pharmacokinetics profile: insulin concentration versus time after injection. B: Pharmacodynamics profile: GIR versus time after insulin injection. Abbreviations: AUC, area under the curve; Cmax, maximum concentration reached; Gtotal, total amount of glucose infused; Rmax, maximum rate of glucose infusion; Tmax, time to reach Cmax; TRmax, time to reach Rmax.
Figure 5.
Figure 5.
Rapid-acting insulins. A: Amino acid changes in the structures of rapid-acting insulin analogs. B: Quicker hexamer dissolution in the interstitial space of insulin lispro compared to regular insulin. C: Pharmacokinetics profile of insulin lispro compared to human regular insulin, showing a faster onset of action and peak of action, and a shorter duration of action when 0.075 U/kg of insulin was injected 10 minutes before a 50 g 13C-glucose load after an overnight fast (N = 8 subjects with type 2 diabetes). D: Pharmacodynamics profile from the same study, showing 13C-labeled serum glucose concentration during the study, corrected for 3H-labeled baseline glucose. Data for (C) and (D) from Bruttomesso D, Pianta A, Mari A, Valerio A, Marescotti MC, Avogaro A, et al. Restoration of early rise in plasma insulin levels improves the glucose tolerance of type 2 diabetic patients. Diabetes. 1999;48(1):99–105.
Figure 6.
Figure 6.
Faster-acting insulin aspart. A: Pharmacokinetics and PD profiles of faster aspart compared to aspart in 43 subjects with type 1 diabetes. Euglycemic clamp studies were conducted in a crossover fashion such that each subject was tested with 3 different doses of each insulin. The results for the 0.4 U/kg dose are shown. Data from Heise T, Stender-Petersen K, Hovelmann U, Jacobsen JB, Nosek L, Zijlstra E, et al. Pharmacokinetic and pharmacodynamic properties of faster-acting insulin aspart versus insulin aspart across a clinically relevant dose range in subjects with type 1 diabetes mellitus. Clin Pharmacokinet. 2017;56(6):649–660.
Figure 7.
Figure 7.
Afrezza® inhaled insulin. A: Pharmacokinetics profile (baseline corrected serum insulin concentration) of inhaled Afrezza® (8 units) compared to injected insulin lispro (8 units) in 12 subjects with type 1 diabetes. B: Pharmacodynamics profile of inhaled Afrezza® (8 units) compared to injected insulin lispro (10 units) in 25 subjects with type 1 diabetes. Both studies were euglycemic clamp studies. Data from Heinemann L, Baughman R, Boss A, Hompesch M. Pharmacokinetic and pharmacodynamic properties of a novel inhaled insulin. J Diabetes Sci Technol. 2017;11(1):148–156.
Figure 8.
Figure 8.
Neutral protamine hagedorn insulin. A: Pharmacokinetics and PD profiles of human NPH insulin (n = 6; 25 units SC) compared to human regular insulin (n = 10; 10 units SC) in healthy men. Subjects were fasted overnight prior to injection and kept under a euglycemic clamp for 24 hours or 12 hours, respectively. Data from Woodworth JR, Howey DC, Bowsher RR. Establishment of time-action profiles for regular and NPH insulin using pharmacodynamic modeling. Diabetes Care. 1994;17(1):64–69.
Figure 9.
Figure 9.
Insulin glargine. A: Amino acid structure of insulin glargine. B: Mechanism of protraction of insulin glargine: pH-induced precipitation at the SC space. C and D: Pharmacokinetics and PD profiles of insulin glargine U-100 compared to NPH insulin (each 0.3 U/kg) from a euglycemic clamp study in 20 subjects with type 1 diabetes. Data from Lepore M, Pampanelli S, Fanelli C, Porcellati F, Bartocci L, Di Vincenzo A, et al. Pharmacokinetics and pharmacodynamics of subcutaneous injection of long-acting human insulin analog glargine, NPH insulin, and ultralente human insulin and continuous subcutaneous infusion of insulin lispro. Diabetes. 2000;49(12):2142–2148.
Figure 10.
Figure 10.
Nonbioequivalence of U-100 and U-300 glargine. A: Comparison of PK and PD profiles for insulin glargine U-100 and insulin glargine U-300 (0.4 U/kg each) in a euglycemic clamp study at steady state in 18 patients with type 1 diabetes. Data from Becker RH, Dahmen R, Bergmann K, Lehmann A, Jax T, Heise T. New insulin glargine 300 Units/mL provides a more even activity profile and prolonged glycemic control at steady state compared with insulin glargine 100 Units/mL. Diabetes Care. 2015; 38(4):637–643. B: Dose dependence of PK profile of insulin glargine U-300 in a euglycemic clamp study in 24 patients with type 1 diabetes. Data from Center for Drug Evaluation and Research. Clinical Pharmacology Review: Toujeo® insulin glargine. 2014; https://www.accessdata.fda.gov/drugsatfda_docs/nda/2015/206538Orig1s000ClinPharmR.pdf. Accessed May 21, 2019.
Figure 11.
Figure 11.
Insulin detemir. A: Amino acid structure of insulin detemir. B: Mechanism of protraction: di-hexamer formation in the SC space and binding to albumin. C and D: Pharmacokinetics and PD profiles of insulin glargine (n = 12, blue line) and insulin detemir (n = 12, red line) at steady state, from euglycemic clamp study following SC injection of 0.35 U/kg in patients with type 1 diabetes. Data from Porcellati F, Rossetti P, Busciantella NR, Marzotti S, Lucidi P, Luzio S, et al. Comparison of pharmacokinetics and dynamics of the long-acting insulin analogs glargine and detemir at steady state in type 1 diabetes: a double-blind, randomized, crossover study. Diabetes Care. 2007; 30(10):2447–2452.
Figure 12.
Figure 12.
Insulin degludec. A: Amino acid structure of insulin degludec. B: Mechanism of sustained release exploits multihexamer formation and binding to albumin. C and D: Comparison of PK and PD of insulin degludec (N = 22; 0.4 U/kg) and insulin glargine (N = 22; 0.44 U/kg) at steady state from a euglycemic clamp study in subjects with type 1 diabetes. Data from Heise T, Hovelmann U, Nosek L, Hermanski L, Bottcher SG, Haahr H. Comparison of the pharmacokinetic and pharmacodynamic profiles of insulin degludec and insulin glargine. Expert Opin Drug Metab Toxicol. 2015;11(8):1193–1201.
Figure 13.
Figure 13.
Premix insulins. A: Pharmacodynamics profiles for a 0.3 U/kg dose of an insulin premix (NPH insulin 70%, human insulin 30%) and a 0.3 U/kg dose of human regular insulin from a euglycemic clamp study in 18 healthy subjects. Data from Eli Lilly and Company. Humulin® 70/30 Prescribing Information. 2018; http://pi.lilly.com/us/HUMULIN-7030-USPI.pdf. Accessed April 4, 2019. B: Pharmacodynamics profiles of human insulin premix (NPH insulin 70%, human insulin 30%; 0.3 U/kg) (N = 18) or an analog insulin premix (NPL insulin 75%, insulin lispro 25%; 0.3 U/kg) (N = 30) from a euglycemic clamp study in healthy subjects. Data from Heise T, Weyer C, Serwas A, Heinrichs S, Osinga J, Roach P, et al. Time-action profiles of novel premixed preparations of insulin lispro and NPL insulin. Diabetes Care. 1998;21(5):800–803.
Figure 14.
Figure 14.
Ryzodeg® (insulin aspart 30%, insulin degludec 70%). Pharmacodynamics profiles of single doses of Ryzodeg® and Novolog® (insulin aspart) at 0.6 U/kg from a euglycemic clamp study in 31 subjects with type 1 diabetes. Also shown for comparison is the PD profile of Ryzodeg® 0.6 U/kg from a euglycemic clamp study in 22 subjects with type 1 diabetes taking insulin degludec for 5 days prior to the study to achieve steady state (SS). Data from Heise T, Nosek L, Klein O, Coester H, Svendsen AL, Haahr H. Insulin degludec/insulin aspart produces a dose-proportional glucose-lowering effect in subjects with type 1 diabetes mellitus. Diab Obes Metab. 2015;17(7):659–664.
Figure 15.
Figure 15.
Test for bioequivalence of 2 insulins. Pharmacokinetics parameters of the test insulin (B), usually AUC and Cmax (peak concentration reached), must lie within a prespecified range of the reference insulin (A) to be considered bioequivalent when administered at the same molar dose under the same conditions.
Figure 16.
Figure 16.
Bioequivalent insulins. A: Comparison of PK and PD profiles for insulin lispro U-100 and insulin lispro U-200 from a euglycemic clamp study in 38 healthy subjects (SC administration of 20 U). Data from de la Pena A, Seger M, Soon D, Scott AJ, Reddy SR, Dobbins MA, et al. Bioequivalence and comparative pharmacodynamics of insulin lispro 200 U/mL relative to insulin lispro (Humalog®) 100 U/mL. Clin Pharmacol Drug Dev. 2016;5(1):69–75. B: Comparison of PK and PD profiles for insulin degludec U-100 and insulin degludec U-200 from a euglycemic clamp study at steady state (N = 33 patients with type 1 diabetes; 0.4 U/kg given once daily with insulin aspart at mealtimes). Data from Korsatko S, Deller S, Koehler G, Mader JK, Neubauer K, Adrian CL, et al. A comparison of the steady-state pharmacokinetic and pharmacodynamic profiles of 100 and 200 U/mL formulations of ultralong-acting insulin degludec. Clin Drug Investig. 2013;33(7):515–521.
Figure 17.
Figure 17.
Nonbioequivalent insulins. Pharmacokinetics profiles (A) and PD profiles (B) of 2 doses each of human regular U-100 and U-500 insulins from a euglycemic clamp study in 24 healthy obese subjects. Data from de la Pena A, Riddle M, Morrow LA, Jiang HH, Linnebjerg H, Scott A, et al. Pharmacokinetics and pharmacodynamics of high-dose human regular U-500 insulin versus human regular U-100 insulin in healthy obese subjects. Diabetes Care. 2011;34(12):2496–2501.
Figure 18.
Figure 18.
Example of similar PK and PD profiles of biosimilar insulin glargine products (Basaglar® and Lantus®). Healthy subjects (n = 80) received 0.5 units/kg of insulin in a euglycemic clamp study. Data are mean and standard deviation. Abbreviations: EU IGlar, Lantus®; LY IGlar, Basaglar®. Data from Linnebjerg H, Lam EC, Seger ME, Coutant D, Chua L, Chong CL, et al. Comparison of the pharmacokinetics and pharmacodynamics of LY2963016 insulin glargine and EU- and US-approved versions of Lantus® insulin glargine in healthy subjects: three randomized euglycemic clamp studies. Diabetes Care. 2015;38(12):2226–2233.

References

    1. Bliss M. The Discovery of Insulin. Chicago, IL: The University of Chicago Press: 1982. - PubMed
    1. Nicol DS, Smith LF. Amino-acid sequence of human insulin. Nature. 1960;187:483–485. - PubMed
    1. Galloway JA, Hooper SA, Spradlin CT, et al. Biosynthetic human proinsulin. Review of chemistry, in vitro and in vivo receptor binding, animal and human pharmacology studies, and clinical trial experience. Diabetes Care. 1992;15(5):666–692. - PubMed
    1. Dunn MF. Zinc-ligand interactions modulate assembly and stability of the insulin hexamer – a review. Biometals. 2005;18(4):295–303. - PubMed
    1. Owens DR, Jones MK, Birtwell AJ, et al. Pharmacokinetics of subcutaneously administered human, porcine and bovine neutral soluble insulin to normal man. Horm Metab Res. 1984;16 Suppl 1:195–199. - PubMed

Publication types