. 2020 Jul 8;28(7):1658-1672.
doi: 10.1016/j.ymthe.2020.04.023. Epub 2020 Apr 29.

Single-Cell Transcriptome Analysis Reveals Intratumoral Heterogeneity in ccRCC, which Results in Different Clinical Outcomes

Affiliations

Single-Cell Transcriptome Analysis Reveals Intratumoral Heterogeneity in ccRCC, which Results in Different Clinical Outcomes

Junyi Hu et al. Mol Ther. .

Abstract

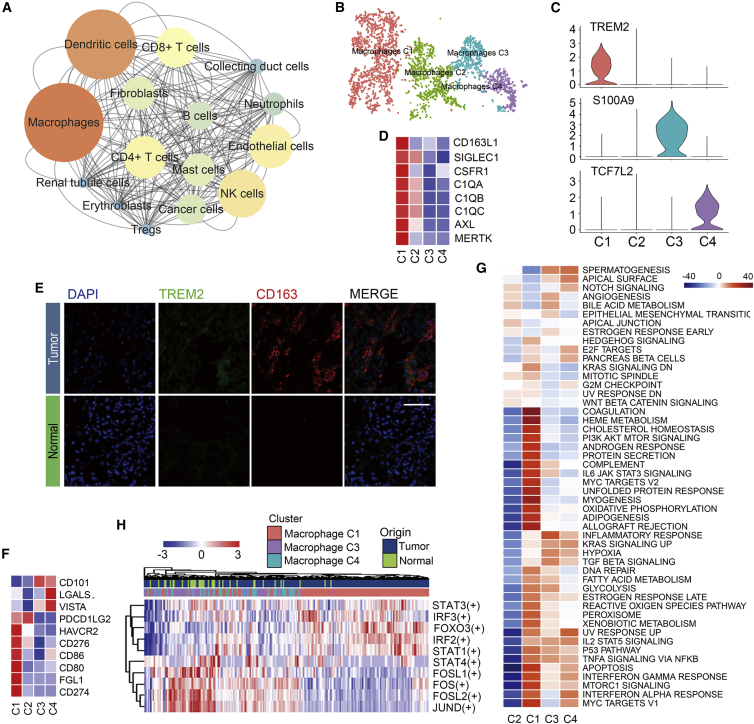
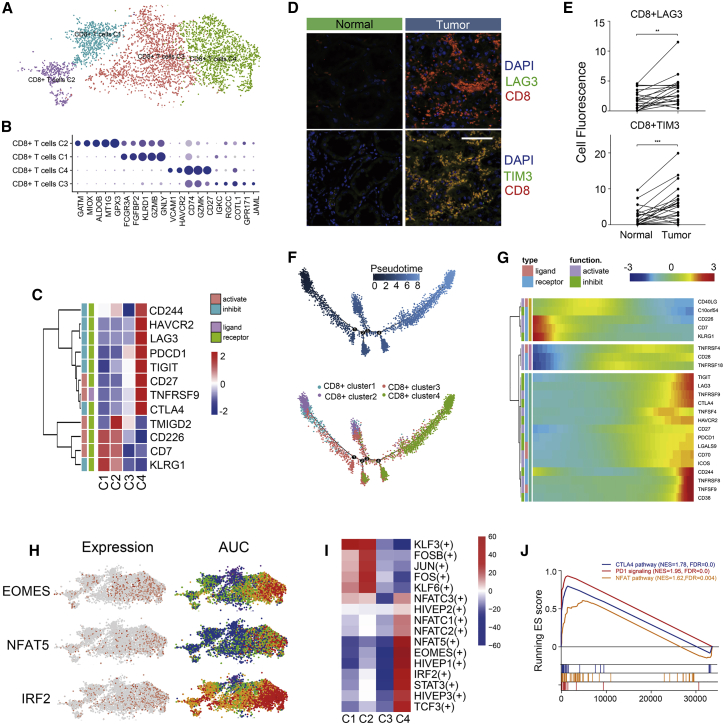
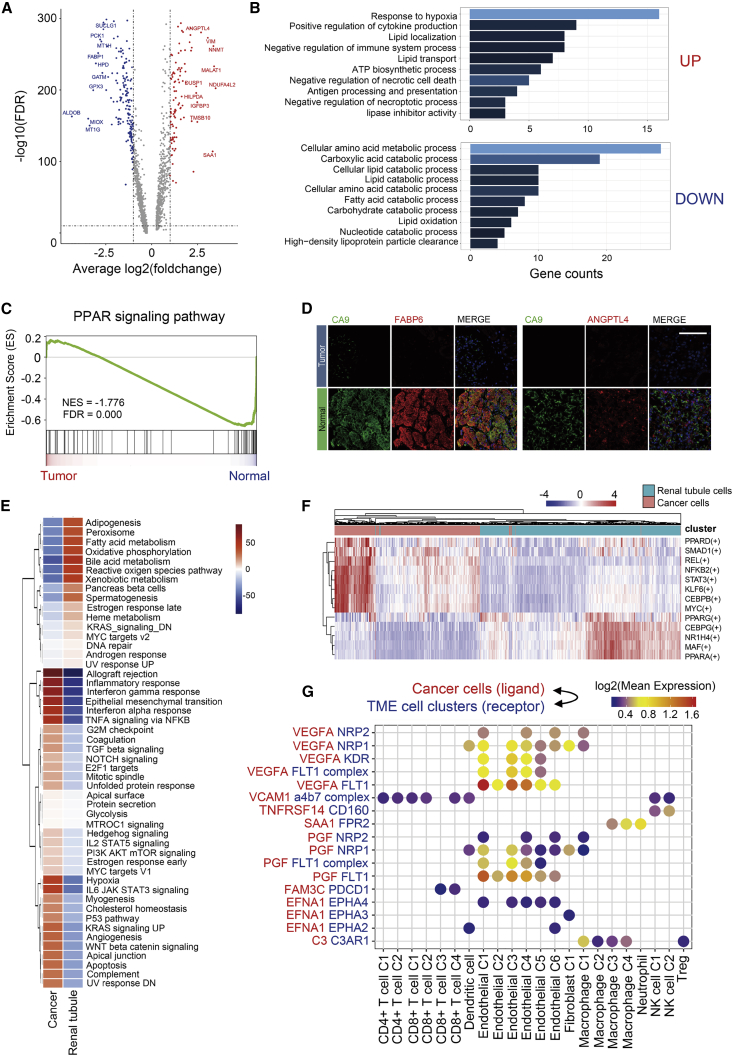
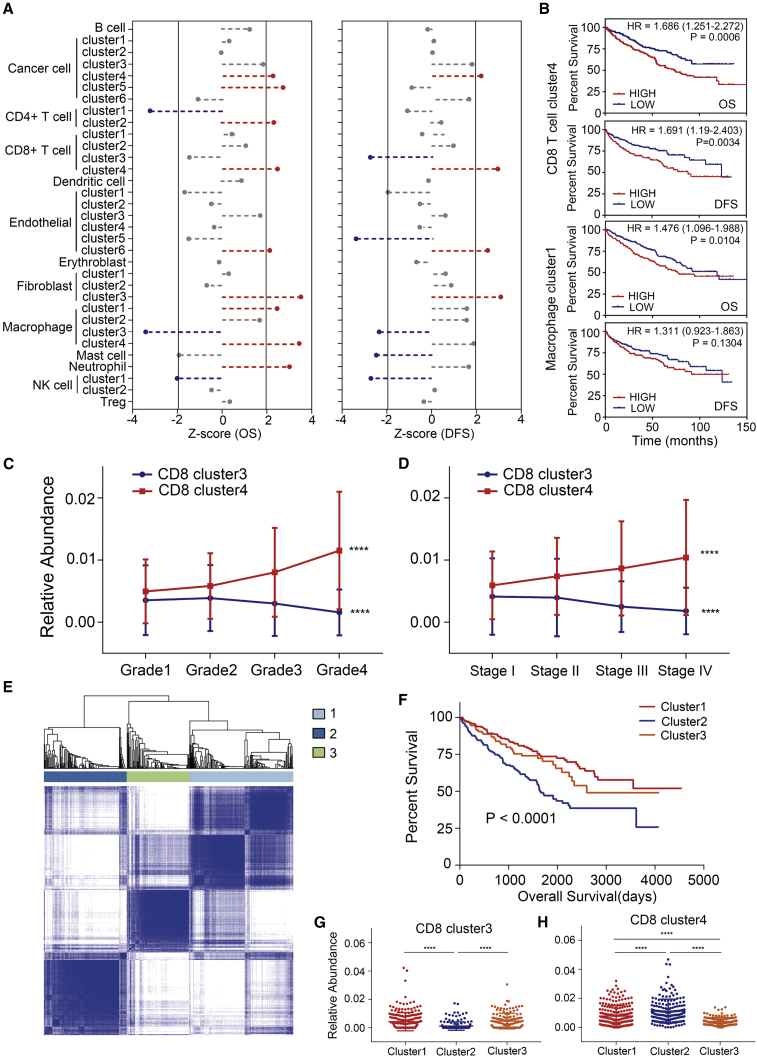
Clear-cell renal cell carcinoma (ccRCC) is the most common histological type of RCC. To investigate the intratumoral heterogeneity of ccRCC, we analyzed single-cell RNA-sequencing data and identified 15 major cell types, along with 39 subgroups of cells derived from tumor or non-malignant tissues, and confirmed their presence by immunofluorescence staining in tissue chips. In this study, we verified that T cell exhaustion was the key factor responsible for the immunosuppressive property of ccRCC tissues, which was significantly related to poor prognosis. We also found that abnormal metabolic patterns occurred not only in cancer cells, but also in tumor-infiltrating stromal cells. Based on the fraction of each cell cluster detected by CIBERSORTx, 533 patients from The Cancer Genome Atlas (TCGA) KIRC dataset were divided into three groups. One group, which showed a lesser proportion of activated CD8+ cells and greater proportion of exhausted CD8+ cells, was associated with a poor prognosis. Hence, the blockade of immunosuppressive checkpoints, not only PD-1, but also LAG3, TIM-3, and other inhibitory checkpoints, could serve as a potential target for ccRCC immunotherapy. Our work will further the understanding of the heterogeneity among ccRCC tissues and provide novel strategies for treating ccRCC.

Keywords: T cell exhaustion; bioinformatics; clear-cell renal cell carcinoma; heterogeneity; single-cell sequencing; tumor microenvironment.


Figures

None
Graphical abstract
Figure 1
Figure 1
Overview of Single Cells Derived from ccRCC and Non-malignant Tissues (A–C) UMAP plot of all the single cells, with each color coded for (A) 15 major cell types, (B) sample origin (normal or tumor), and (C) immune cell (CD45+) or non-immune cell (CD45). (D) Expression level of four normal tissue-specific genes and immunofluorescence confirmation in tissue chips. Scale bar represents 50 μm. (E) For 39 subgroups identified in this profile (left to right): the fraction of cells that originated from the 9 non-malignant and 15 tumor samples, and the fraction of cells that originated from each of the three patients. (F) Top five marker genes of 15 major cell types identified in this profile.
Figure 2
Figure 2
Macrophage Emerge M2 Polarization in ccRCC (A) Interaction network constructed by CellPhoneDB; size and color of circles represent interaction counts, brighter color and larger size means more interaction with other cell types. (B) tSNE plot of four subclusters of macrophages. (C) Violin plots of marker genes for three subgroups; cluster 2 emerged as a non-specific marker. (D) Heatmap of already known marker of M2-like TAMs. Mean expression level of each cell cluster was transformed into a row Z score. (E) Heatmap of positive immune checkpoint expression on macrophages. The row Z score was implicated to represent the expression level. (F) Heatmap of the area under the curve (AUC) scores of expression regulation by transcription factors estimated by SCENIC. (G) Differences in 50 hallmark pathway activities scored with GSVA software. Shown are t values calculated by a linear model. (H) Immunofluorescence staining of CD163 and TREM2 in ccRCC tissue chip. CD163+TREM2+ macrophages only emerged in tumor tissues. Scale bar represents 50 μm.
Figure 3
Figure 3
CD8+ T Cells Tend to Be Exhausted in Renal and ccRCC Tissues (A) tSNE plot of four subgroups of CD8+ T cells. (B) Dotplot of top five markers of each cell cluster; sizes of dots represent abundance, while color represents expression level. (C) Heatmap of immune checkpoints upregulated or downregulated in exhausted T cells. A row Z score was used to represent the expression level. (D) Immunofluorescence of exhausted T cells in tissue chips. CD8+LAG3+ (top) and CD8+TIM3+ (bottom) T cells were enriched in tumor tissues. Scale bar represents 50 μm. (E) Cell fluorescence score of CD8+LAG3+ and CD8+TIM3+ cells was measured by ImageJ. A Student’s t test was employed to recognize the difference between tumor and non-malignant tissues. ∗∗p < 0.01, ∗∗∗p < 0.001. (F) Differentiation trajectory of CD8+ T cells in ccRCC, with each color coded for pseudotime (top) and clusters (bottom). (G) Pseudo-heatmap of immune checkpoints altered in the differentiation process of CD8+ T cells in ccRCC, which was clustered into three clusters. (H) tSNE plot of CD8+ T cells, color coded for the expression level (left) and for the AUC of the estimated regulon activity of these transcription factors (right). (I) Differences of AUC scores of expression regulation by transcription factors estimated by SCENIC. Shown are t values calculated by a linear model. (J) GSEA reveals three pathways enriched in exhausted T cells. FDR <0.01 was considered as significantly enriched.
Figure 4
Figure 4
Alteration of PPAR Pathway Is an Important Characteristic of ccRCC Metabolic Abnormality (A) Volcano plot of differentially expressed genes (DEGs) between cancer cells and normal renal tubular epithelium. Upregulated genes (FC >2) were colored in red while downregulated genes (FC less than −2) were colored in blue. Symbols of top 10 upregulated and downregulated genes were annotated, respectively. (B) Gene Ontology analysis of DEGs; upregulated and downregulated DEGs were annotated, respectively. FDR <0.05 was considered as significantly enriched. Brighter color represents a smaller FDR value. (C) GSEA revealed that the PPAR pathway was significantly enriched in normal tubular epithelium. (D) Immunofluorescence staining of ccRCC tissue chips. ANGPTL4 and FABP6 were co-stained with CA9, respectively. Scale bar represents 50 μm. (E) Heatmap of differences in activities of 50 hallmark pathways scored by GSVA. Shown are t values calculated by a linear model. (F) Heatmap of AUC scores of selected regulons altered in cancer cells. AUC scores were measured by SCENIC per cell. (G) Ligand-receptor interaction between cancer cells and TME-infiltrated cell clusters detected by CellPhoneDB 2. Selected ligand-receptor pairs are shown in the bubble plot.
Figure 5
Figure 5
Clusters of Fibroblasts and Endothelial Cells in ccRCC (A and B) tSNE plot of three fibroblast clusters (A) and the expression level of α-SMA (ACTA2) (B). (C) Marker genes of markers of clusters 1 and 3. Cluster 2 showed no specific marker. (D) Immunofluorescence staining of FABP5 and ACTA2 in tissue chip. ACTA2+FABP5+ fibroblasts only occur in ccRCC tissues, while they are almost absent in normal kidney. Scale bar represents 50 μm. (E) Heatmap of AUC scores of selected regulons altered in cancer cells. AUC scores were measured by SCENIC per cell. (F) tSNE plot of endothelial cells color coded for six subgroups of endothelial cells from normal or tumor tissues (left) and sample origins (normal or tumor) (right). (G) Cluster-specific markers of endothelial cells. Cluster 2 has no specific marker. (H) Venn diagram of endothelial-specific markers and DEGs between tumor and normal derived endothelial cells. 14 overlapped genes were recognized (left). Expression levels of VWF and ENPP2 are visualized into violin plots (right). (I) Immunofluorescence staining of ccRCC tissue chips. ENPP2 and VWF were co-stained. Scale bar represents 50 μm. (J) Differences in 50 hallmark pathway activities scored with GSVA software. Shown are t values calculated by a linear model.
Figure 6
Figure 6
Prognostic Role of Cell Clusters Identified by scRNA-Seq in TCGA KIRC Cohort (A) Association between relative abundance of cell clusters calculated by CIBERSORTx and overall survival (left) and disease-free survival (right). Z score was measured with a Cox regression model in R. Clusters associated with bad outcome (p < 0.05) are colored in red while clusters associated with good outcome (p < 0.05) are colored in blue. (B) Kaplan-Meier survival curve for patients in TCGA KIRC. Hazard ratios (HRs), with their 95% confidence intervals in brackets, are shown. A log rank p value <0.05 was considered as statistically significant. (C and D) Line charts show CD8+ cluster 3 enriched in low-grade (C) and early-stage (D) ccRCC tissues, while cluster 4 shows opposite properties. ∗∗∗∗p < 0.0001, measured with one-way ANOVA test. (E) ccRCC patients in TCGA KIRC were clustered into 3 subgroups by ConsensusClusterPlus based on cell clusters identified in this profile. (F) Kaplan-Meier survival curve of three patient subgroups. Log rank p value was calculated in GraphPad Prism 7. (G and H) Relative abundance of CD8+ T cell clusters 3 (G) and 4 (H) in three patient groups. ∗∗∗∗p < 0.0001, calculated with Tukey’s multiple comparison test.

References

    1. Bray F., Ferlay J., Soerjomataram I., Siegel R.L., Torre L.A., Jemal A. Global cancer statistics 2018: GLOBOCAN estimates of incidence and mortality worldwide for 36 cancers in 185 countries. CA Cancer J. Clin. 2018;68:394–424. - PubMed
    1. Porta C., Cosmai L., Leibovich B.C., Powles T., Gallieni M., Bex A. The adjuvant treatment of kidney cancer: a multidisciplinary outlook. Nat. Rev. Nephrol. 2019;15:423–433. - PubMed
    1. Grimm M.O., Bex A., De Santis M., Ljungberg B., Catto J.W.F., Rouprêt M., Hussain S.A., Bellmunt J., Powles T., Wirth M., Van Poppel H. Safe use of immune checkpoint inhibitors in the multidisciplinary management of urological cancer: the European Association of Urology position in 2019. Eur. Urol. 2019;76:368–380. - PubMed
    1. Kotecha R.R., Motzer R.J., Voss M.H. Towards individualized therapy for metastatic renal cell carcinoma. Nat. Rev. Clin. Oncol. 2019;16:621–633. - PubMed
    1. Patel A.P., Tirosh I., Trombetta J.J., Shalek A.K., Gillespie S.M., Wakimoto H., Cahill D.P., Nahed B.V., Curry W.T., Martuza R.L. Single-cell RNA-seq highlights intratumoral heterogeneity in primary glioblastoma. Science. 2014;344:1396–1401. - PMC - PubMed

Publication types