. 2020 Jul 22;107(2):274-282.e6.
doi: 10.1016/j.neuron.2020.04.018. Epub 2020 May 11.

Extraction of Distinct Neuronal Cell Types from within a Genetically Continuous Population

Affiliations

Extraction of Distinct Neuronal Cell Types from within a Genetically Continuous Population

Euiseok J Kim et al. Neuron. .

Abstract

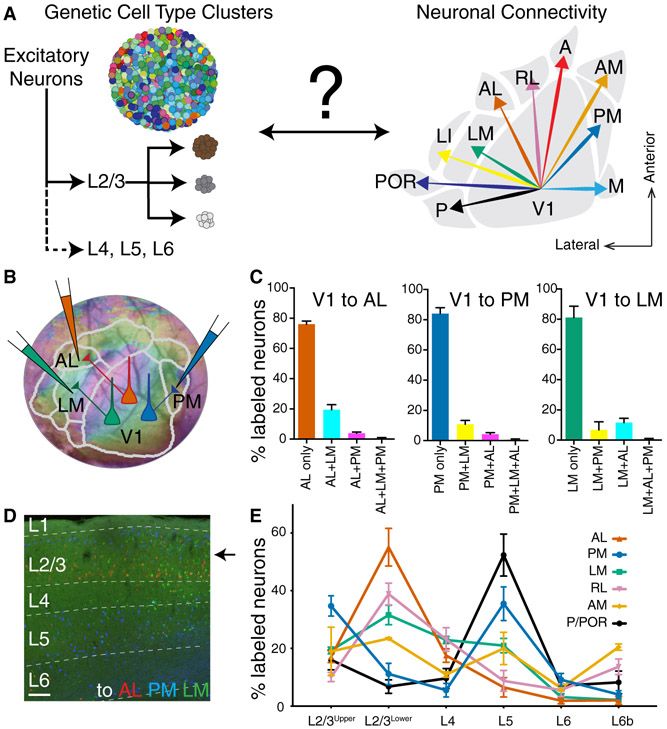
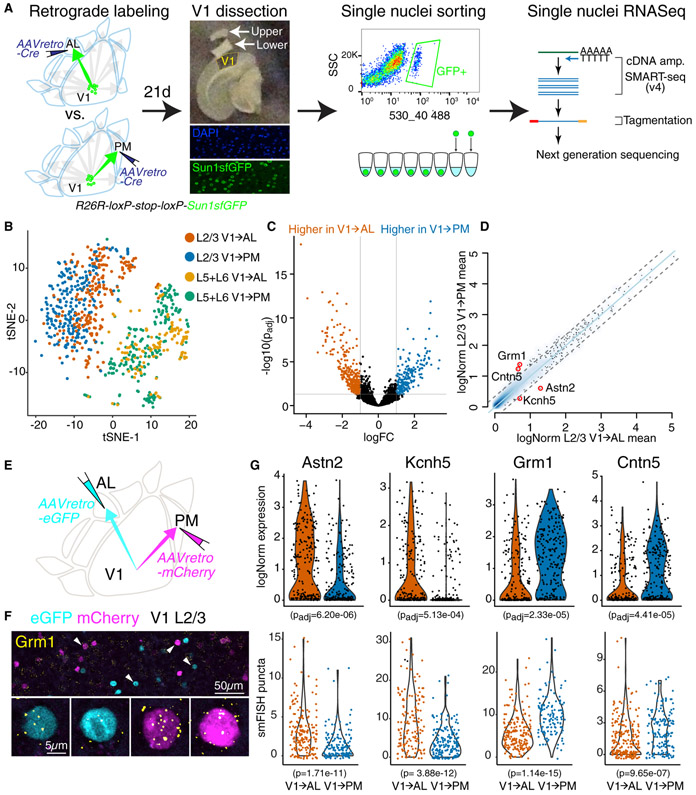
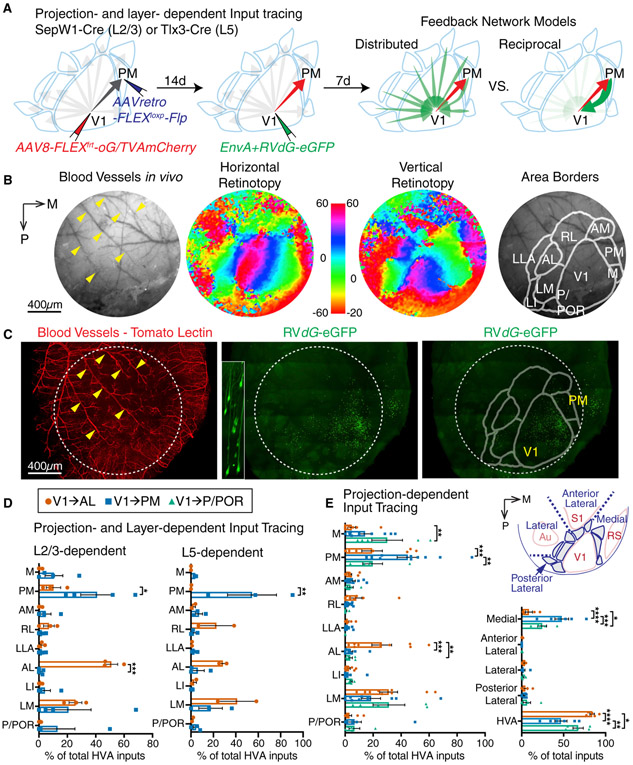
Single-cell transcriptomics of neocortical neurons have revealed more than 100 clusters corresponding to putative cell types. For inhibitory and subcortical projection neurons (SCPNs), there is a strong concordance between clusters and anatomical descriptions of cell types. In contrast, cortico-cortical projection neurons (CCPNs) separate into surprisingly few transcriptomic clusters, despite their diverse anatomical projection types. We used projection-dependent single-cell transcriptomic analyses and monosynaptic rabies tracing to compare mouse primary visual cortex CCPNs projecting to different higher visual areas. We find that layer 2/3 CCPNs with different anatomical projections differ systematically in their gene expressions, despite forming only a single genetic cluster. Furthermore, these neurons receive feedback selectively from the same areas to which they project. These findings demonstrate that gene-expression analysis in isolation is insufficient to identify neuron types and have important implications for understanding the functional role of cortical feedback circuits.

Keywords: cell types; connectivity; cortico-cortical projection neurons; feedback circuits; rabies tracing; single-cell RNA sequencing; visual cortex.


Conflict of interest statement

Declaration of Interests The authors declare no competing interests.

Figures

Figure 1.
Figure 1.. Anatomical Diversity of Cortico-Cortical Projection Neurons in Mouse Primary Visual Cortex.
(A) Schematic of genetic cell types defined by gene expression difference clusters (left) versus anatomical cell types based on long-distance connectivity patterns to higher visual areas (HVAs) in V1 (right). Cartoons describing genetic cell type clusters were adapted and modified from (Poulin et al., 2016). (B) Single neuron retrograde labeling strategy using three different colors of cholera toxin subunit b tracer injections on AL, PM, and LM after area border determination using intrinsic signal imaging. (C) A fraction of V1 neurons projecting to single, double, and triple areas in each case when they have the projections to AL, PM, or LM, respectively. A total of 12791 (V1→AL), 8084 (V1→PM), 2344 (V1→LM) retrogradely labeled neurons were counted per animal (n=3). (D) A coronal section of V1 displaying neurons projecting to AL (red), PM (blue), LM (green) across different cortical layers. (E) Soma locations of V1 neurons are distributed with distinctive laminar patterns depending on their HVA projections (mean ± SEM). Total 55742 retrograde labeled neurons were analyzed in 12 mice. Two-way ANOVA determined that fractions of V1 neurons projecting to HVAs are significantly different between their projection target areas and soma laminar locations (p<0.0001). Tukey’s multiple comparisons tested the significant difference of V1 neuron fraction between projection areas within each layer (Figure S1B and Table S2). Scale bar in panel D, 100μm. A, anterior; AL, anterolateral; AM, anteromedial; LI, interomediolateral; LM, lateromedial; M, medial; P, posterior; PM, posteromedial; POR, postrhinal; RL, rostrolateral.
Figure 2.
Figure 2.. Single Cell Gene Expression Profiles Differ for V1→AL versus V1→PM Neurons.
(A) Schematic of experimental design on projection-based single nuclei RNA sequencing. (B) Unsupervised clustering analysis using tSNE plot based on single nuclei level gene expressions. (C) Volcano plot showing differentially expressed genes between V1→AL and V1→PM neurons. Grey lines indicate significance cutoff: adjusted p-value < 0.05 and logFC (fold change) > 1. (D) Smoothed scatterplot displaying expression differences in V1→AL versus V1→PM neurons. The light blue line showed perfect correlation; grey dashed line indicated 0.5 logFC deviation from the center. Values were averaged Seurat logNorm across all cells from each group. (E) Experimental scheme illustrating projection dependent labeling of V1→AL and VI→PM neurons using AAVretro-eGFP or mCherry. (F) Confocal microscope images of eGFP+ V1→AL and mCherry+ V1→PM neurons with single molecule FISH (smFISH) puncta of Grm1(yellow). Arrowheads indicate the cells shown in lower panels with higher magnification. (G) Violin plots displaying logNorm expression (top) and smFISH puncta count (bottom) of four differentially expressed gene markers per cell on V1→AL and V1→PM types. Total 345, 363, 334, 433 retrogradely labeled neurons for smFISH of Astn2, Kcnh5, Grm1, Cntn5 respectively in three animals (except Kcnh5 for two animals) were counted and analyzed. Adjusted p values for logNorm expressions were determined by multiple testing Benjamini-Hochberg method in Zinbwave-EdgeR, and p values for smFISH puncta were determined by Wilcoxon rank-sum test.
Figure 3.
Figure 3.. Projection- and Layer-dependent Input Tracing of V1→AL and V1→PM Neurons.
(A) Schematic showing the experimental design on projection- and layer-dependent monosynaptic input tracing by G-deleted rabies (left and middle). Two possible feedback connectivity models depending on projection (right). (B) Intrinsic signal imaging to define higher visual area borders. (C) Reconstruction of rabies-traced and blood vessel stained visual cortex using light sheet microscopy. (D) Summary of long-range feedback inputs onto V1→AL and V1→PM neurons in L2/3 (left) or L5 (right). (E) Summary of long-range feedback inputs onto V1→AL, V1→PM, and V1→P/POR neurons. Values are reported as mean ± SEM. Statistics were calculated from two-way ANOVAs with Sidak’s or Turkey’s post-hoc multiple-comparison tests for panels D and E, respectively. *p<0.05; **p< 0.01; ***p< 0.001; ****p<0.0001. A, anterior; AL, anterolateral; AM, anteromedial; Au, auditory cortex; LI, interomediolateral; LM, lateromedial; M, medial; P, posterior; PM, posteromedial; POR, postrhinal; RL, rostrolateral; RS, retrosplenial cortex; S1, primary somatosensory cortex; V1, primary visual cortex.

References

    1. Andermann ML, Kerlin AM, Roumis DK, Glickfeld LL, and Reid RC (2011). Functional specialization of mouse higher visual cortical areas. Neuron 72, 1025–1039. - PMC - PubMed
    1. Bria A, and lannello G (2012). TeraStitcher - a tool for fast automatic 3D-stitching of teravoxel-sized microscopy images. BMC Bioinformatics 13, 316. - PMC - PubMed
    1. Butler A, Hoffman P, Smibert P, Papalexi E, and Satija R (2018). Integrating single-cell transcriptomic data across different conditions, technologies, and species. Nat Biotechnol 36, 411–420. - PMC - PubMed
    1. Conte WL, Kamishina H, and Reep RL (2009). The efficacy of the fluorescent conjugates of cholera toxin subunit B for multiple retrograde tract tracing in the central nervous system. Brain Structure and Function 213, 367–373. - PubMed
    1. Dobin A, Davis CA, Schlesinger F, Drenkow J, Zaleski C, Jha S, Batut R, Chaisson M, and Gingeras TR (2013). STAR: ultrafast universal RNA-seq aligner. Bioinformatics 29, 15–21. - PMC - PubMed

Publication types

MeSH terms