. 2020 May 11;37(5):655-673.e11.
doi: 10.1016/j.ccell.2020.04.004.

Mutant EZH2 Induces a Pre-malignant Lymphoma Niche by Reprogramming the Immune Response

Affiliations

Mutant EZH2 Induces a Pre-malignant Lymphoma Niche by Reprogramming the Immune Response

Wendy Béguelin et al. Cancer Cell. .

Abstract

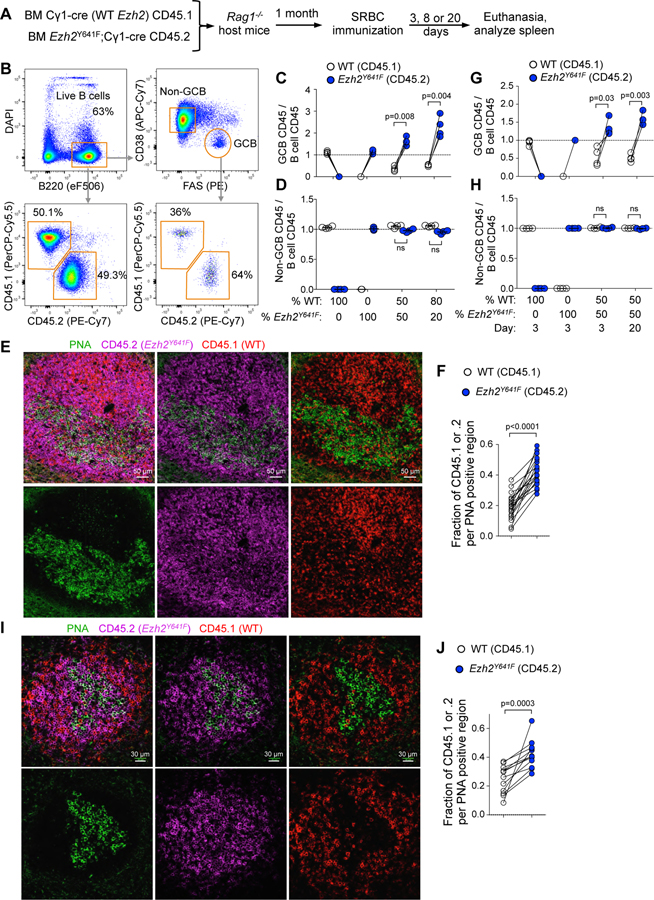
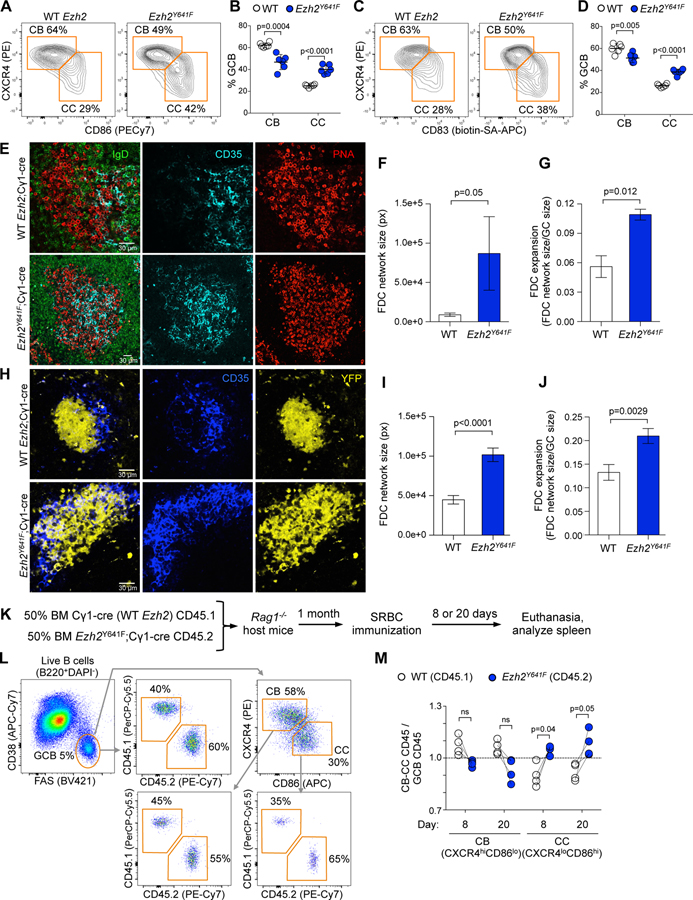
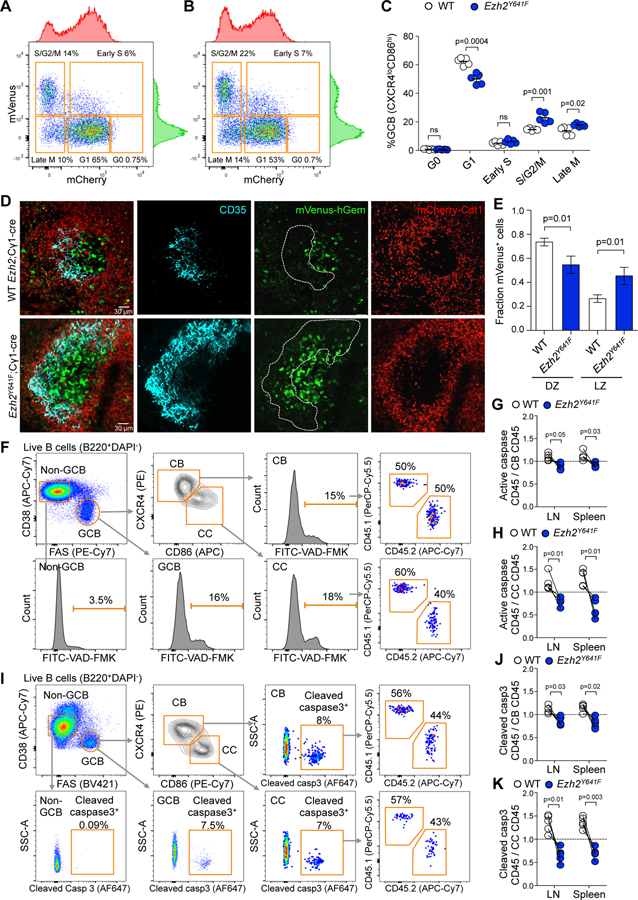
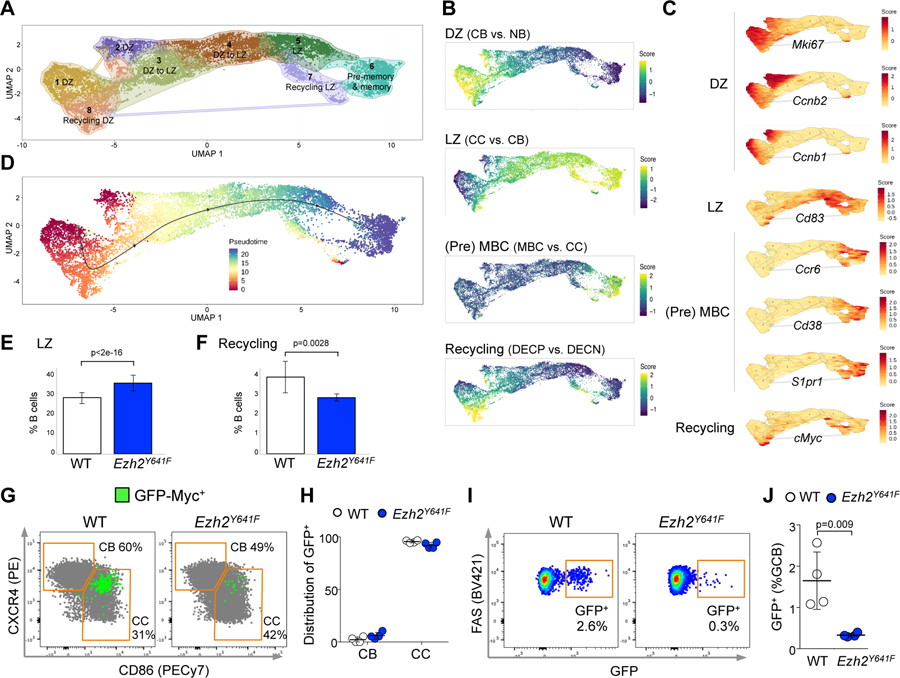
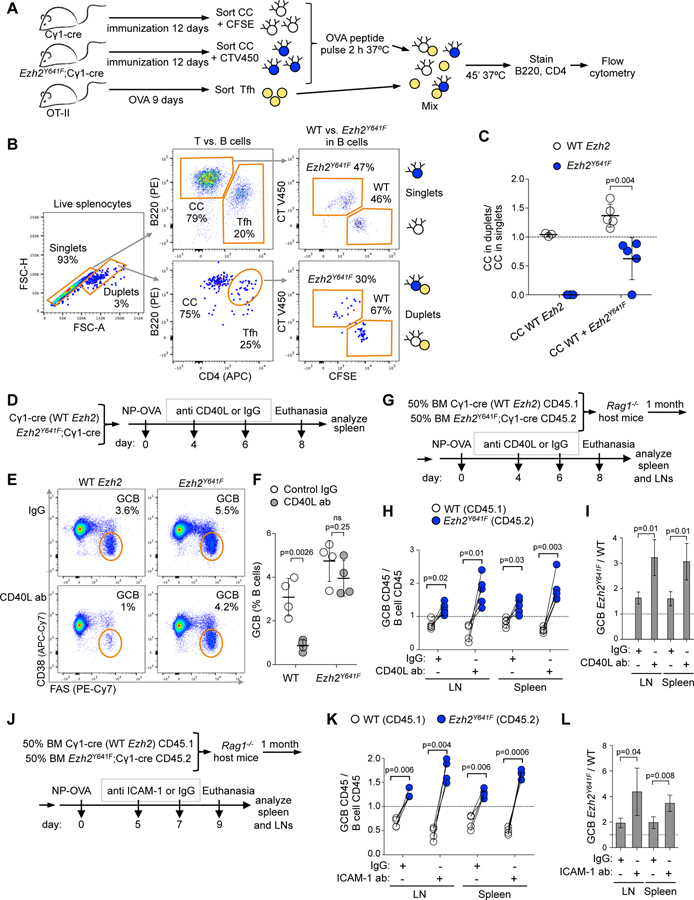
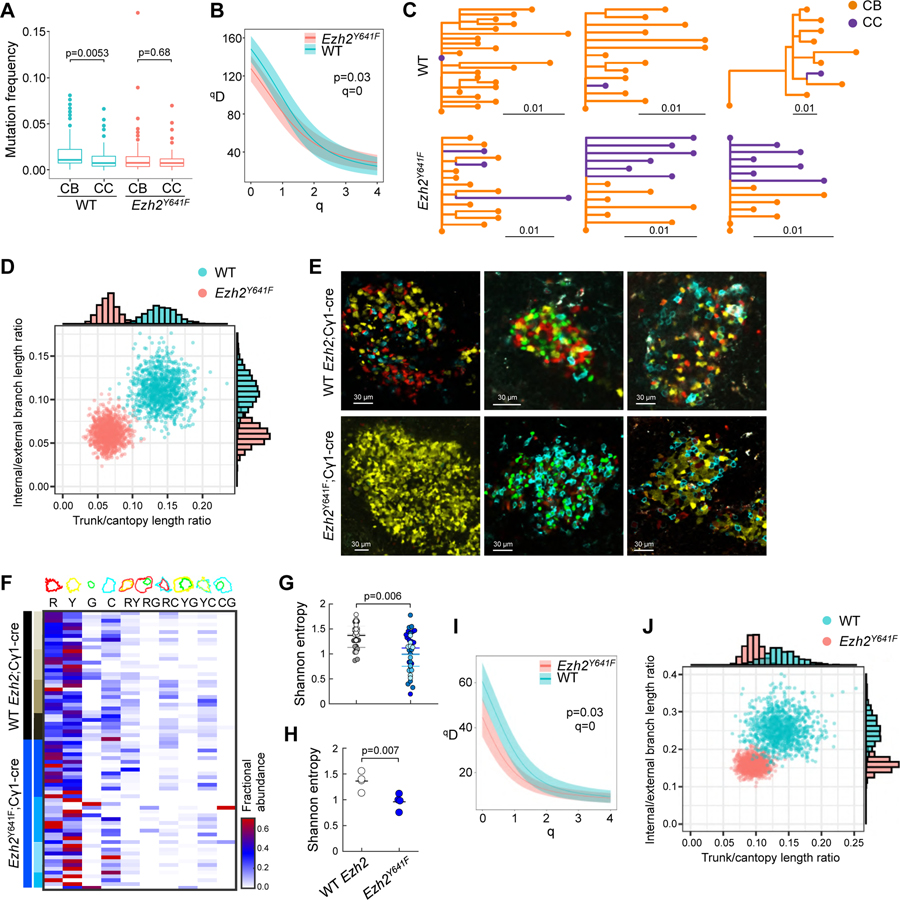
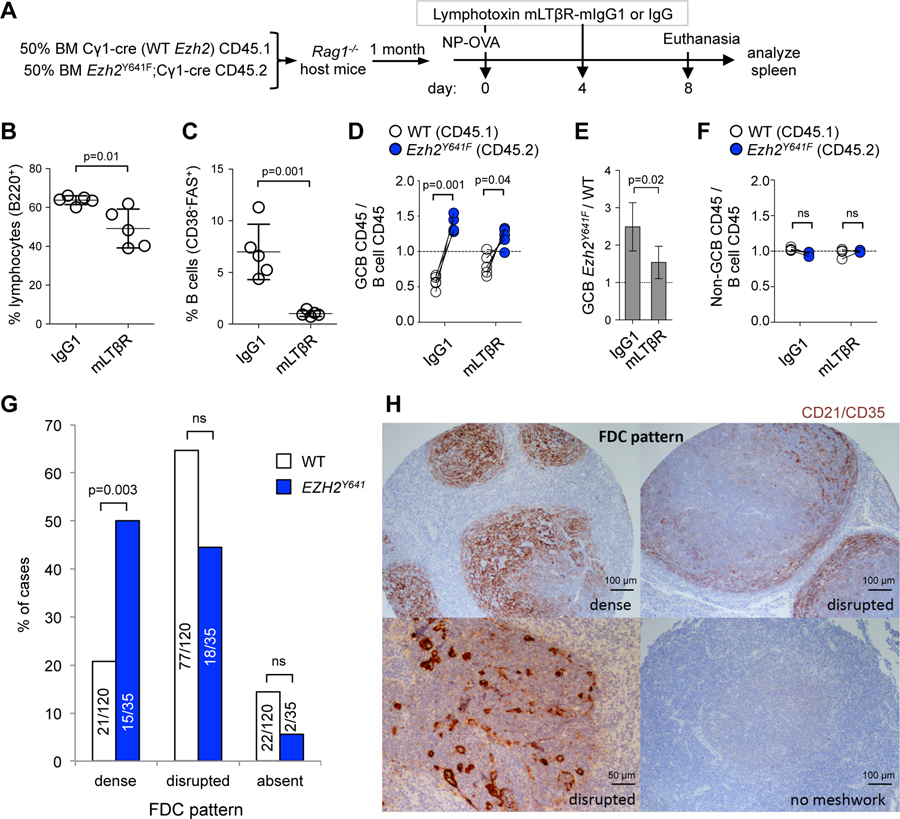
Follicular lymphomas (FLs) are slow-growing, indolent tumors containing extensive follicular dendritic cell (FDC) networks and recurrent EZH2 gain-of-function mutations. Paradoxically, FLs originate from highly proliferative germinal center (GC) B cells with proliferation strictly dependent on interactions with T follicular helper cells. Herein, we show that EZH2 mutations initiate FL by attenuating GC B cell requirement for T cell help and driving slow expansion of GC centrocytes that become enmeshed with and dependent on FDCs. By impairing T cell help, mutant EZH2 prevents induction of proliferative MYC programs. Thus, EZH2 mutation fosters malignant transformation by epigenetically reprograming B cells to form an aberrant immunological niche that reflects characteristic features of human FLs, explaining how indolent tumors arise from GC B cells.

Keywords: EZH2; epigenetic dysregulation; follicular lymphoma; germinal center; immune microenvironment.


Conflict of interest statement

Declaration of Interests A.M.M. is consulting for Epizyme and Constellation Pharmaceuticals, and receives research funding from Janssen Pharmaceuticals; S.H.K. is consulting for Northrop Grumman; C.E.M. is a co-founder and equity stake holder for Onegevity Health and Biotia, Inc.; C.S. has performed consultancy for Seattle Genetics, Curis Inc., Roche, AbbVie, Juno Therapeutics, and Bayer, and has received research funding from Bristol-Myers Squibb and Trillium Therapeutics, Inc. There are no competing interests.

Figures

Figure 1.
Figure 1.. Mutant Ezh2 provides an advantage to activated B cells in expanding the GC reaction
A. WT bone marrow (BM) (CD45.1) mixed with Ezh2Y641F BM (CD45.2) was injected into Rag1-/- mice, SRBC-immunized and euthanized 3, 8 or 20 days later. B. Gating strategy of splenocytes of one representative sample. C. Flow cytometry data of mice immunized for 8 days was analyzed by normalizing the percentage of CD45.1+ GC B cells (CD38-FAS+) to their parental CD45.1+ B cells (B220+DAPI-), and equivalent normalization with CD45.2+ populations. Each pair of connected dots represents a mouse (n=4); paired t tests. D. Analysis of non-GC B cells (CD38+FAS-) at day 8 was done as in C. E. IF confocal microscopy images of chimeric splenic GCs at day 8 post-SRBC. F. Quantification of PNA fluorescence was overlapped with CD45.1 and CD45.2 shown in E (and non-shown images), each pair of connected dots representing a single GC; paired t tests. G-H. Analysis of GC B cells (G) and non-GC B cells (H) at days 3 and 20 post-SRBC were done as in C (n=4 per group). I. IF confocal microscopy images of chimeric splenic GCs at day 3 post-SRBC. J. Quantification of GCs shown in I (and non-shown images) was done as in F. Results at day 8 are representative of 3 independent experiments. See also Figure S1.
Figure 2.
Figure 2.. Mutant Ezh2 induces LZ expansion
A. Ezh2Y641F and WT mice were SRBC-immunized for 8 days and spleens analyzed by flow cytometry. Centroblasts (CB) and centrocytes (CC) were gated from GC B cells. B. Percentage of CBs and CCs shown in A. Each dot represents a mouse (n=6), mean ± SEM; unpaired t tests. C. Flow cytometry data of splenocytes shown in A, using a different CC marker. D. Percentage of CBs and CCs shown in C. Data shown as in B. E. IF confocal microscopy images of splenic GCs at day 8 post-SRBC. F-G. Quantification of FDC network size (F) and expansion (G) from IF images from 3 WT and 3 Ezh2Y641F; mean ± SEM; unpaired t tests. H. IF confocal microscopy images of YFP splenic GCs at day 8 post-SRBC. Mice were injected with anti CD35-BV421 to mark FDCs. I-J. Quantification of FDC network size (I) and expansion (J) from IF images from 5 YFP;Ezh2Y641F and 5 YFP;Cγ1-cre mice; mean ± SEM; unpaired t tests. K. WT BM (CD45.1) mixed with Ezh2Y641F BM (CD45.2) was injected into Rag1-/- mice, SRBC-immunized and euthanized 8 or 20 days later. L. Gating strategy of splenocytes of one representative sample. M. Flow cytometry data was analyzed by normalizing the percentage of CD45.1+ CBs (CXCR4hiCD86lo) and CCs (CXCR4loCD86hi) to their parental CD45.1+ GC B cells (CD38-FAS+), and equivalent normalization with CD45.2+ populations. Each pair of connected dots represents a mouse (n=4); paired t tests. Results representative of 3 to 4 experiments. See also Figure S2.
Figure 3.
Figure 3.. Ezh2 mutation causes aberrant proliferation and less apoptosis in the LZ
A-B. Flow cytometry plots of splenic CCs (CXCR4loCD86hi) of R26-Fucci2aR;Cγ1-cre (A) and R26-Fucci2aR;Ezh2Y641F (B) mice immunized with SRBC for 8 days. C. Percentage of CCs shown in A and B at different cell cycle phases. Each dot represents a mouse (n=5), mean ± SEM; unpaired t tests. D. IF confocal microscopy images of R26-Fucci2aR splenic GCs at day 8 post-SRBC. Mice were injected with anti CD35-BV421 to mark FDCs. E. Quantification of proliferating mVenus+ cells in images taken from 4 R26-Fucci2aR;Cγ1-cre and 4 R26-Fucci2aR;Ezh2Y641F mice; mean ± SEM; unpaired t tests. F. Gating strategy of lymph node cells of mixed chimera mice generated as in Figure 2K and immunized with NP-OVA for 8 days. Apoptosis was assessed using VAD-FMK pan-caspase inhibitor. G-H. The percentage of CD45.1+ VAD-FMK+ splenocytes and lymph node (LN) cells was normalized to their parental CD45.1+ CBs (G) and CCs (H), and equivalent normalization with CD45.2+ populations, gated as shown in F. Each pair of connected dots represents a mouse (n=4); paired t tests. I. Gating strategy of splenocytes of mixed chimera mice immunized with NP-OVA for 8 days. Apoptosis was assessed using an anti-cleaved caspase 3 antibody. J-K. The percentages of CD45+ cleaved caspase 3+ cells shown in I were normalized to parental CBs (J) and CCs (K), and quantified as in G-H; n=4, paired t tests. Results representative of 3 experiments. See also Figure S3.
Figure 4.
Figure 4.. Mutant Ezh2 centrocytes fail to re-enter the DZ
A. YFP+IgD- splenocytes sorted from 3 YFP;Ezh2Y641F and 3 YFP;Cγ1-cre mice immunized with SRBC for 8 days were subjected to single cell RNA-seq. Dimensionality reduction with UMAP was performed on normalized gene expression values, using graph based clustering and K nearest neighbor analysis to assign cells to clusters with distinct expression profiles. B. Mature B cell signatures were projected on clusters defined in A. MBC: memory B cell. DECP are positively selected GC B cells (Ersching et al., 2017). C. Specific gene expressions were projected on clusters from A. D. Gene expression profiles were organized into a pseudotime vector by Slingshot. E-F. After normalization for total number of analyzed cells, the abundance of Ezh2Y641F and WT was calculated for CC (LZ) (E) and recycling cells (F), based on the projected signature score from (B); data are mean ± SE (n=3 mice), p values generalized linear model. G. GFP-Myc mice were SRBC-immunized for 8 days and spleens analyzed by flow cytometry. CBs and CCs were gated from GC B cells. H. Total GFP+ GC B cells were assigned to CBs and CCs, gated as shown in G. Each dot represents a mouse (n=4), mean ± SEM. I. Flow cytometry plots showing the percentage of GFP+ cells among GC B splenocytes from GFP-Myc mice. J. Quantification of GFP+ cells among GC B splenocytes from 4 GFP-Myc;Ezh2Y641F and 4 GFP-Myc;Cγ1-cre mice; mean ± SEM; unpaired t test. Results representative of 2 experiments. See also Figure S4.
Figure 5.
Figure 5.. Ezh2 mutation produces transcriptional repression and spreading of H3K27me3 surrounding TSS sites
A. Relative abundance of H3.1K27 by liquid chromatography separation and mass spectrometry of histones from SRBC-immunized mice (n=5). Mean ± SEM; unpaired t test. B. H3K27me3 bound promoters by ChIP-seq (n=3 mice). C. H3K27me3 normalized read density heat maps at Ezh2Y641F-specific H3K27me3 promoters (top), and scaled H3K27me3 mean density plots of region between Ezh2Y641F-specific H3K27me3 TSS and nearest TSS (bottom). D. RNA-seq (n=4 mice); transcripts in red, fold-change>1.5, q<0.01. E. H3K27me3 normalized read density heat maps at promoters of differentially expressed genes in CC (top), and mean H3K27me3 profile across loci interval (bottom). F. Pathway analysis in CC. G-H. Fuzzy c-means clustering of RNA-seq data: line plot (G) and heatmap (H) of standardized log2 fold-change relative to normal naive B (NB) cells. Black lines in (G) are cluster centroid; each gene is colored by the degree of cluster membership. Heatmap in (H) are z-scores of log2 fold-change values for each gene relative to NB. I. RNA-seq and H3K27me3 profiles of Ezh2Y641F vs. WT CC per module. H3K27me3 enrichment, Wilcoxon test. J. GSEA of murine CC Ezh2Y641F gene modules against gene expression of EZH2 mutant FL cases vs. human CC. K. RT-qPCR in NB, CB and CC (n=4). Each dot represents a mouse, mean fold change mRNA levels normalized to Hprt1 (Abi2), Gapdh (Lgr5) or Rpl13 (Tnfrsf13c,Tnfrsf14 and Ltb) ± SEM; unpaired t test, **p<0.01, ***p<0.001. L. H3K27me3 ChIP-seq tracks and qChIP validation in CC. Each dot represents a mouse (n=3), mean ± SEM; unpaired t test, **p<0.01. See also Figure S5.
Figure 6.
Figure 6.. Decreased interaction and dependency on Tfh cells by Ezh2Y641F GC B cells
A. Five Cγ1-cre and 5 Ezh2Y641F mice were immunized with NP-CGG for 12 days and CCs (B220+CD38-Fas+CXCR4loCD86hi) were collected. WT CCs were stained with CFSE and Ezh2Y641F with CellTrace V450. Tfh (CD4+B220-PD1hiCXCR5hi) were sorted from OVA-immunized OT-II mice. CCs were pulsed ex vivo with OVA323–339 and then mixed with Tfh. B. Tfh-CC interaction was assessed by flow cytometry-based ex vivo assay. Tfh-CC conjugates were identified by gating on cell duplets. C. Tfh-CC duplets were normalized to CC singlets for quantification. WT CCs only, and WT CCs mixed with Ezh2Y641F CCs were incubated with Tfh. Each dot represents CCs from one mouse (n=5), mean ± SEM; unpaired t test. Results representative of 2 experiments. D. WT and Ezh2Y641F immunized mice (n=4) were treated with two doses of 100 µg anti CD40L or control IgG antibody. E. Representative flow cytometry plots of %GC B cells gated on live B cells of mice groups shown in D. F. Average percentage of GC B cells gated as shown in E. Each dot represents GC B cells from one mouse (n=4), mean ± SEM; unpaired t test. G. Mixed chimera mice (n=4) immunized with NP-OVA were treated with anti CD40L antibody as in D. H. Splenocytes and LN cells collected as shown in G were analyzed by flow cytometry, normalizing the percentage of CD45.1+ GC B cells (CD38-FAS+) to their parental CD45.1+ B cells (B220+DAPI-), and equivalent normalization with CD45.2+ populations. Each pair of connected dots represents a mouse; paired t tests. I. Ratio of Ezh2Y641F to WT GC B cells from H; mean ± SEM; unpaired t test. J. Mixed chimera mice (n=4) immunized with NP-OVA were treated with two doses of 150 µg anti ICAM-1 or control IgG antibody. K. Splenocytes and LN cells collected as shown in J were analyzed by flow cytometry as in H. L. Ratio of Ezh2Y641F to WT GC B cells from K; mean ± SEM; unpaired t test. Results in (D-L) representative of 2 to 4 experiments. See also Figure S6.
Figure 7.
Figure 7.. Ezh2 mutation induces reduction in clonality
A. Mutation frequency of V segments (n=3 mice), measured in proportion of mismatched nucleotide sites between each V segment of each sequence and its predicted germline V segment; p values Wilcoxon rank sum test. B. Diversity curves of YFP;Cγ1-cre (WT) and YFP;Ezh2Y641F mice generated through 1000 uniformly sampled bootstrap replicates. C. Lineage trees of three largest WT and Ezh2Y641F YFP mice. D. Distribution of 1000 bootstrap replicates showing total trunk/canopy (non-trunk) branch length ratio and internal/external branch length ratio of lineage trees obtained from WT and Ezh2Y641F YFP mice. Marginal histograms of each statistic are shown on the top and right sides. E. IF confocal microscopy images of R26R-Confetti splenic GCs at day 10 post-SRBC immunization. F. Heatmap representing quantification of clonal abundance from GCs derived from 4 R26R-Confetti;Cγ1-cre and 4 R26R-Confetti;Ezh2Y641F mice. Scale from white to red denotes the fractional abundance of each clone. G-H. Shannon entropy was calculated per GC (represented by dots, with each color representing GC from a different mouse, n WT=34, Ezh2Y641F=39) (G) and for all GCs per mouse (H). I. Diversity curves of R26R-Confetti mice generated as in B. J. Distribution of lineage trees obtained from R26R-Confetti mice analyzed as in D. See also Figure S7.
Figure 8.
Figure 8.. Ezh2Y641F GC B cells switch from T cell to FDC dependency
A. Mixed chimera mice (n=5) immunized with NP-OVA were treated with two doses of 100 µg lymphotoxin mLTβR-mIgG1 or control IgG antibody. B-C. Effect of mLTβR-mIgG1 was evaluated by flow cytometry in splenic B cells (B) and GC B cells (C); data are mean (n=5) ± SEM; unpaired t test. D. GC B cells collected as shown in A were analyzed by flow cytometry, by normalizing the percentage of CD45.1+ GC B cells (CD38-FAS+) to their parental CD45.1+ B cells (B220+DAPI-), and equivalent normalization with CD45.2+ populations. Each pair of connected dots represents a mouse; paired t tests. E. Ratio of Ezh2Y641F to WT GC B cells from D; mean ± SEM; unpaired t test. F. Analysis of non-GC B cells (CD38+FAS-) was done as in D. G. Analysis of FDC patterns in a tissue microarray with 155 grade 1 or 2 FL samples (120 WT + 35 EZH2Y641); p values Fisher’s exact test. H. FDC patterns were clasified based on the expression of CD21/CD35 by IHC.

Comment in

References

    1. Anderson SM, Tomayko MM, Ahuja A, Haberman AM, and Shlomchik MJ (2007). New markers for murine memory B cells that define mutated and unmutated subsets. J Exp Med 204, 2103–2114. - PMC - PubMed
    1. Beguelin W, Popovic R, Teater M, Jiang Y, Bunting KL, Rosen M, Shen H, Yang SN, Wang L, Ezponda T, et al. (2013). EZH2 is required for germinal center formation and somatic EZH2 mutations promote lymphoid transformation. Cancer Cell 23, 677–692. - PMC - PubMed
    1. Beguelin W, Rivas MA, Calvo Fernandez MT, Teater M, Purwada A, Redmond D, Shen H, Challman MF, Elemento O, Singh A, and Melnick AM (2017). EZH2 enables germinal centre formation through epigenetic silencing of CDKN1A and an Rb-E2F1 feedback loop. Nat Commun 8, 877. - PMC - PubMed
    1. Beguelin W, Teater M, Gearhart MD, Calvo Fernandez MT, Goldstein RL, Cardenas MG, Hatzi K, Rosen M, Shen H, Corcoran CM, et al. (2016). EZH2 and BCL6 Cooperate to Assemble CBX8-BCOR Complex to Repress Bivalent Promoters, Mediate Germinal Center Formation and Lymphomagenesis. Cancer Cell 30, 197–213. - PMC - PubMed
    1. Benjamini Y, and Hochberg Y (1995). Controlling the False Discovery Rate: A Practical and Powerful Approach to Multiple Testing. Journal of the Royal Statistical Society.

Publication types

MeSH terms

Substances

LinkOut - more resources