. 2020 Jun 4;26(6):845-861.e12.
doi: 10.1016/j.stem.2020.04.012. Epub 2020 May 11.

Zonation of Ribosomal DNA Transcription Defines a Stem Cell Hierarchy in Colorectal Cancer

Affiliations

Zonation of Ribosomal DNA Transcription Defines a Stem Cell Hierarchy in Colorectal Cancer

Clara Morral et al. Cell Stem Cell. .

Abstract

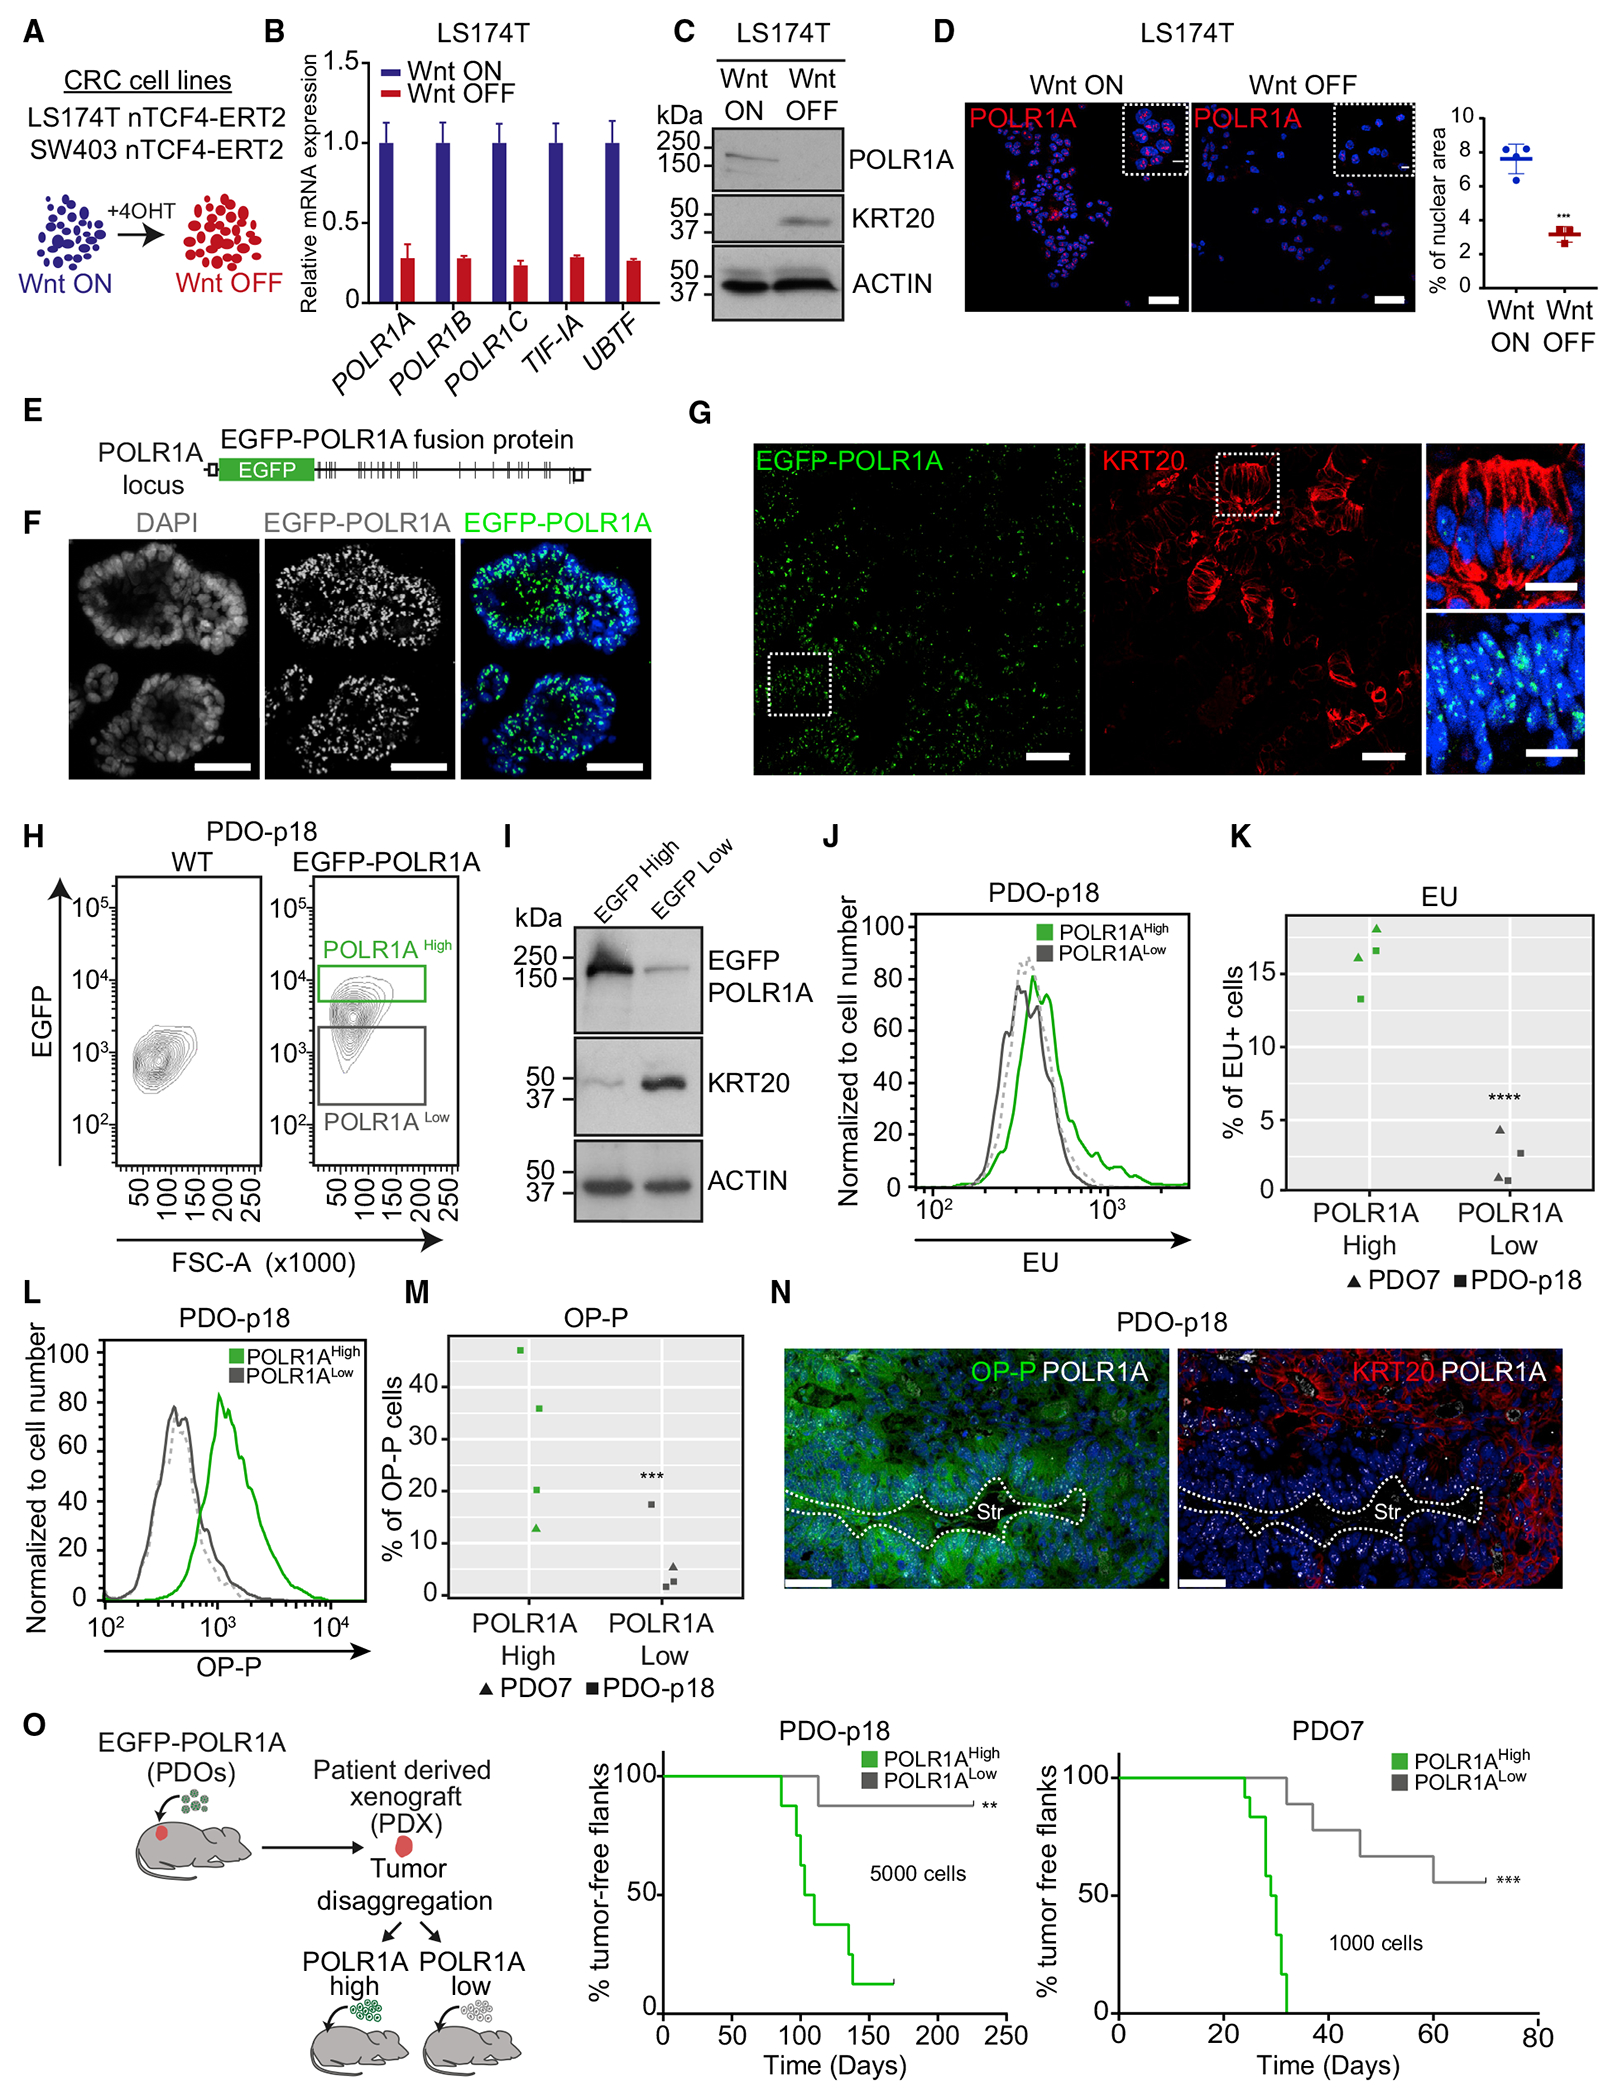
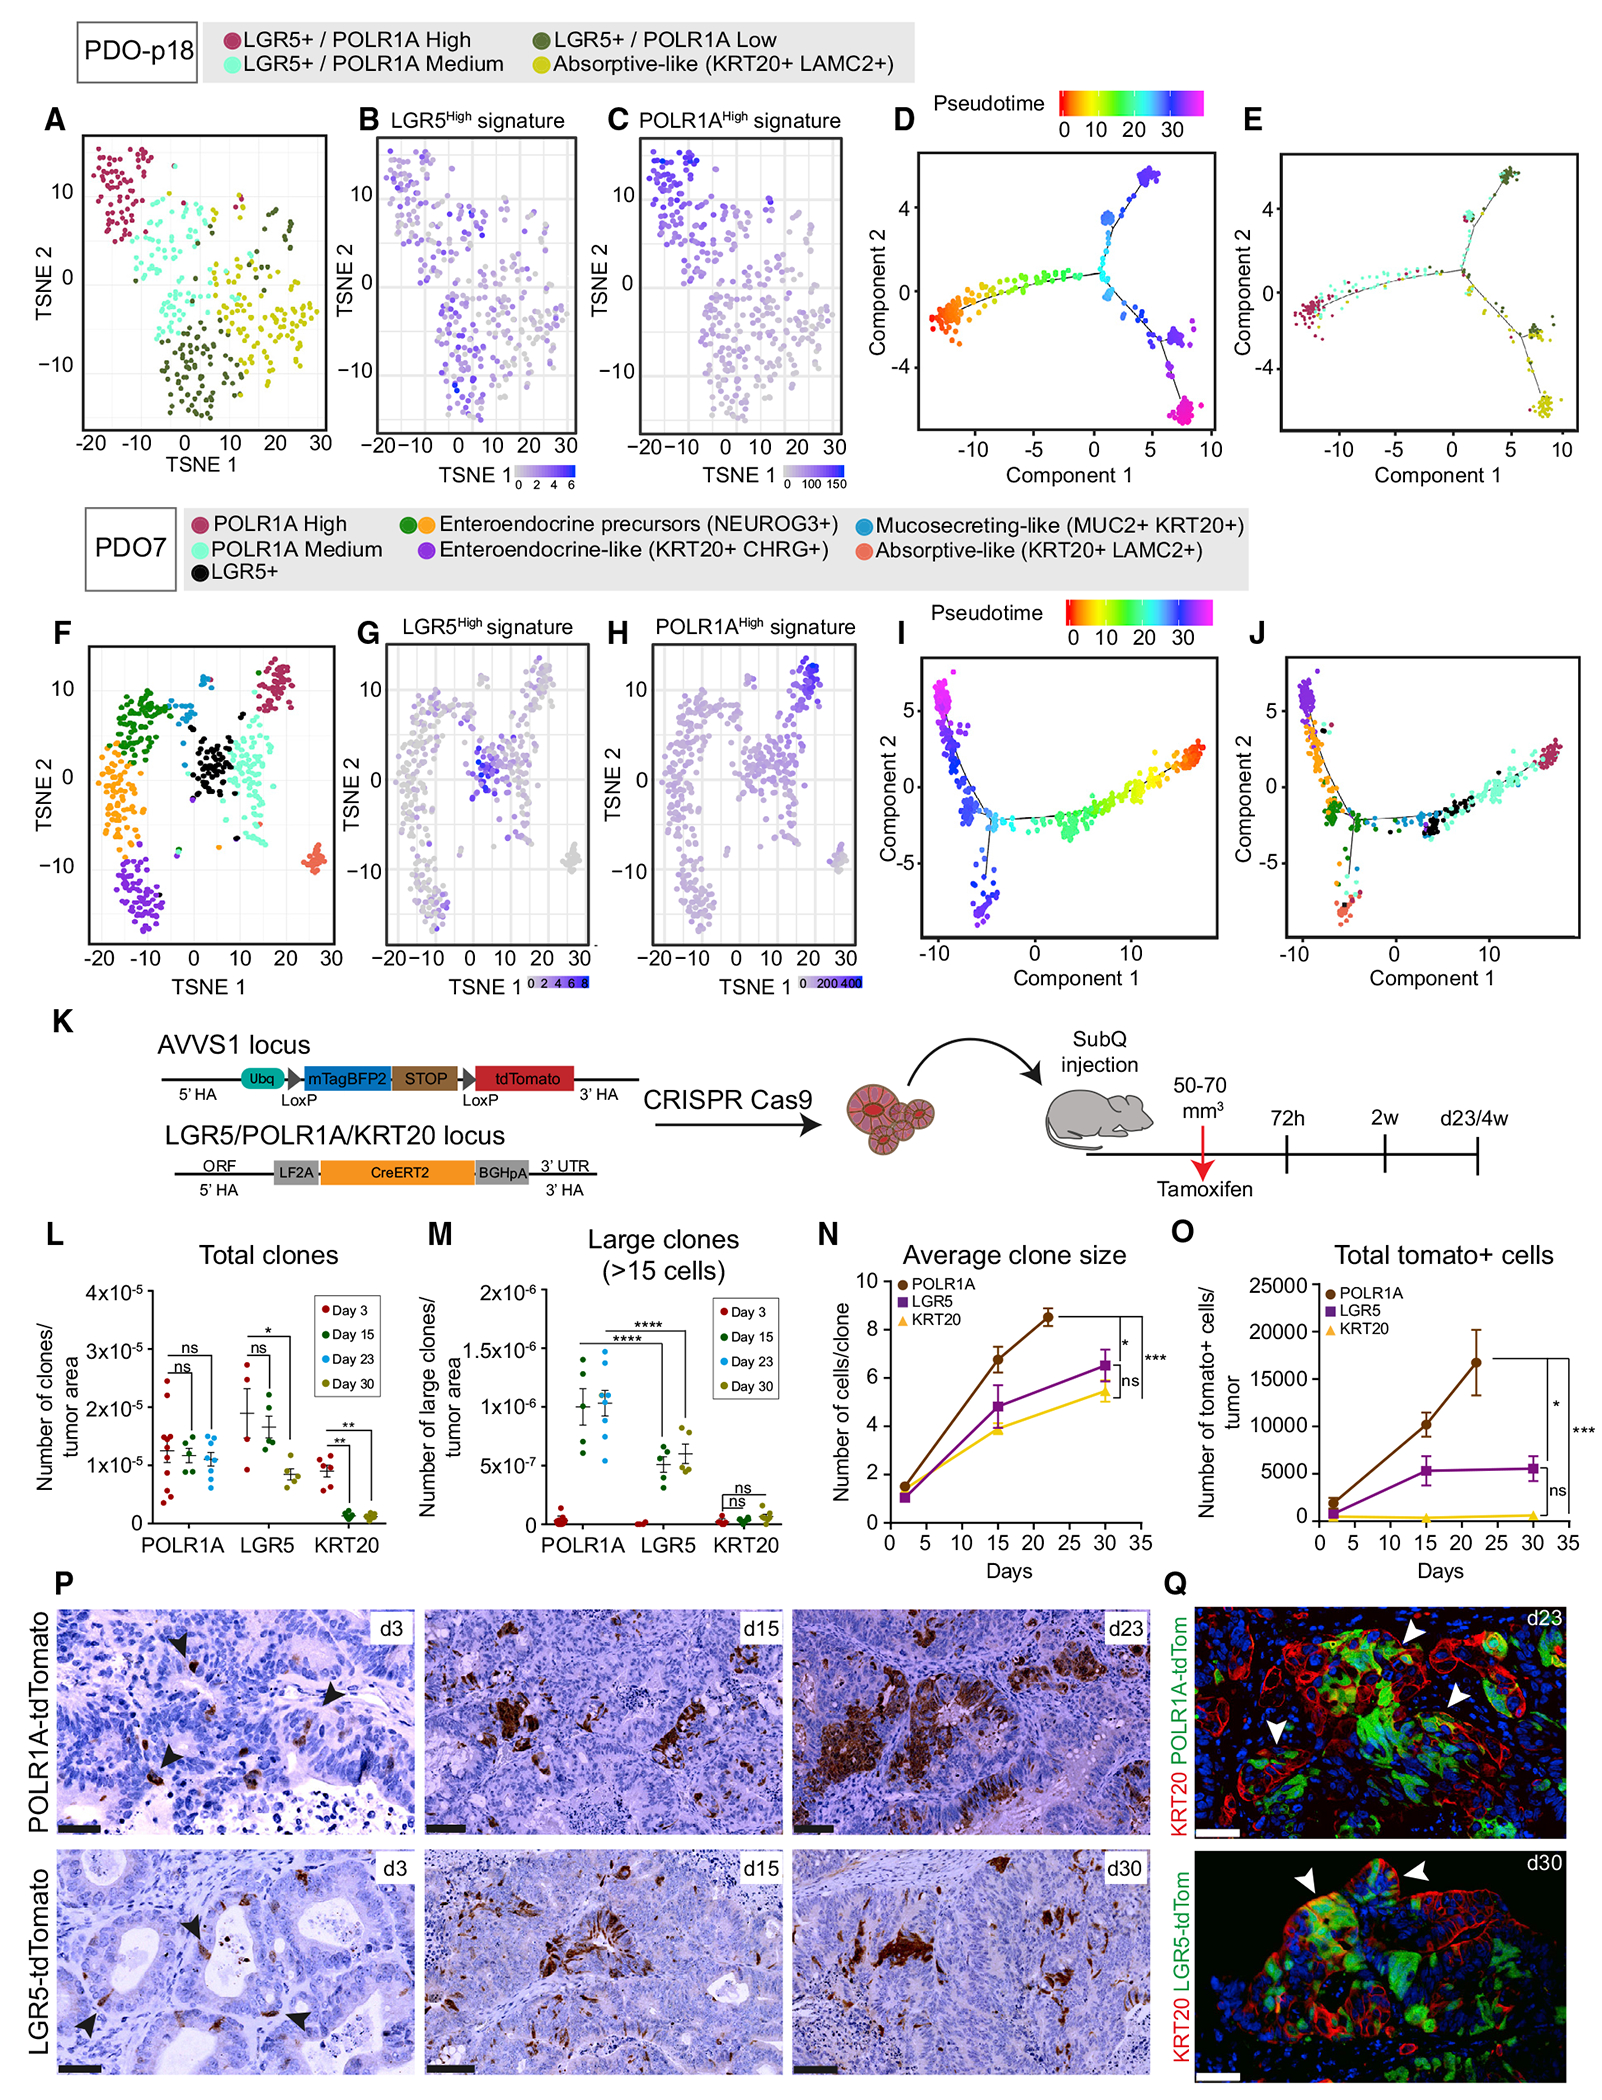
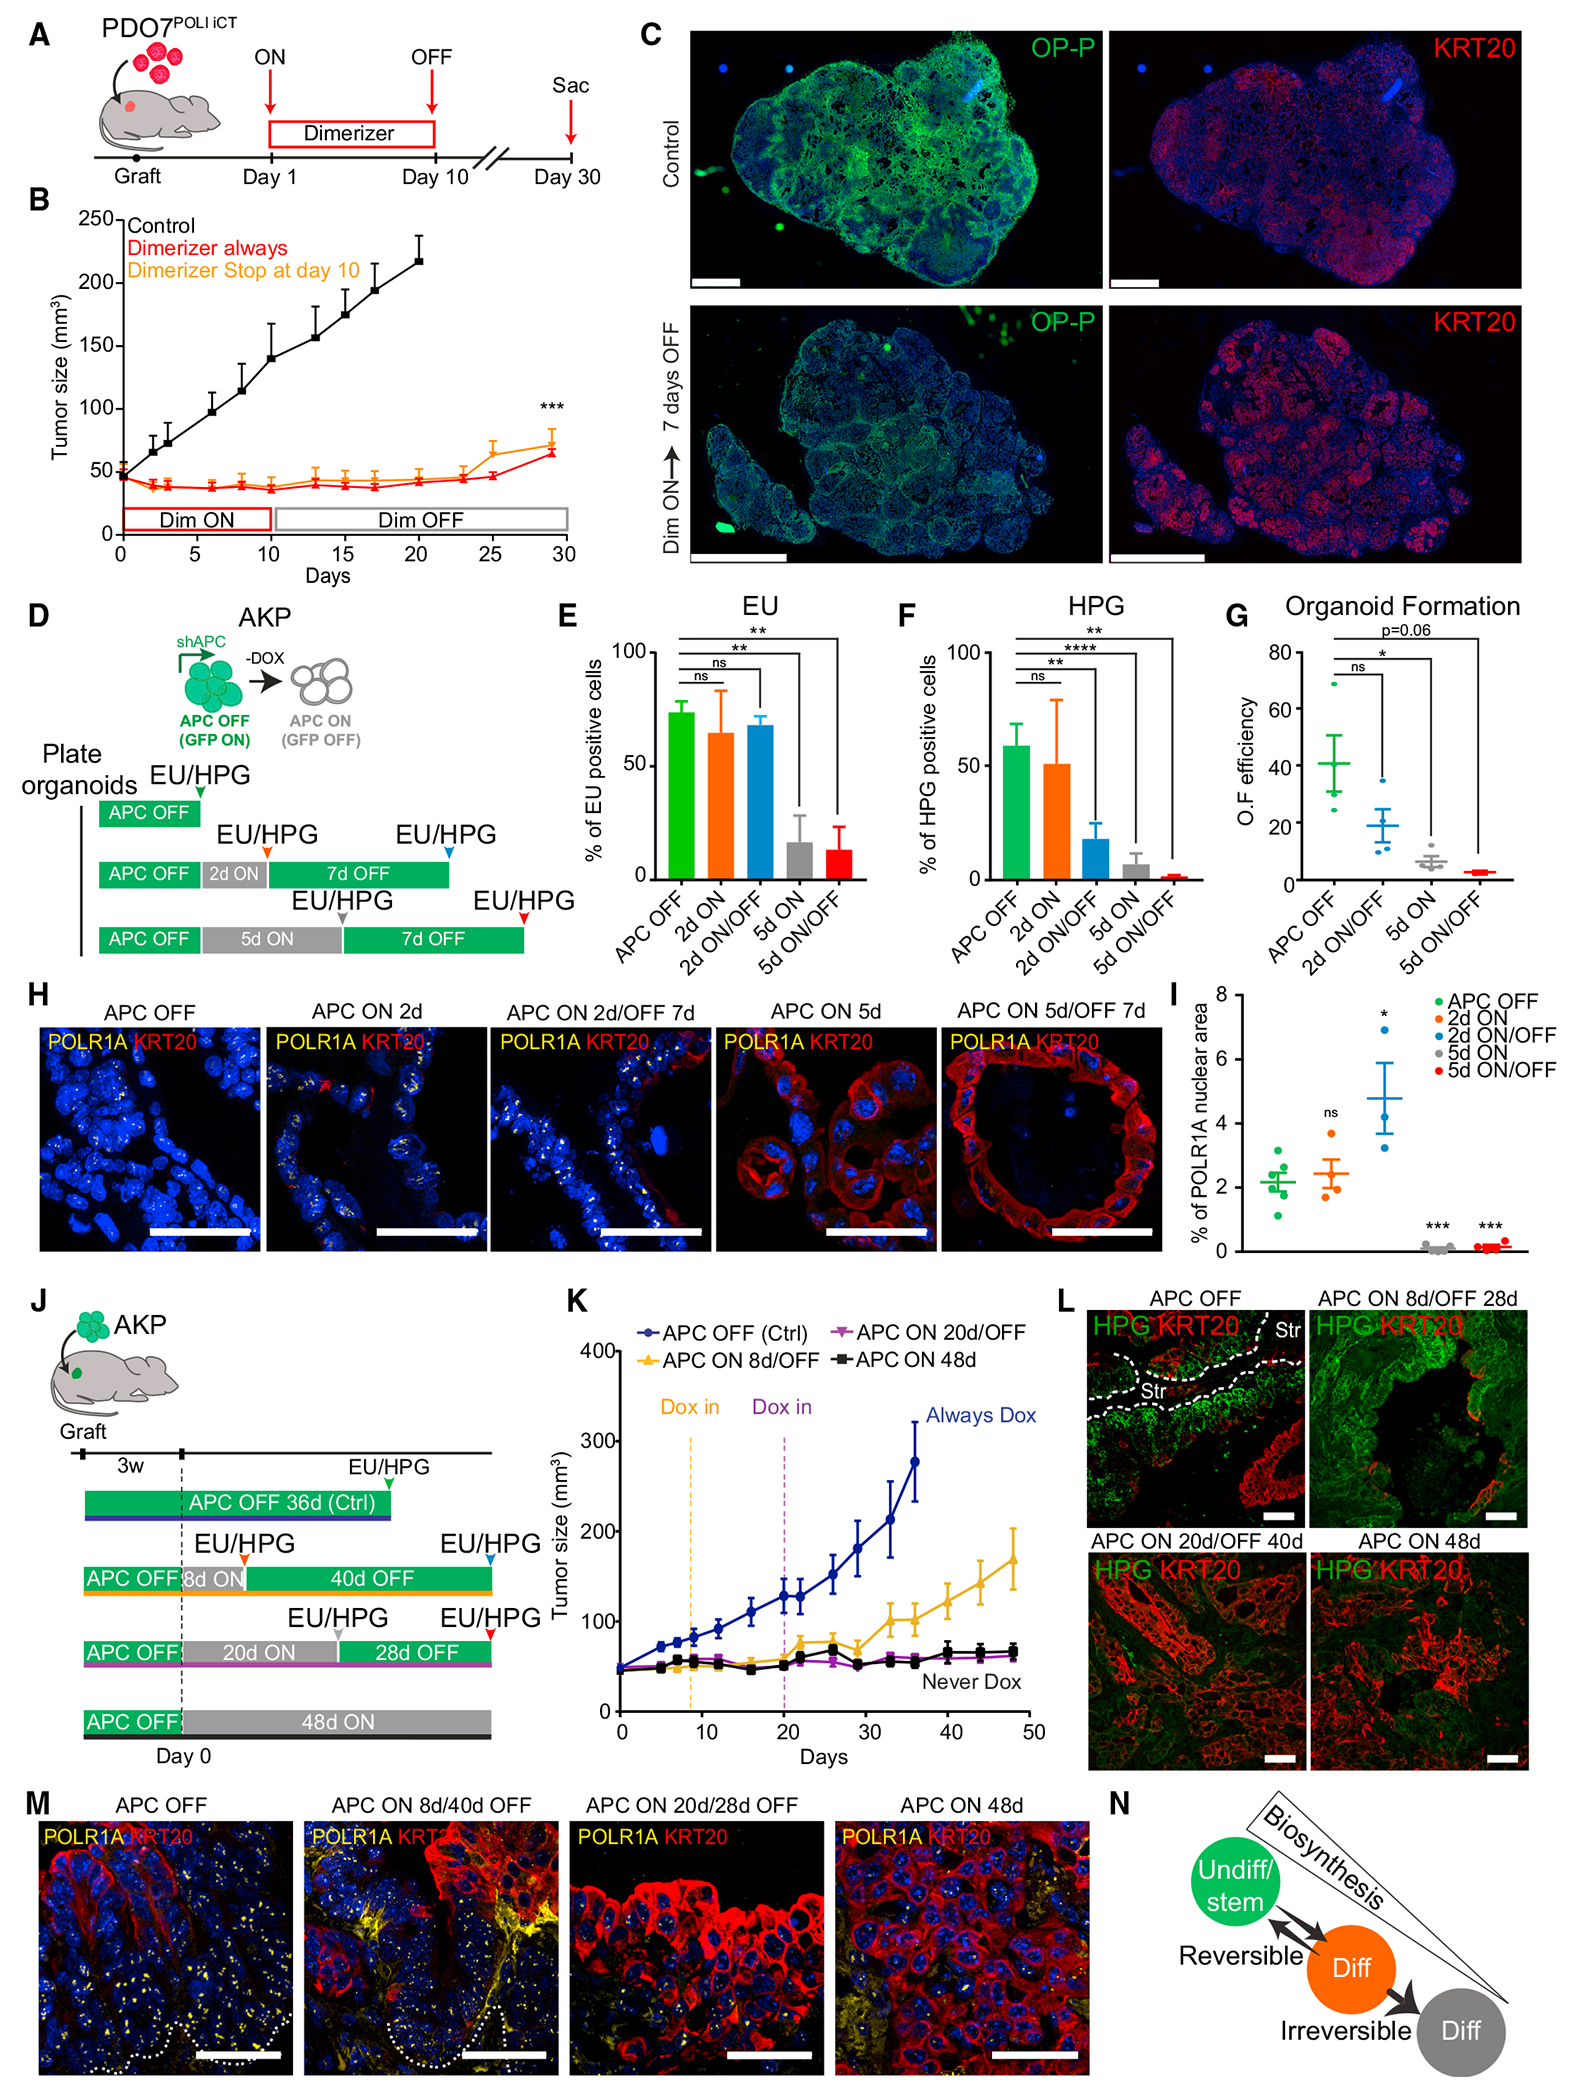
Colorectal cancers (CRCs) are composed of an amalgam of cells with distinct genotypes and phenotypes. Here, we reveal a previously unappreciated heterogeneity in the biosynthetic capacities of CRC cells. We discover that the majority of ribosomal DNA transcription and protein synthesis in CRCs occurs in a limited subset of tumor cells that localize in defined niches. The rest of the tumor cells undergo an irreversible loss of their biosynthetic capacities as a consequence of differentiation. Cancer cells within the biosynthetic domains are characterized by elevated levels of the RNA polymerase I subunit A (POLR1A). Genetic ablation of POLR1A-high cell population imposes an irreversible growth arrest on CRCs. We show that elevated biosynthesis defines stemness in both LGR5+ and LGR5- tumor cells. Therefore, a common architecture in CRCs is a simple cell hierarchy based on the differential capacity to transcribe ribosomal DNA and synthesize proteins.

Keywords: CRC; Cancer Stem Cell; biosynthetic capacity; plasticity; stem cell hierarchy.


Conflict of interest statement

Declaration of Interests The authors declare no competing financial interests.

Figures

Figure 1.
Figure 1.. rDNA Transcription and Protein Synthesis across Different Models of CRC
(A) OP-P incorporation in a patient-derived xenograft (PDX). Lu, lumen; Str, stroma. Scale bars: (A), 500 μm; (A′), 100 μm; (A″), 250 μm. Dashed lines outline the epithelial glands. (B) OP-P incorporation in primary human CRC implanted orthotopically in mice. Str, stroma. Scale bars: (B), 2.5 mm; (B′), 100 μm; (B″), 250 μm. Dashed lines outline the epithelial glands. (C) OP-P incorporation in spontaneous liver metastasis generated from intrasplenic (IS) injection of PDO7. Lu, lumen. Scale bars: (C), 5 mm; (C′) and (C″), 250 μm. (D) EU incorporation in a PDX. Dashed lines outline the epithelial glands. Lu, lumen. Scale bars: (D), 500 μm; (D′), 250 μm; (D″), 50 μm. (E) Analysis of OP-P and EU in EPHB2 tumor cell populations. (F) Representative flow cytometry plots of EU and OP-P into EPHB2+ or EPHB2 tumor cells purified from indicated PDXs. (G) Percentage of OP-P+ and EU+ cells within EPHB2-high and -low tumor cells. ****p =1.92 × 10⁻⁷ and ****p = 1.51 ×10⁻⁹ in a mixed-effects linear model (n = 3 PDX, 2 mice for each PDX). (H) EPHB2-based cell purification from human CRC samples. (I) GSEA of EPHB2-high and -low tumor cells sorted from primary CRCs. For all Gene Ontology (GO) SLIM terms, false discovery rate (FDR) q = 0. (J) Spatial zonation model of protein synthesis-rDNA transcription in CRCs. Images in (A)-(D) are tiled and stitched.
Figure 2.
Figure 2.. Characterization of Biosynthetic Tumor Cells in CRCs
(A and B) Representative Ki67 and OP-P (A) or EU (B) patterns in PDXs. Dashed lines outline the epithelial glands. Scale bars: (A), 100 μm; (B), 250 μm. (C and D) In situ hybridization of Lgr5(top images) and immunohistochemistry (IHC) of KRT20 (bottom images) in serial sections of 2 representative human primary CRCs. Scale bars: 100 μm. (E) Quantification of Lgr5+, KRT20+, and double-negative cells across a collection of primary CRC human samples (reproduced from Merlos-Suárez et al., 2011). (F) Schematic representation of the Lgr5-inducible Caspase9-tdTomato (LiCT) targeting construct. (G and J) qRT-PCR analysis of ISC and differentiation genes in PDO-p18-LiCT (G) and PDO7-LiCT (J). Bars depict the mean and upper and lower limits of relative expression obtained from a representative experiment. (H and K) LGR5-tdTomato staining in PDO-p18 (H) and PDO7 (K) tumor xenografts. Scale bars: (H), 2.5 mm; (K), 1 mm. (I and L) LGR5-tdTomato and OP-P staining in PDO-p18 (I) and PDO7 (L) tumor xenografts. Scale bars: (I), 50 μm; (L), 100 μm. (M-O) OP-P and KRT20 staining in PDO7 xenografts. In (M), the dashed line delimits a KRT20+ gland in contact with the stroma. (N) and (N′) show KRT20+ cells in the lumen of a tumor gland. (O) Single KRT20+ cells intermingled within the OP-P+ domain (arrows). Str, stroma; Lu: lumen. Scale bars: (M), 250 μm; (N), 500 ¼m; (O), 100 μm. The images in (A), (B), (I), and (L)–(O) are tiled and stitched.
Figure 3.
Figure 3.. WNT-Driven Differentiation Causes Protein and RNA Synthesis Decrease
(A) qRT-PCR analysis of ISC and differentiation genes in control (Wnt ON) or differentiated (Wnt OFF) LS174T CRC cells. Bars depict the mean and upper and lower limits of relative expression obtained from a representative experiment. (B) qRT-PCR analysis of ISC and differentiation genes in control (APC OFF) or differentiated (APC ON) AKP mouse organoids. Bars depict the mean and upper and lower limits of relative expression obtained from a representative experiment. (C) OP-P incorporation and KRT20 in LS174T CRC cells over differentiation. Scale bars: 50 μm. (D) Percentage of OP-P+ and EU+ cells detected by flow cytometry in LS174T after 7 days of in vitro differentiation. For OP-P, ****p < 0.0001 (n = 4); for EU, **p = 0.0078 (n = 3) in an unpaired 2-tailed t test. Confidence intervals (CIs) are mean ± SEM. (E) HPG incorporation and KRT20 staining in AKP mouse organoids over differentiation. Scale bars: 50 μm. (F) Percentage of HPG+ and EU+ cells detected by flow cytometry in AKP organoids over differentiation. For HPG, ****p ≤ 0.0001 (n = 4); for EU, *p = 0.0131 (n = 3) in an unpaired 2-tailed t test. CIs are mean ± SEM. (G) Pre-rRNA levels in LS174T and SW403 cells after 4 days of differentiation. Bars depict the mean and upper and lower limits of relative expression obtained from a representative experiment. (H) 5.8S rRNA and KRT20 staining in LS174T cells over differentiation. Scale bars: 20 μm. (I) Representative 5.8S and KRT20 staining of a primary human CRC sample. Scale bar: 1 mm. (J) Representative plot of KRT20/5.8S intensity analysis from (I). Kolmogorov-Smirnov (KS) test p = 8.35 × 10⁻⁵. (K) Experimental setup for (L). (L) HPG incorporation and KRT20 staining in LS174T cells during differentiation. Arrows point at double-positive cells on day 4. Scale bars: 20 μm. Images are tiled and stitched. (M) Experimental design for protein tracing experiment. (N) Immunoprecipitation of KRT20 using whole-protein extracts from HPG-labeled and -traced samples. The numbers below the panels indicate the intensity of the signal. (O and P) Quantification of KRT20 and HPG intensity at day 3 (O) and day 7 (P) of differentiation.
Figure 4.
Figure 4.. POLR1A-High Tumor Cells Display High Biosynthetic and Tumorigenic Capacities
(A) CRC cell line differentiation via inducible NTCF4. (B) qRT-PCR of rRNA transcriptional machinery components in LS174T after 4 days of in vitro differentiation. Bars depict the mean and upper and lower limits of relative expression obtained from a representative experiment. (C) Western blot analysis of POLR1A and KRT20 in LS174T during differentiation. (D) POLR1A staining in LS174T tumor cells after 7 days of in vitro differentiation. Scale bars: 20 μm. Right panel: quantification of nuclear area occupied by POLR1A in control (Wnt ON) or upon differentiation (Wnt OFF). p = 0.0005 in unpaired 2-tailed t test (n = 4 images for Wnt ON and n = 3 images for Wnt OFF). CIs are mean ± SEM. (E) Knock-in construct for the generation of EGFP-POLR1A fusion protein. (F) EGFP-POLR1A labels the nucleoli of PDO-p18 in vitro. Scale bar: 50 μm. (G) EGFP-POLR1A and KRT20 staining in PDO-p18 xenografts. Scale bars: 50 μm, and 10 μm in the insets. (H) Representative flow cytometry plot of EGFP-POLR1A in knock-in PDO-p18 xenografts (right plot). Squares indicate the sorted EGFP-POLR1A populations. The top 10% were considered to be POLR1A-high. (I) Western blot of POLR1A and KRT20 in indicated sorted populations from (H). (J) Representative flow cytometry plot of EU incorporation in EGFP-POLR1A cells purified from PDO-p18 xenografts. (K) Percentage of EU+ cells in POLR1A sorted cells from tumor xenografts. ****p < 0.0001 in a mixed-effects linear model (n = 2 different PDX and 2 experimental replicates). (L) Representative flow cytometry plot of OP-P incorporation in EGFP-POLR1A tumor cell populations purified from PDO-p18 xenograft. (M) Percentage of OP-P+ cells in POLR1A sorted cells from tumor xenografts. ***p = 0.001 in a mixed-effects linear model (n = 2 different PDX; 3 replicates for PDO-p18 and 1 for PDO7). (N) OP-P and POLR1A (left panel) and KRT20 and POLR1A (right panel) staining in PDO-p18 xenograft. Scale bar: 50 μm. (O) Tumor initiation capacity of EGFP-POLR1A-high and -low tumor cells purified from PDO-p18 (left) and PDO7 (right). Kaplan-Meier plots (n = 8 xenografts). **p = 0.0032 for PDO-p18 and ****p < 0.0001 for PDO7 in a Gehan-Breslow-Wilcoxon test.
Figure 5.
Figure 5.. Mapping of Tumor Cell Populations by Single-Cell Profiling and Clonal Analysis
(A and F) t-distributed Stochastic Neighbor Embedding (t-SNE) plots of 388 (PDO-p18, A) and 511 (PDO7, F) single cells from tumor xenografts colored by cluster identities. (B, C, G, and H) Normalized expression of the LGR5 (B and G) and the POLR1A-high (C and H) signatures in PDO-p18 (B and C) and PDO7 (G and H). (D, E, I, and J) Trajectory graph representations for PDO-p18(D and E) and PDO7 (I and J), color-coded by pseudotime ordering of cells (D and I) and their cluster identity (E and J). (K) Knock-in constructs and experimental design for lineage tracing experiments. (L) Quantification of total number of clones per tumor area at indicated time points. Each dot represents quantifications in a section of a different tumor. n = 4–10 tumors per time point and cell population. *p = 0.0107 and **p < 0.002 in a 2-way ANOVA using Tukey’s multiple comparison test. CIs are mean ± SEM. (M) Quantification of the number of large clones (>15 cells) per tumor area at indicated time points. Each dot represents quantifications in a section of a different tumor. n = 4–10 tumors per time point and population. ****p < 0.0001 in a 2-way ANOVA using Tukey’s multiple comparison test. CIs are mean ± SEM. (N) Quantification of clone size over time. Data represent the average number of cells per clone. Each dot represents quantifications in a section of a different tumor. n = 4–10 tumors per time point and population. *p = 0.026 and ***p = 0.005 in a 1-way ANOVA using Tukey’s multiple comparison test for the last time points. CIs are mean ± SEM. (O) Quantification of the total number of tomato+ cells per tumor sample overtime. Data represent the average of tomato+ cells per time point. Each dot represents quantifications in a section of a different tumor. n = 4–10 tumors per time point and population. *p = 0.035 and ***p = 0.007 in a 1-way ANOVA using Tukey’s multiple comparison test for the last time points. CIs are mean ± SEM. (P) Representative images of tdTomato on tumor xenografts. Arrowheads point to single-cell clones induced at day 3. Scale bars: 50 μm in d3 and 100 mm in d15 and d23 and d30. (Q) Immunofluorescence (IF) for KRT20 and tdTomato in tumor sections after 23 or 30 days of tamoxifen treatment. White arrowheads indicate tdTomato clones containing KRT20+ cells. Scale bars: 50 μm. Images are tiled and stitched.
Figure 6.
Figure 6.. POLR1A-High Tumor Cells Sustain CRC Growth
(A) POLR1A knock-in cell ablation cassette (POLiCT) in PDOs. (B) Experimental design of in vivo ablation experiments. (C and D) Representative images of tdTomato and KRT20 in xenografts from POLiCT knock-in PDOs. Scale bars: 250 μm. (E) Representative flow cytometry plots of tdTomato expression in controls or 4 days post-POLR1A ablation in PDO7 (left) and PDO-p18 (right) in vivo . Wild-type (WT) unmodified clones are shown for reference. (F) Tumor growth during chronic POLR1A ablation. ****p < 0.0001 and ***p = 0.004 in a 2-tailed t test. For PDO7, n = 3 control and n = 6 treated tumors. For PDO-p18, n = 5 control and n = 6 treated tumors. CIs are mean ± SEM. (G) OP-P incorporation in control tumors or after 10 days of POLR1A ablation. Str, stroma. Dashed lines delimit tumor glands from stroma. Scale bars: 250 and 100 μm. (H) KRT20 staining in control or POLR1A-ablated PDO7. Scale bars: 2.5 mm. (I) Quantification of KRT20+ areas in control or POLR1A-ablated PDO7 tumors. ***p = 0.0009 in an unpaired 2-tailed t test. n = 8 controls and n = 9 treated tumors. CIs are mean ± SEM. (J) Knock-in ablation cassette for the generation of LiCT. (K) Representative flow cytometry plot of LGR5-td Tomato levels in control or after 5 days of dimerizer in PDO-p18. (L) Tumor growth during chronic ablation of LGR5+ tumor cells in PDO-p18. ***p = 0.0010. (M) OP-P patterns in untreated mice or after 14 days of dimerizer. Dashed lines delimit the tumor glands. Scale bars: 250 μm. Str: stroma. (N) Knock-in ablation cassette for the generation of LGR5-iCaspase9-EGFP (LiCG) in PDO7. (O) Representative flow cytometry plot of LGR5-EGFP in control conditions or after 5 days of dimerzer in PDO7. (P) Tumor growth during chronic ablation of LGR5 tumor cells in PDO7. (Q) OP-P patterns in untreated mice or after 14 days of dimerizer. Scale bars: 250 μm. Images in (C) and (D) are tiled and stitched.
Figure 7.
Figure 7.. Loss of Biosynthetic Capacity Drives CRCs into an Irreversible Differentiation State
(A) Experimental design. (B) Tumor growth in untreated mice, during permanent dimerizer treatment (in red), or after 10days of dimerizer treatment (in yellow) to ablate POLR1A in PDO7. ***p = 0.0010 and ***p = 0.0008 in an unpaired 2-tailed t test (n = 3 control, n = 6 always dimerizer, n = 6 stop dimerizer tumors). CIs are mean ± SEM. (C) OP-P incorporation and KRT20 expression in control tumors or in tumors 7 days after dimerizer withdrawal. Scale bars: 1 mm (upper images) and 2.5 mm (lower images). (D) Experimental design for in vitro reversibility experiments in AKP organoids. Arrows indicate sample collection. (E and F) Quantification of EU (E) or (F) HPG incorporation during differentiation (ON) and after reversion (ON/OFF). For EU: p = 0.6, p = 0.5, **p = 0.004, and **p = 0.0019 (n = 4, 3, 2, 3, 3); and HPG: p = 0.62, **p = 0.007, ****p < 0.0001, and **p = 0.0015 (n = 4, 4, 2, 4, 2) in an unpaired 2-tailed t test. CIs are mean ± SEM. (G) Organoid formation assay during in vitro differentiation (ON) and after reversion (ON/OFF). p = 0.10, *p = 0.01, p = 0.06 (n = 4, 4, 4,2) in an unpaired 2-tailed t test. CIs are mean ± SEM. (H) Representative examples of POLR1A and KRT20 staining in organoids during in vitro differentiation (ON) or after reversion (ON/OFF). Scale bars: 50 μm. (I) Quantification of POLR1A nuclear area from (H). p = 0.6, *p = 0.01, ***p = 0.0001, and ***p = 0.0006 (n = 6, 4, 3, 5 images per condition) in an unpaired 2-tailed t test. CIs are mean ± SEM. (J) Experimental design for in vivo reversibility experiments of AKP tumors. (K) Tumor growth corresponding to (J). **p = 0.0088 and p = 0.709 in an unpaired 2-tailed t test (n = 8, 10, 7 tumors). CIs are mean ± SEM. (L) Representative images of HPG incorporation and KRT20 in AKP tumor xenografts. (M) POLR1A and KRT20 in AKP xenografts during differentiation (ON) and after the reversion (ON/OFF). Scale bars: 50 μm. (N) Differentiation-driven irreversible loss of plasticity in CRC. Images in (H), (L), and (M) are tiled and stitched.

Comment in

References

    1. Ajore R, Raiser D, McConkey M, Jöud M, Boidol B, Mar B, Saksena G, Weinstock DM, Armstrong S, Ellis SR, et al. (2017). Deletion of ribosomal protein genes is a common vulnerability in human cancer, especially in concert with TP53 mutations. EMBO Mol. Med 9, 498–507. - PMC - PubMed
    1. Ashburner M, Ball CA, Blake JA, Botstein D, Butler H, Cherry JM, Davis AP, Dolinski K, Dwight SS, Eppig JT, et al.; The Gene Ontology Consortium (2000). Gene ontology: tool for the unification of biology. Nat. Genet 25, 25–29. - PMC - PubMed
    1. Aytes A, Molleví DG, Martinez-Iniesta M, Nadal M, Vidal A, Morales A, Salazar R, Capellà G, and Villanueva A (2012). Stromal interaction molecule 2 (STIM2) is frequently overexpressed in colorectal tumors and confers a tumor cell growth suppressor phenotype. Mol. Carcinog 51, 746–753. - PubMed
    1. Barna M, Pusic A, Zollo O, Costa M, Kondrashov N, Rego E, Rao PH, and Ruggero D (2008). Suppression of Myc oncogenic activity by ribosomal protein haploinsufficiency. Nature 456, 971–975. - PMC - PubMed
    1. Bates D, Mächler M, Bolker B, and Walker S (2014). Fitting Linear Mixed-Effects Models using lme4. J. Stat. Softw 67, 10.18637/jss.v067.i01. - DOI

Publication types

Substances