. 2020 May 12;12(9):8680-8701.
doi: 10.18632/aging.103191. Epub 2020 May 12.

STAT1-induced upregulation of lncRNA KTN1-AS1 predicts poor prognosis and facilitates non-small cell lung cancer progression via miR-23b/DEPDC1 axis

Affiliations

STAT1-induced upregulation of lncRNA KTN1-AS1 predicts poor prognosis and facilitates non-small cell lung cancer progression via miR-23b/DEPDC1 axis

Changmin Liu et al. Aging (Albany NY). .

Abstract

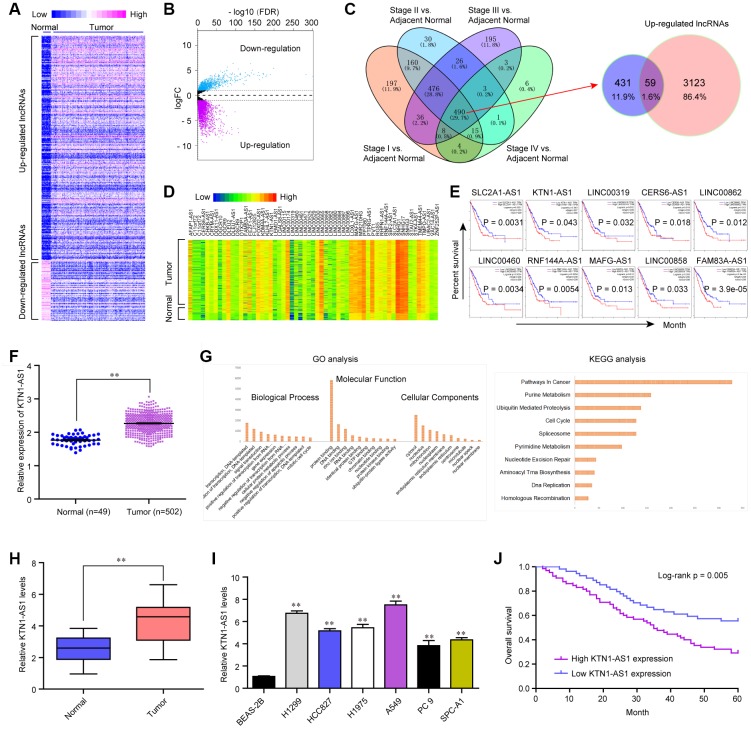
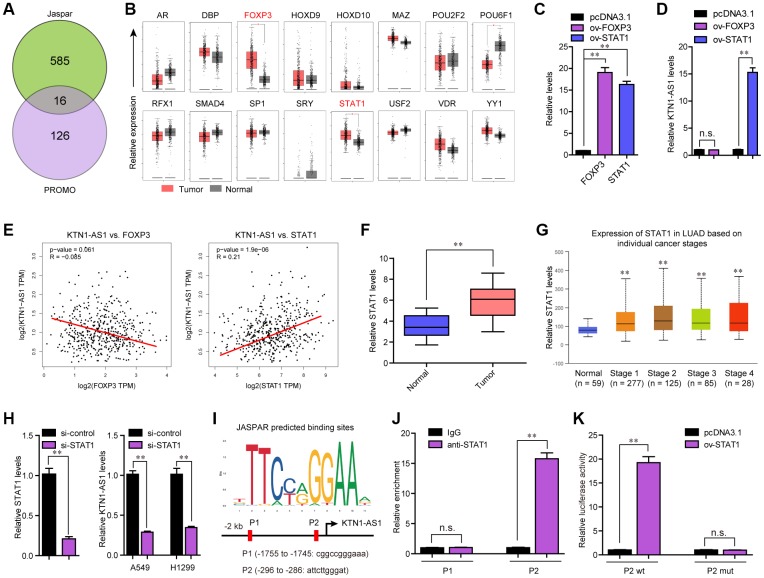
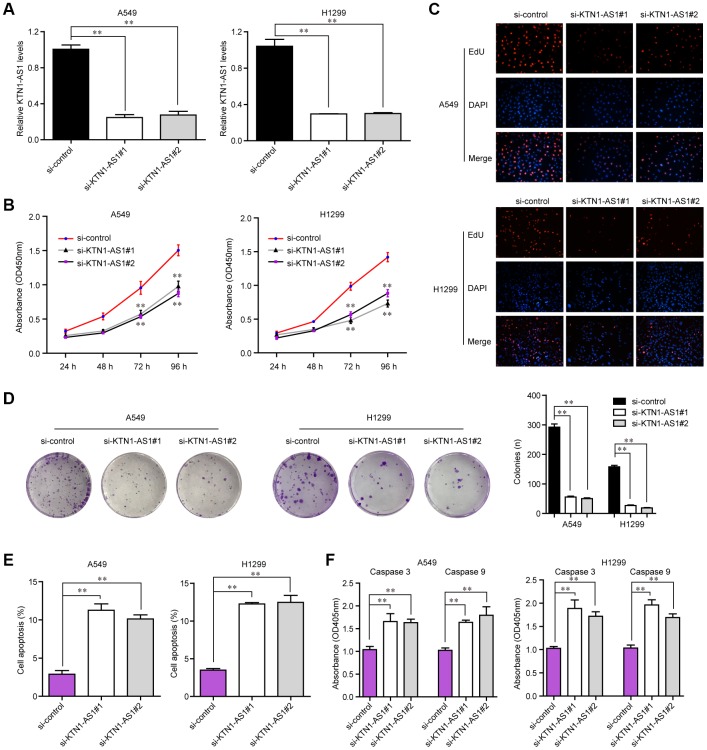
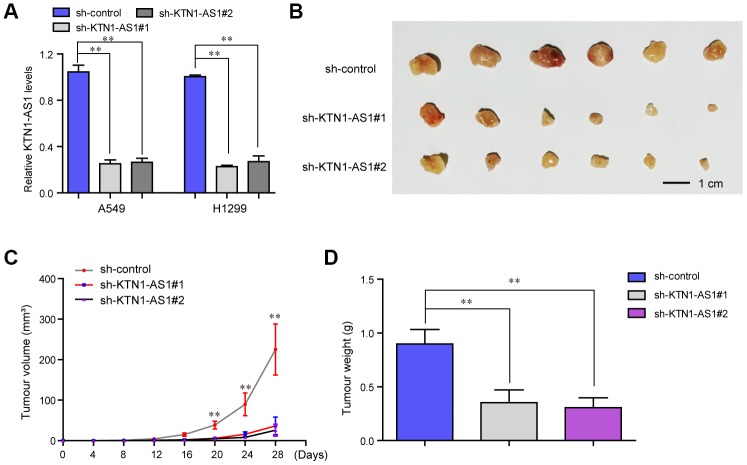
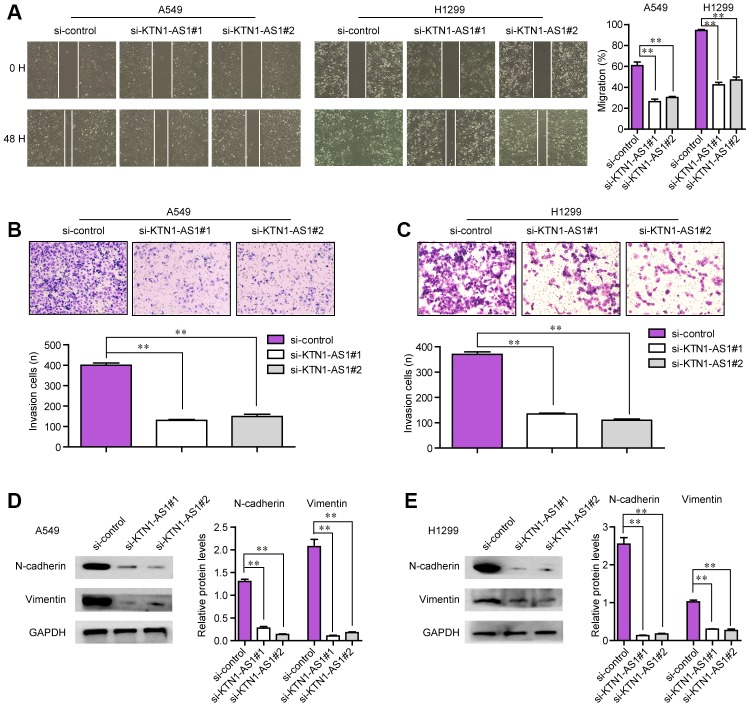
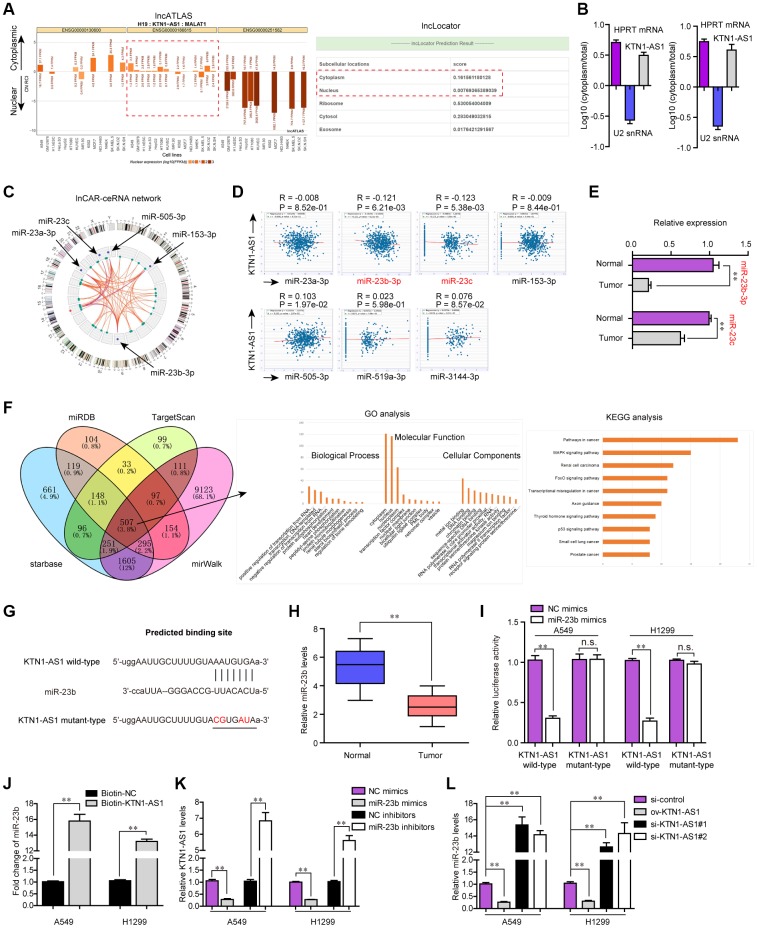
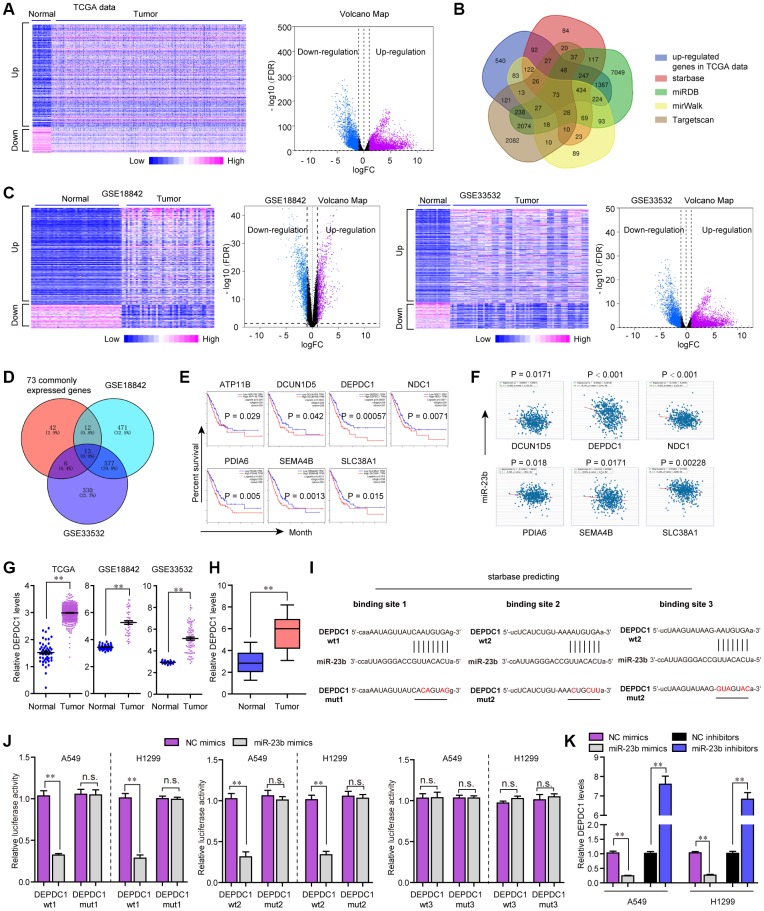
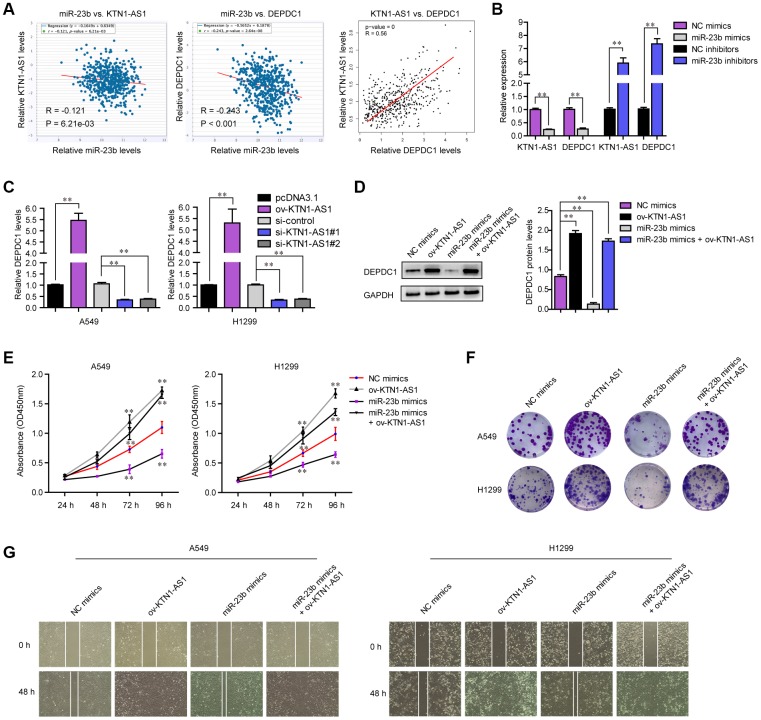
Several of the thousands of long noncoding RNAs (lncRNAs) have been functionally characterized in various tumors. In this study, we aimed to explore the function and possible molecular mechanism of lncRNA KTN1 antisense RNA 1 (KTN1-AS1) involved in non-small cell lung cancer (NSCLC). We identified a novel NSCLC-related lncRNA, KTN1 antisense RNA 1 (KTN1-AS1) which was demonstrated to be distinctly highly expressed in NSCLC. KTN1-AS1 upregulation was induced by STAT1. Clinical study also suggested that higher levels of KTN1-AS1 were associated with advanced clinical progression and a shorter five-year overall survival. Functionally, loss-of-function assays with in vitro and in vivo experiments revealed that KTN1-AS1 promoted the proliferation, migration, invasion and EMT progress of NSCLC cells, and suppressed apoptosis. Mechanistic studies indicated that miR-23b was a direct target of KTN1-AS1, which functioned as a ceRNA to subsequently facilitate miR-23b's target gene DEPDC1 expression in NSCLC cells. Rescue experiments confirmed that KTN1-AS1 overexpression could increase the colony formation and migration ability suppressed by miR-23b upregulation in NSCLC cells. Overall, our findings imply that STAT1-induced upregulation of KTN1-AS1 display tumor-promotive roles in NSCLC progression via regulating miR-23b/DEPDC1 axis, suggesting that KTN1-AS1 may be a novel biomarker and therapeutic target for NSCLC patients.

Keywords: DEPDC1; NSCLC; lncRNA KTN1-AS1; metastasis; miR-23b.


Conflict of interest statement

CONFLICTS OF INTEREST: All authors declare that they have no conflicts of interest.

Figures

Figure 1
Figure 1
KTN1-AS1 was up-regulated in NSCLC. (A) Heatmap of differentially express (DE) lncRNAs using TCGA data analysis. (B) Volcano plots show differentially expressed lncRNAs based on the TCGA datasets. (C) Venn diagram of altered lncRNAs in TCGA datasets and the data from Cancer RNA-seq Nexus program. (D) The heatmap of the 59 lncRNAs expression which was analyzed above based on the TCGA datasets. (E) Overall survivals of several lncRNAs for NSCLC patients were analyzed by “GEPIA”. (F) Relative expression of KTN1-AS1 using TCGA data analysis. (G) GO and KEGG analysis for the preliminary exploration of KTN1-AS1 function. (H) qPCR analyzed the expression of KTN1-AS1 in our cohort. (I) Relative KTN1-AS1 levels in six NSCLC cells and BEAS-2B cells. (J) Kaplan-Meier survival analysis of NSCLC patients’ overall survival based on KTN1-AS1 expression in our cohort (n = 127). * P < 0.05, **P < 0.01.
Figure 2
Figure 2
STAT1 stimulate KTN1-AS1 dysregulation in NSCLC. (A) Potential TFs were predicted by Jaspar and PROMO. The results of Jaspar and PROMO were intersected. (B) Expression of 16 TFs were analyzed by GEPIA using TCGA data. (C and D) qPCR detection for the determination of the association between overexpression of STAT1 and KTN1-AS1 expression. (E) The expressing correlation between KTN1-AS1 expression and FOXP3 and STAT1 expression was analyzed by GEPIA. (F) qPCR detected STAT1 expression in 127 NSCLC samples. (G) STAT1 expression across stages were analyzed by “UALCAN”. (H) KTN1-AS1 expression in A549 and H1299 cells after knockdown of STAT1 was determined by qRT-PCR. (I) Jaspar predicting potential binding sites between STAT1 and KTN1-AS1 promoter. (J) ChIP assay was performed to determine the affinity of STAT1 to KTN1-AS1 promoter. (K) Luciferase activity assays were applied to further confirm the binding of STAT1 to KTN1-AS1 promoter. * P < 0.05, **P < 0.01.
Figure 3
Figure 3
KTN1-AS1 affected cell proliferation and apoptosis. (A) qRT-PCR analysis of the expression of KTN1-AS1 in A549 and H1299 cell lines after si-KTN1-AS1. (B) The proliferation vitality detected using the CCK-8 assay. (C) EdU assays fro the determination of the cell proliferation ability of si-KTN1-AS1 transfected cells. (D) Colony formation assays for the functional exploration of knockdown of KTN1-AS1 on cellular growth. (E) The cells apoptosis was analyzed by flow cytometry. (F) The activities of caspase 3/9 were determined. * P < 0.05, **P < 0.01.
Figure 4
Figure 4
In vivo mice studies validated that KTN1-AS1 depletion suppressed tumor growth. (A) Relative expression of KTN1-AS1 in A549 and H1299 cells transfected with sh-KTN1-AS1 (sh-KTN1-AS1 #1 or sh-KTN1-AS1 #2) and scrambled shRNA. (B) The photographs and comparison of excised tumor sizes in A549 cells. (C) The tumor volume-time curves. (D) The tumor weights. * P < 0.05, **P < 0.01.
Figure 5
Figure 5
The migration and invasion of NSCLC cells were regulated by KTN1-AS1. (A) Cell migratory capabilities were assessed by wound healing assay after knocking down KTN1-AS1 in A549 and H1299 cells. (B, C) Cell invasive capabilities were examined by transwell assay after the knockdown of KTN1-AS1 A549 and H1299 cells. (D, E) western blot analyzed the protein levels of N-cadherin and vimentin. * P < 0.05, **P < 0.01.
Figure 6
Figure 6
miR-23b was directly targeted by KTN1-AS1. (A) The subcellular localization of KTN1-AS1 was predicted by lncATLAS and lncLocator. (B) Subcellular fractionation assays. (C) The ceRNA network of KTN1-AS1 was analyzed by lnCAR. (D) starBase program analyzed the expressing correlation between KTN1-AS1 and miRNAs. (E) qPCR analysis detected the expression of miR-23b and miR-23c. (F) The intersection of the results from miRDB, TargetScan, starBase and miRWalk prediction. The commonly predicting genes were also used fo GO and KEGG analysis. (G) The predicting binding site between KTN1-AS1 and miR-23b. (H) qPCR assessed the miR-23b levels in 127 NSCLC tissues. (I) Relative luciferase activity detection. (J) RNA-pull down. (K, L) qPCR analysis detected the levels of KTN1-AS1 and miR-23b, respectively. * P < 0.05, **P < 0.01.
Figure 7
Figure 7
MiR-23b directly targeted DEPDC1 in NSCLC cells. (A) Heatmap and volcano map of DEGs using TCGA data analysis. (B) Veen diagram. (C) Heatmap and volcano map of DEGs using GSE18842 and GSE33532 data analysis. (D) Intersection of 73 commonly expressed genes and up-regulated genes in GSE18842 and GSE33532. (E) Overall survivals were analyzed by GEPIA. (F) starBase program analyzed the expressing correlation between miR-23b and 6 genes. (G) Relative levels of DEPDC1 in TCGA data, GSE18842 and GSE33532. (H) qPCR evaluated the DEPDC1 levels in 127 NSCLC tissues. (I) The three binding sites between miR-23b and 3’UTR of DEPDC1 mRNA were predicted by starBase program. (J) Luciferase activity detection. (K) qPCR evaluated the DEPDC1 levels in A549 and H1299 cells after transfection with miR-23b mimics and inhibitors. * P < 0.05, **P < 0.01.
Figure 8
Figure 8
KTN1-AS1 modulated DEPDC1 expression via miR-23b in NSCLC. (A) starBase program analyzed the expressing correlation between miR-23b and KTN1-AS1, and DEPDC1. The expressing correlation between KTN1-AS1 and DEPDC1 was also analyzed by GEPIA. (B) qPCR evaluated the relative expression of KTN1-AS1 and DEPDC1 in A549 cells after transfection with miR-23b mimics and inhibitors. (C) qPCR examined the relative expression of DEPDC1 in NSCLC cells after their KTN1-AS1 was overexpressed or silenced. (D) Western blot determined the protein levels of DEPDC1 in A549 cells after various treatment. (E) CCK-8 assays determined the cellular growth. (F) Cell colony formation assays. (G) Wound-healing assays. * P < 0.05, **P < 0.01.

Similar articles

Cited by

References

    1. Siegel RL, Miller KD, Jemal A. Cancer statistics, 2018. CA Cancer J Clin. 2018; 68:7–30. 10.3322/caac.21442 - DOI - PubMed
    1. Herbst RS, Morgensztern D, Boshoff C. The biology and management of non-small cell lung cancer. Nature. 2018; 553:446–54. 10.1038/nature25183 - DOI - PubMed
    1. Zhang Y, Zhang M, Jiang Y, Li X, He Y, Zeng P, Guo Z, Chang Y, Luo H, Liu Y, Hao C, Wang H, Zhang G, Zhang L. Lentinan as an immunotherapeutic for treating lung cancer: a review of 12 years clinical studies in China. J Cancer Res Clin Oncol. 2018; 144:2177–86. 10.1007/s00432-018-2718-1 - DOI - PMC - PubMed
    1. Hirsch FR, Scagliotti GV, Mulshine JL, Kwon R, Curran WJ Jr, Wu YL, Paz-Ares L. Lung cancer: current therapies and new targeted treatments. Lancet. 2017; 389:299–311. 10.1016/S0140-6736(16)30958-8 - DOI - PubMed
    1. Rodriguez-Canales J, Parra-Cuentas E, Wistuba II. Diagnosis and Molecular Classification of Lung Cancer. Cancer Treat Res. 2016; 170:25–46. 10.1007/978-3-319-40389-2_2 - DOI - PubMed

MeSH terms