Comparative Study
. 2020 May 8;11(5):523.
doi: 10.3390/genes11050523.

Comparative Analysis of the Minimum Number of Replication Origins in Trypanosomatids and Yeasts

Affiliations
Comparative Study

Comparative Analysis of the Minimum Number of Replication Origins in Trypanosomatids and Yeasts

Marcelo S da Silva et al. Genes (Basel). .

Abstract

Single-celled eukaryote genomes predominantly replicate through multiple origins. Although origin usage during the S-phase has been elucidated in some of these organisms, few studies have comparatively approached this dynamic. Here, we developed a user-friendly website able to calculate the length of the cell cycle phases for any organism. Next, using a formula developed by our group, we showed a comparative analysis among the minimum number of replication origins (MO) required to duplicate an entire chromosome within the S-phase duration in trypanosomatids (Trypanosoma cruzi, Leishmania major, and Trypanosoma brucei) and yeasts (Saccharomyces cerevisiae and Schizosaccharomyces pombe). Using the data obtained by our analysis, it was possible to predict the MO required in a situation of replication stress. Also, our findings allow establishing a threshold for the number of origins, which serves as a parameter for genome approaches that map origins. Moreover, our data suggest that when compared to yeasts, trypanosomatids use much more origins than the minimum needed. This is the first time a comparative analysis of the minimum number of origins has been successfully applied. These data may provide new insight into the understanding of the replication mechanism and a new methodological framework for studying single-celled eukaryote genomes.

Keywords: DNA replication; S-phase duration; cell cycle phases; replication origins; trypanosomatids; trypanosomatids genome; yeasts.


Conflict of interest statement

The authors declare no conflict of interest.

Figures
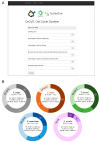
Figure 1
Figure 1
The user-friendly website CeCyD allows a quick estimation of the cell cycle phases duration for any cell type. (A) Screenshot of the CeCyD website showing the parameters to be inserted. This website is available at the address http://cecyd.vital.butantan.gov.br/. (B) Estimation of the cell cycle phases lengths (G1, S, and G2+M+C/G2+M) for T. cruzi, L. major, T. brucei, S. cerevisiae, and S. pombe. For T. cruzi, L. major, and T. brucei from calculations made using the CeCyD website. For S. cerevisiae and S. pombe, the values were obtained from other studies [25,26,34,35].
Figure 2
Figure 2
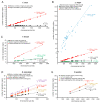
Comparative analysis among different approaches used to estimate replication origins in trypanosomatids (T. cruzi, L. major, T. brucei) and yeasts (S. cerevisiae and S. pombe) (a–e). Graphs showing positive correlations between chromosome length and the number of replication origins estimated by different approaches: minimum number of origins—MO (black), origins estimated by DNA combing (red), origins estimated by MFA-seq (green), potential origins mapped by SNS-seq (blue), origins estimated by microarray (yellow), known origins (purple), and A+T rich islands (gray). (A) T. cruzi, (B) L. major, (C) T. brucei, (D) S. cerevisiae, and (E) S. pombe. The trend lines for all approaches, as well as the equations, are shown. Studies are referenced in each graph.
Figure 3
Figure 3
Trypanosomatids use around fivefold more origins than the minimum required. Angular coefficient (a-value) ratios between origins estimated by DNA combing and the minimum origins (MO) for T. cruzi (gray bar), L. major (orange bar), T. brucei (green bar), S. cerevisiae (blue bar), and S. pombe (purple bar).

References

    1. Leonard A.C., Méchali M. DNA replication origins. Cold Spring Harb. Perspect. Biol. 2013;5:a010116. doi: 10.1101/cshperspect.a010116. - DOI - PMC - PubMed
    1. Myllykallio H., Lopez P., López-García P., Heilig R., Saurin W., Zivanovic Y., Philippe H., Forterre P. Bacterial mode of replication with eukaryotic-like machinery in a hyperthermophilic archaeon. Science. 2000;288:2212–2215. doi: 10.1126/science.288.5474.2212. - DOI - PubMed
    1. Stanojcic S., Sollelis L., Kuk N., Crobu L., Balard Y., Schwob E., Bastien P., Pagès M., Sterkers Y. Single-molecule analysis of DNA replication reveals novel features in the divergent eukaryotes Leishmania and Trypanosoma brucei versus mammalian cells. Sci. Rep. 2016;6:23142. doi: 10.1038/srep23142. - DOI - PMC - PubMed
    1. Turrero García M., Chang Y., Arai Y., Huttner W.B. S-phase duration is the main target of cell cycle regulation in neural progenitors of developing ferret neocortex. J. Comp. Neurol. 2016;524:456–470. doi: 10.1002/cne.23801. - DOI - PMC - PubMed
    1. Günesdogan U., Jäckle H., Herzig A. Histone supply regulates S phase timing and cell cycle progression. Elife. 2014;3:e02443. doi: 10.7554/eLife.02443. - DOI - PMC - PubMed

Publication types

MeSH terms

LinkOut - more resources