. 2020 May 9;25(9):2232.
doi: 10.3390/molecules25092232.

Modulation of Lipoteichoic Acids and Exopolysaccharides Prevents Streptococcus mutans Biofilm Accumulation

Affiliations

Modulation of Lipoteichoic Acids and Exopolysaccharides Prevents Streptococcus mutans Biofilm Accumulation

Midian C Castillo Pedraza et al. Molecules. .

Abstract

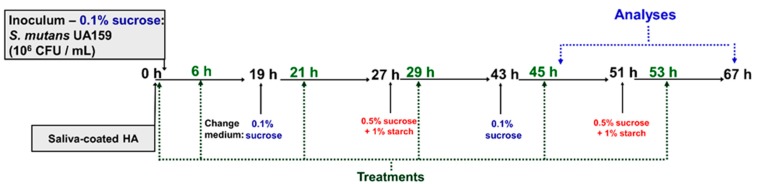
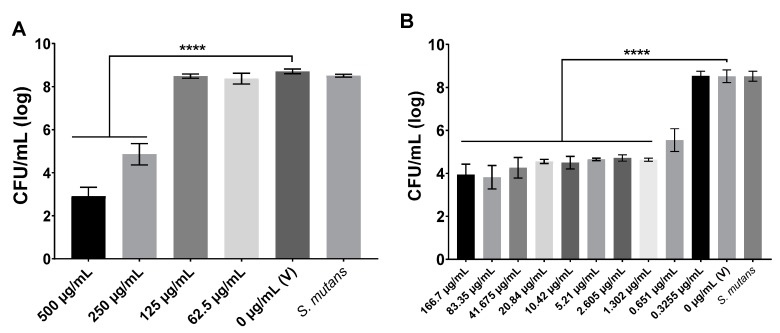
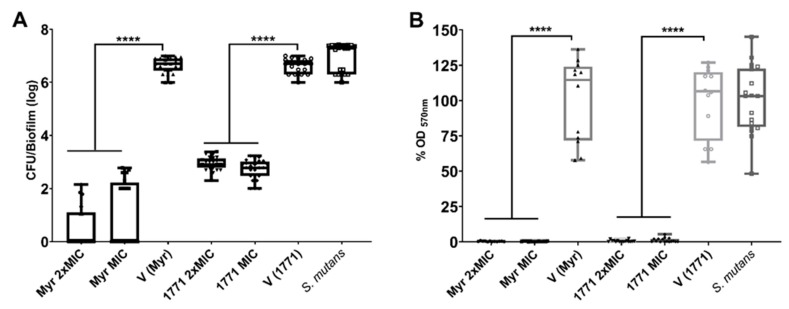
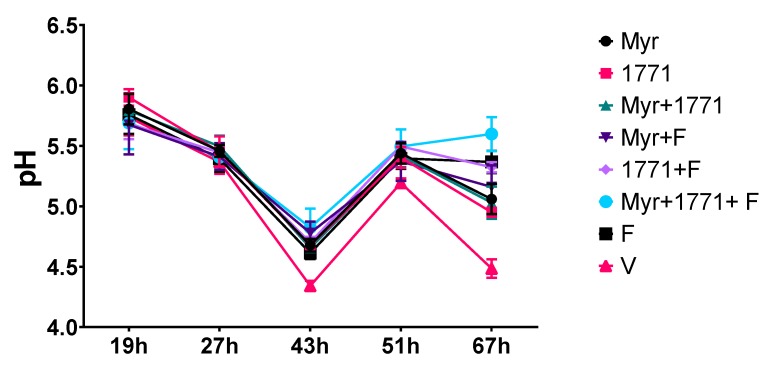
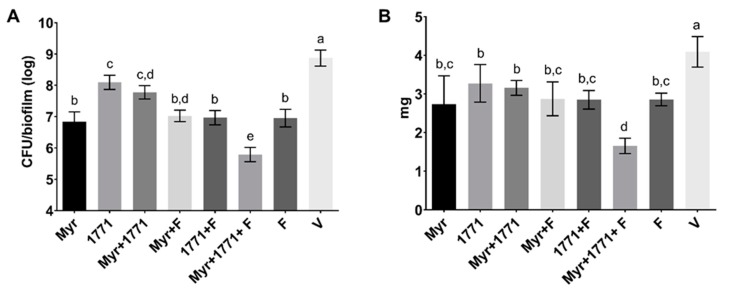
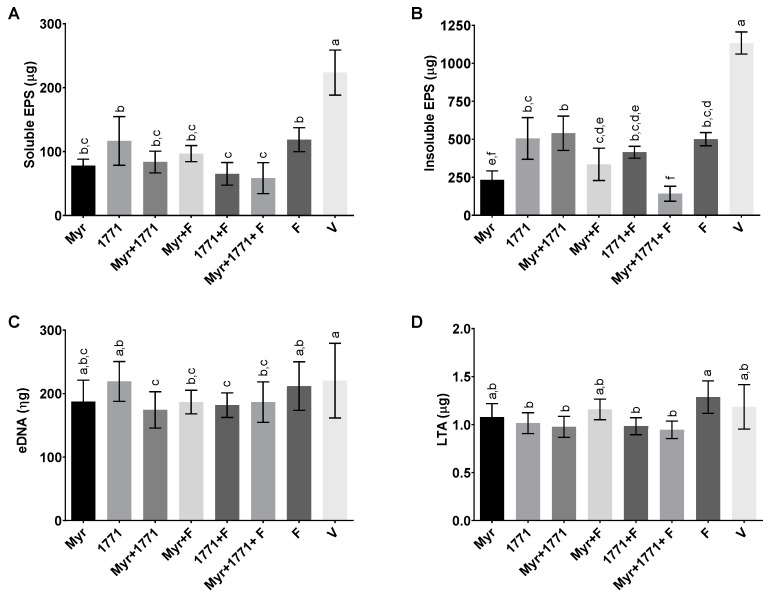
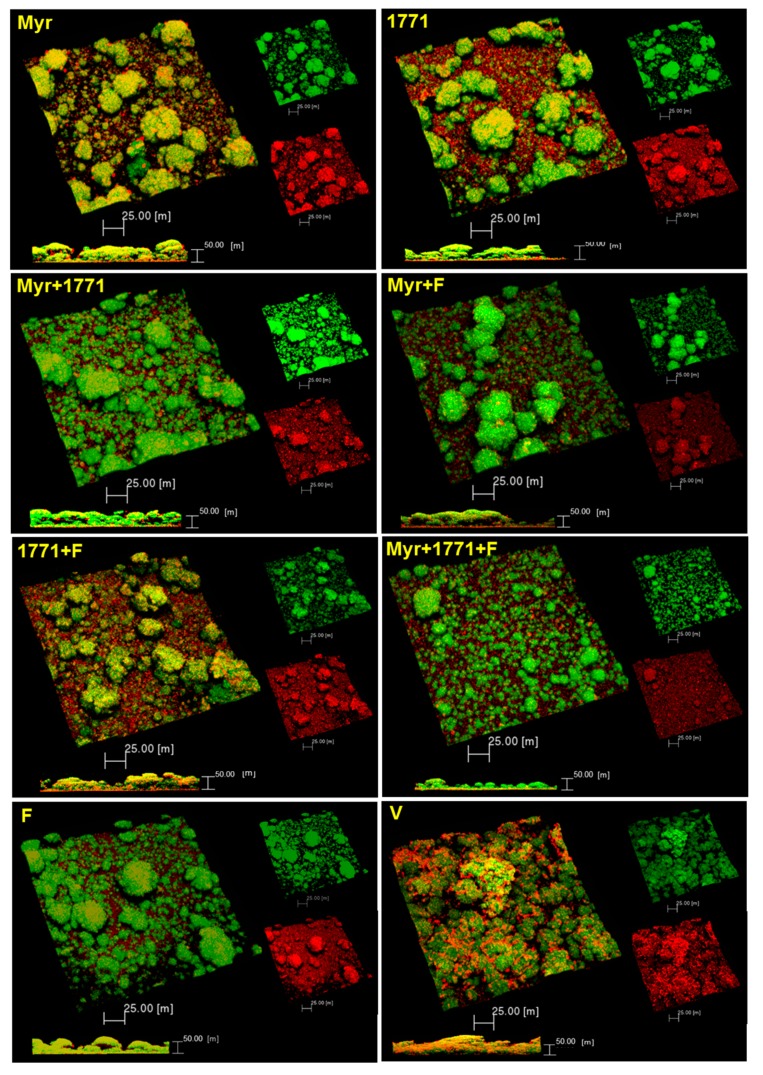
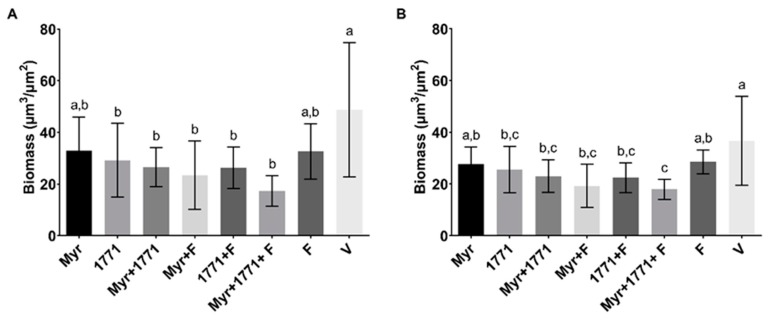
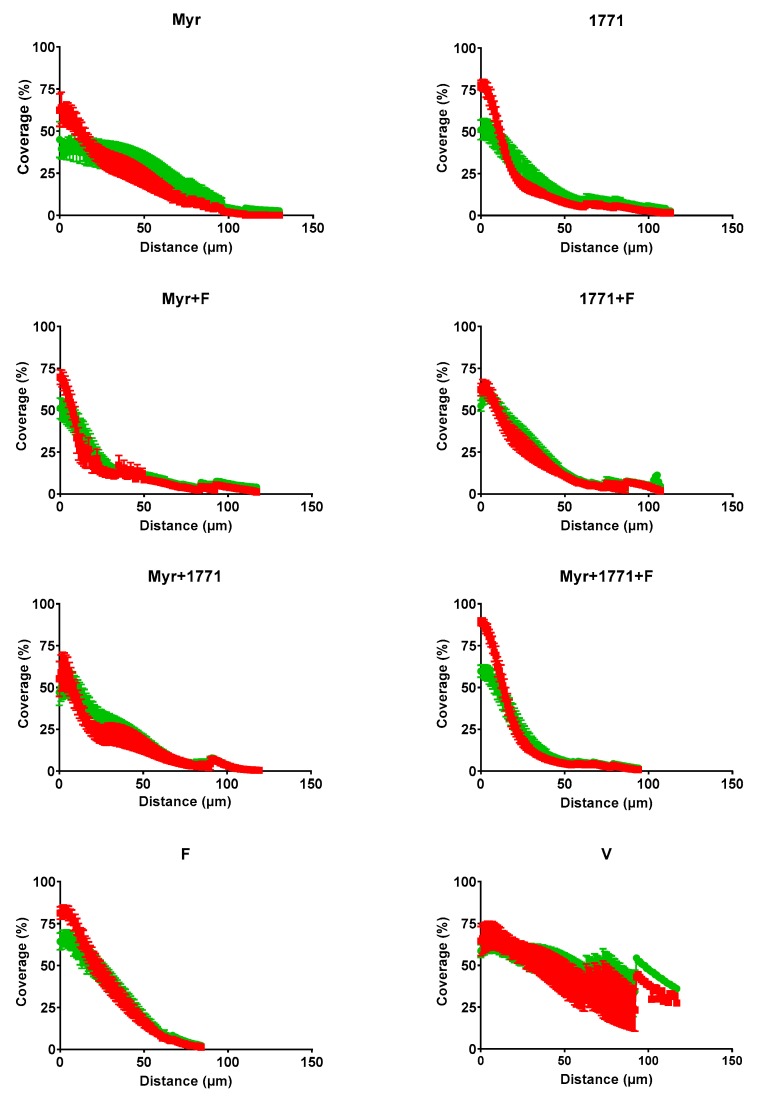
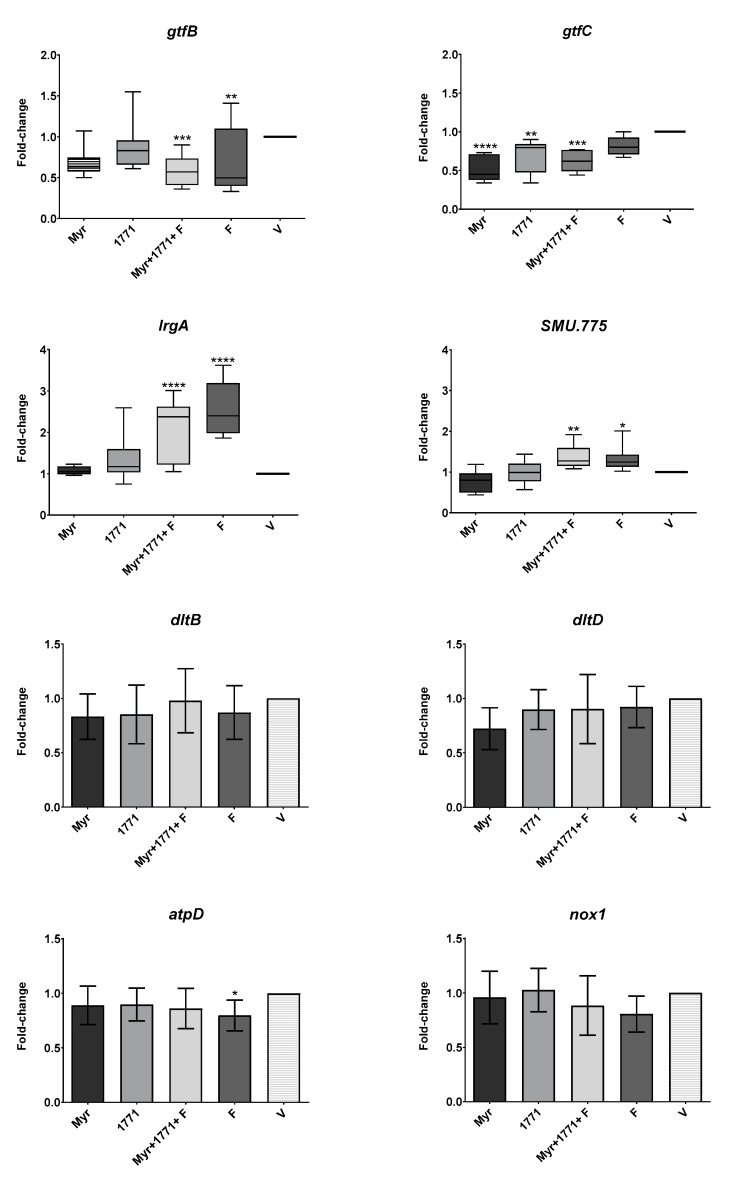
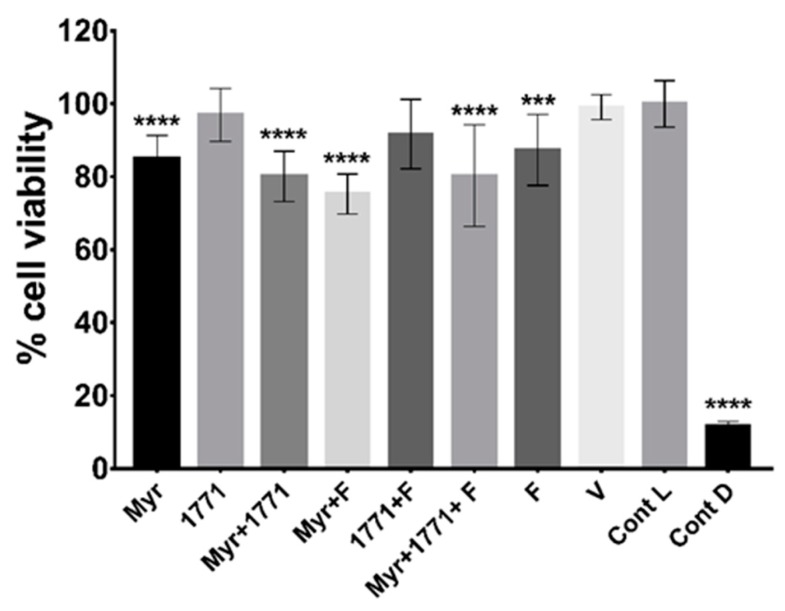
Dental caries is a diet-biofilm-dependent disease. Streptococcus mutans contributes to cariogenic biofilms by producing an extracellular matrix rich in exopolysaccharides and acids. The study aimed to determine the effect of topical treatments with compound 1771 (modulates lipoteichoic acid (LTA) metabolism) and myricetin (affects the synthesis of exopolysaccharides) on S. mutans biofilms. In vitro S. mutans UA159 biofilms were grown on saliva-coated hydroxyapatite discs, alternating 0.1% sucrose and 0.5% sucrose plus 1% starch. Twice-daily topical treatments were performed with both agents alone and combined with and without fluoride: compound 1771 (2.6 µg/mL), myricetin (500 µg/mL), 1771 + myricetin, fluoride (250 ppm), 1771 + fluoride, myricetin + fluoride, 1771 + myricetin + fluoride, and vehicle. Biofilms were evaluated via microbiological, biochemical, imaging, and gene expression methods. Compound 1771 alone yielded less viable counts, biomass, exopolysaccharides, and extracellular LTA. Moreover, the combination 1771 + myricetin + fluoride decreased three logs of bacterium counts, 60% biomass, >74% exopolysaccharides, and 20% LTA. The effect of treatments on extracellular DNA was not pronounced. The combination strategy affected the size of microcolonies and exopolysaccharides distribution and inhibited the expression of genes linked to insoluble exopolysaccharides synthesis. Therefore, compound 1771 prevented the accumulation of S. mutans biofilm; however, the effect was more pronounced when it was associated with fluoride and myricetin.

Keywords: Streptococcus mutans; biofilm; compound 1771; exopolysaccharides; lipoteichoic acids; myricetin.


Conflict of interest statement

The authors declare that the research was conducted in the absence of any commercial or financial relationships that could be construed as a potential conflict of interest.

Figures

Figure 1
Figure 1
Experimental design for twice-daily topical treatments using a saliva-coated hydroxyapatite biofilm model. The treatments were performed at 0 (pellicle, before starting incubation with S. mutans), 6, 21, 29, 45, and 53 h of biofilm development. The biofilms were analyzed at 46 and 67 h. The pH of the spent medium was evaluated at 19, 27, 43, 46, 51, and 67 h.
Figure 2
Figure 2
Antimicrobial activity of myricetin (A) and compound 1771 (B). The S. mutans viable population data are shown as average, and error bars correspond to the standard deviation (n = 12). V: Vehicle; for myricetin, the vehicle was 7% ethanol in 1xPBS (pH 7.2); while for compound 1771, it was 7% ethanol and 1.25% dimethyl sulfoxide (DMSO). S. mutans: growth control culture. **** denotes a statistically significant difference between the vehicle and the concentrations tested (p < 0.0001; one-way ANOVA test, followed by Dunnett’s multiple comparisons test).
Figure 3
Figure 3
Antibiofilm activity of myricetin and compound 1771 tested at concentrations of minimum inhibitory concentration (MIC) and 2xMIC using the polystyrene microplate model. The S. mutans viable population (A) and biomass (B) data are shown as the median and interquartile range (n = 12). The two concentrations of the two agents were able to inhibit both viable population and biomass. The vehicle for each agent is shown separately because the experiments were not performed at the same time. S. mutans: growth control group. **** denotes the statistical difference between treatments and V (p < 0.0001; Kruskal–Wallis test, followed by Dunn’s post-test). Myr: myricetin. 1771: compound 1771. V: vehicle used for each compound.
Figure 4
Figure 4
pH of spent culture media from topically treated biofilms at distinct developmental phases. The spent biofilm culture media were evaluated at 19, 27, 43, 51, and 67 h. At 19 h, the culture medium of biofilms treated with compound 1771 showed a higher pH value when compared to Myr + F (p = 0.0009), 1771 + F (p = 0.0017), Myr + 1771 + F (p = 0.0027), and V (p = 0.0466) (one-way ANOVA, followed by Tukey’s test). At 27 h, there was no significant difference between treatments. The culture medium from vehicle-treated biofilms showed lower pH at 43, 51, and 67 h compared to all treatments (p ˂ 0.0001; one-way ANOVA, followed by Tukey’s test). The medium from Myr + 1771 + F had the highest pH value when compared to Myr + 1771 and F at 43 h, and at presented the highest pH value at 67 h (p < 0.05, one-way ANOVA, followed by Tukey’s test). The data represented are the means, and the error bars correspond to the standard deviation.
Figure 5
Figure 5
S. mutans viable counts (A) and insoluble biomass (dry-weight) (B) of topically treated biofilms. At 67 h, the vehicle yielded the highest values of CFU/biofilm and biomass, while the lowest values were found for the combination of Myr + 1771 + F. Bars with the same letters indicate no statistical difference between the different treatments in each graph (p > 0.05; one-way ANOVA, followed by Tukey’s test). The data represented are the means, and the error bars correspond to the standard deviation.
Figure 6
Figure 6
Modulation of the extracellular matrix components in the topically treated biofilms. The graphs exhibit the content of water-soluble exopolysaccharides (EPS) (A), water-insoluble EPS (B), eDNA (C), and lipoteichoic acids (LTA) (D) in the extracellular matrix. Bars with the same letters indicate no statistical difference between the different treatments in each graph (p > 0.05; one-way ANOVA, followed by Tukey’s test). The data represented are the means, and the error bars correspond to the standard deviation.
Figure 7
Figure 7
3D architecture of the topically treated S. mutans biofilm. Representative images of 67 h-old biofilms are displayed in this image. The red color represents exopolysaccharides produced by S. mutans (Alexa Fluor 647) and the green color S. mutans cells (SYTO 9). The larger image in each set represents the overlapping images of the red and green channels, which are shown separately in a smaller size (scale bars of 25 μm). The bottom images are a cross-section of the biofilm with overlapping images of both channels (scale bars of 50 μm).
Figure 8
Figure 8
Biovolume of bacteria and EPS in topically treated biofilms. Biovolume is represented as biomass (μm3/μm2) of bacteria (A) and EPS (B). Bars with the same letters indicate no statistical difference between the different treatments in each graph (p > 0.05; one-way ANOVA, followed by Tukey’s test). The data represented are the means, and the error bars correspond to the standard deviation.
Figure 9
Figure 9
Profile of the distribution of bacteria (in green) and EPS (in red) in each of the topically treated biofilms. The data shown are the mean and standard error percentage coverage per area from the interface substratum/biofilm (hydroxyapatite disc) to the top (outer layer) of each biofilm at 67 h (n = 12 images per biofilm).
Figure 10
Figure 10
Gene expression profile of S. mutans biofilms after topical treatments. The fold-change is relative to vehicle-treated biofilms. Data presented are median and interquartile range are shown for genes gtfB, gtfC, IrgA, and SMU.775 (box plot graphs, Kruskal–Wallis test, followed by Dunn post-test), while mean and standard deviation for genes dltB, dltD, atpD, and nox1 (bar graphs; one-way ANOVA, followed by Tukey’s test). The asterisks depict significant statistical differences of treatments versus the vehicle, where * p ≤ 0.05, ** p ≤ 0.01, *** p ≤ 0.001, and **** p ≤ 0.0001. The data were obtained from three experiments (with two cDNA per experiment), and the quantification of qPCR expression was performed in duplicate.
Figure 11
Figure 11
Cell viability of keratinocytes NOK-si after exposure to treatments. The data represented are the means, and the error bars correspond to the standard deviation “Cont L” indicates cell viability control and “Cont D”, the cell death control. The percentage of cell viability was obtained considering the cell viability control as 100%. The asterisks denote a statistically significant difference of a specific extract versus cell viability control (Cont L), where **** p < 0.0001 and *** p = 0.0005 (one-way ANOVA, followed by Tukey’s test).

Similar articles

Cited by

References

    1. Kassebaum N.J., Smith A.G.C., Bernabé E., Fleming T.D., Reynolds A.E., Vos T., Marcenes W. GBD 2015 Oral Health Collaborators. Global, Regional, and National Prevalence, Incidence, and Disability-Adjusted Life Years for Oral Conditions for 195 Countries, 1990–2015: A Systematic Analysis for the Global Burden of Diseases, Injuries, and Risk Factors. J. Dent. Res. 2017;96:380–387. doi: 10.1177/0022034517693566. - DOI - PMC - PubMed
    1. Selwitz R.H., Ismail A.I., Pitts N.B. Dental caries. Lancet. 2007;369:51–59. doi: 10.1016/S0140-6736(07)60031-2. - DOI - PubMed
    1. Marsh P.D. Microbial ecology of dental plaque and its significance in health and disease. Adv. Dent. Res. 1994;8:263–271. doi: 10.1177/08959374940080022001. - DOI - PubMed
    1. Paes Leme A.F., Koo H., Bellato C.M., Bedi G., Cury J.A. The role of sucrose in cariogenic dental biofilm formation—New insight. J. Dent. Res. 2006;85:878–887. doi: 10.1177/154405910608501002. - DOI - PMC - PubMed
    1. Tanner A.C.R., Kressirer C.A., Rothmiller S., Johansson I., Chalmers N.I. The Caries Microbiome: Implications for Reversing Dysbiosis. Adv. Dent. Res. 2018;29:78–85. doi: 10.1177/0022034517736496. - DOI - PubMed

MeSH terms

LinkOut - more resources