. 2020 May 12;12(1):67.
doi: 10.1186/s13148-020-00855-z.

Hypermethylation and decreased expression of TMEM240 are potential early-onset biomarkers for colorectal cancer detection, poor prognosis, and early recurrence prediction

Affiliations

Hypermethylation and decreased expression of TMEM240 are potential early-onset biomarkers for colorectal cancer detection, poor prognosis, and early recurrence prediction

Shih-Ching Chang et al. Clin Epigenetics. .

Abstract

Background: Gene silencing by aberrant DNA methylation of promoter regions remains the most dominant phenomenon occurring during tumorigenesis. Improving the early diagnosis, prognosis, and recurrence prediction of colorectal cancer using noninvasive aberrant DNA methylation biomarkers has encouraging potential. The aim of this study is to characterize the DNA methylation of the promoter region of TMEM240, as well as gene expression and its effect on cell biological functions and its applications in early detection and outcome prediction.

Results: Highly methylated CpG sites were identified in the TMEM240 gene by Illumina methylation 450K arrays in 26 Taiwanese patient paired samples and 38 paired samples from The Cancer Genome Atlas (TCGA) colorectal cancer dataset. Transient transfection and knockdown of TMEM240 were performed to demonstrate the role of TMEM240 in colorectal cancer cells. The data showed that TMEM240 could lead to G1 cell cycle arrest, repress cancer cell proliferation, and inhibit cancer cell migration. The quantitative methylation-specific real-time polymerase chain reaction (PCR) results revealed that 87.8% (480 of 547) of the colorectal cancer tumors had hypermethylated TMEM240, and this was also found in benign tubular adenomas (55.6%). Circulating cell-free methylated TMEM240 was detected in 13 of 25 (52.0%) Taiwanese colorectal cancer patients but in fewer (28.6%) healthy controls. In 72.0% (85/118) of tissue samples, TMEM240 mRNA expression was lower in Taiwanese CRC tumor tissues than in normal colorectal tissues according to real-time reverse transcription PCR results, and this was also found in benign tubular adenomas (44.4%). The TMEM240 protein was analyzed in South Korean and Chinese CRC patient samples using immunohistochemistry. The results exhibited low protein expression in 91.7% (100/109) of tumors and 75.0% (24/32) of metastatic tumors but exhibited high expression in 75.0% (6/8) of normal colon tissues. Multivariate Cox proportional hazards regression analysis found that mRNA expression of TMEM240 was significantly associated with overall, cancer-specific, and recurrence-free survival (p = 0.012, 0.007, and 0.022, respectively).

Conclusions: Alterations in TMEM240 are commonly found in Western and Asian populations and can potentially be used for early prediction and as poor prognosis and early-recurrence biomarkers in colorectal cancer.

Keywords: Circulating cell-free DNA; DNA methylation; Early detection; Early onset; Prognostic marker; TMEM240; ccfDNA; cmDNA.


Conflict of interest statement

There are no conflicts of interest.

Figures

Fig. 1
Fig. 1
Flowchart of gene selection and analytical procedures. a The criteria and step-by-step flowchart for gene selection. b Screening of intersecting genes by InteractiVenn
Fig. 2
Fig. 2
TMEM240 may repress cell growth, migration, and cell cycle arrest in colon cancer cells. a A recombinant pMyc-DDK-hTMEM240 plasmid was transfected into DLD-1 cells for 24 h, and then the cells were analyzed via real-time RT-PCR for mRNA and Western blotting for protein (left). The cell proliferation rate was analyzed by sulforhodamine B (SRB) assay (middle). A bright view was taken to illustrate the cell morphology (right) (original magnification, × 100). b si-TMEM240 was transfected into DLD-1 cells. The mRNA expression (up), cell proliferation rate (down), and cell morphology (right) of DLD-1 cells were analyzed (original magnification, × 100). c The mRNA expression (up), cell morphology (right), and cell proliferation rate (down) in HCT116 colon cancer cells were analyzed (original magnification, × 40). d The migratory ability was measured by a transwell assay after TMEM240 overexpression in DLD-1 cells. e A TMEM240 and/or si-TMEM240 plasmid was transfected into DLD-1 cells for 24 h, and then the cell cycle distribution was analyzed by flow cytometry. Data are presented as the mean ± SD, *p ≤ 0.05, **p ≤ 0.01, ***p ≤ 0.001. A t test was used to calculate group differences in all experiments. Experiments were performed with at least two biological duplicates and three technical replicates
Fig. 3
Fig. 3
Methylation levels in Taiwanese colorectal carcinoma (CRC) patients. a Differentially methylated CpG heatmap of TMEM240 in 26 paired CRC patients. Methylation levels (average β values) at differentially methylated loci were identified using an Illumina Methylation 450K array-based assay. The highly differentially methylated sites cg15487867, cg16601494, cg16306898, and cg22497741 are array probes 6, 7, 8, and 9, respectively. The genomic positions of the QMSP amplicon are located in exon 1 (from + 171 to + 347) of the TMEM240 gene (array probes 7 and 8). b The box plot of TMEM240 methylation levels in tissues. c Representative figures of TMEM240 methylation levels determined by QMSP in 10 adjacent normal colon tissues, nine polyps of tubular adenoma, and 10 CRC tumors. Experiments were performed with three technical replicates. d The box plot of TMEM240 methylation levels in plasma. e Representative figures of the circulating methylated TMEM240 levels determined by QMSP in 10 healthy subjects and 10 CRC patients. *p ≤ 0.05, ***p ≤ 0.001. A t test was used to calculate group differences
Fig. 4
Fig. 4
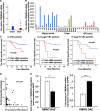
TMEM240 mRNA expression levels are affected by DNA methylation and are associated with cancer-specific survival. a The box plot of TMEM240 mRNA expression levels in tissues. b Representative figure of the TMEM240 mRNA expression level determined by RT-qPCR in 10 adjacent normal colon tissues, nine polyps of tubular adenomas, and 10 colorectal carcinoma (CRC) tumors. c Kaplan-Meier survival curves were used to compare cancer-specific survival between CRC patients with low and those with high TMEM240 mRNA expression. TMEM240 was considered to have low expression when the expression level in CRC tumors was 5-fold lower than that in normal tissues. d Scatterplot of the fold change of TMEM240 DNA methylation and mRNA expression levels in CRC tumors normalized to the adjacent normal tissues. e DNA methylation and mRNA expression were measured after treatment with decitabine (DAC). Fold changes in DNA methylation after treatment with DAC (left panel). Fold changes in TMEM240 mRNA expression after treatment with DAC (right panel). Data are presented as the mean ± SD, **p ≤ 0.01, ***p ≤ 0.001. A t test was used to calculate group differences in all experiments. Experiments were performed with at least two biological duplicates and three technical replicates
Fig. 5
Fig. 5
Representative figures for TMEM240 protein expression as analyzed by IHC. a Normal colon mucosa. b Hyperplastic polyp. c Benign colon tumor. d Colon cancer tissue with negative expression. e Colon cancer tissue with low expression. f Metastatic colon cancer tissue (original magnification, × 200). Scale bars indicate 200 μm
Fig. 6
Fig. 6
TMEM240 DNA methylation and mRNA analysis from the TCGA dataset. Differentially methylated CpG sites in TMEM240 were identified in a 38 adjacent normal colorectal tissues, 38 matched colorectal carcinoma (CRC) tumors, and b 314 CRC tumors by an Illumina Methylation 450K array-based assay. c RNA sequencing data for TMEM240 in 41 adjacent normal colorectal tissues and 41 matched CRC tumors
Fig. 7
Fig. 7
Flowchart of the study design, datasets, and specimens used. For each step, the sample types and number of samples used for the analyses are indicated. CRC, colorectal cancer; AN, adjacent normal; AD, benign adenoma; inflam, inflammation; normal, normal tissues; ccfDNA, circulating cell-free DNA; QMSP, quantitative methylation-specific PCR; qRT-PCR, quantitative reverse-transcription PCR; IHC, immunohistochemistry; methylation450K array, Illumina Infinium HumanMethylation450 BeadChip array; OS, overall survival; CS, cancer-specific survival; RFS, recurrence-free survival; SRB, sulforhodamine B assay; PI, propidium iodide staining

Similar articles

Cited by

References

    1. Siegel RL, Miller KD, Jemal A. Cancer statistics, 2018. CA Cancer J Clin. 2018;68:7–30. doi: 10.3322/caac.21442. - DOI - PubMed
    1. Taiwan Ministry of Health and Welfare. 2018 Taiwan health and welfare report. 2019.
    1. Ferlay J, Soerjomataram I, Ervik M, Dikshit R, Eser S, Mathers C, Rebelo M, Parkin D, Forman D, Bray F. GLOBOCAN 2012 v1.0, Cancer incidence and mortality worldwide: IARC CancerBase No. 11 [Internet]. Lyon, France: International Agency for Research on Cancer; 2013. Available from: http://globocan.iarc.fr, accessed on 13/12/2013.
    1. Simon K. Colorectal cancer development and advances in screening. Clin Interv Aging. 2016;11:967–976. doi: 10.2147/CIA.S109285. - DOI - PMC - PubMed
    1. Sameer AS, Nissar S. Epigenetics in diagnosis of colorectal cancer. Molecular biology research communications. 2016;5:49–57. - PMC - PubMed

Publication types

MeSH terms

LinkOut - more resources