. 2020 May 12;8(1):66.
doi: 10.1186/s40478-020-00938-1.

Persistent elevation of intrathecal pro-inflammatory cytokines leads to multiple sclerosis-like cortical demyelination and neurodegeneration

Affiliations

Persistent elevation of intrathecal pro-inflammatory cytokines leads to multiple sclerosis-like cortical demyelination and neurodegeneration

Rachel E James et al. Acta Neuropathol Commun. .

Abstract

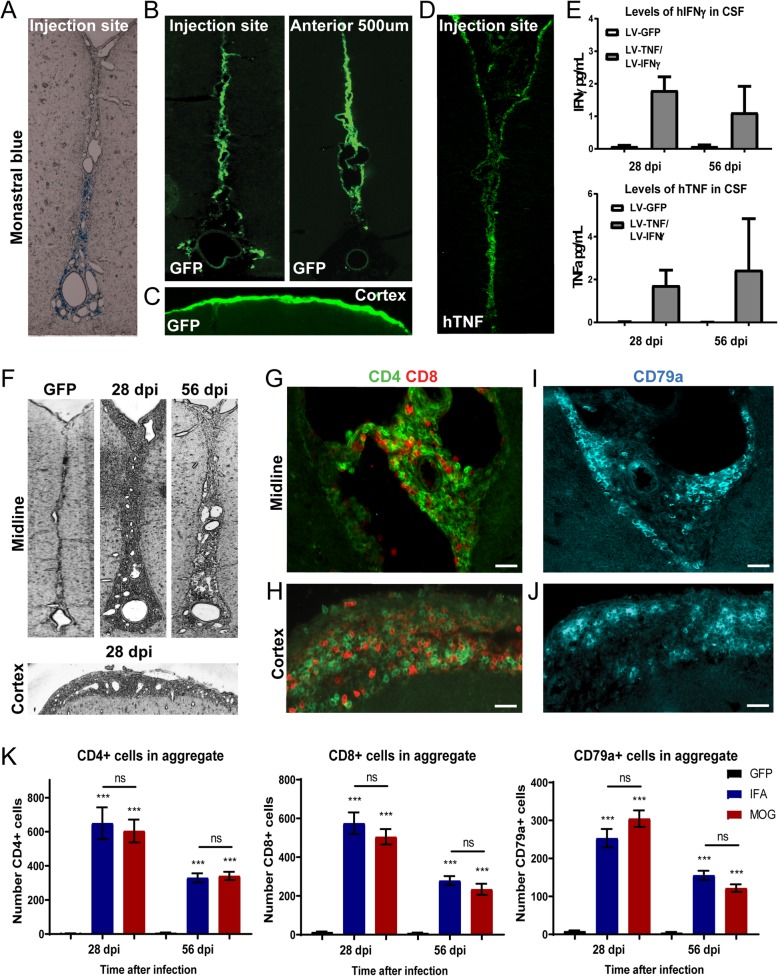
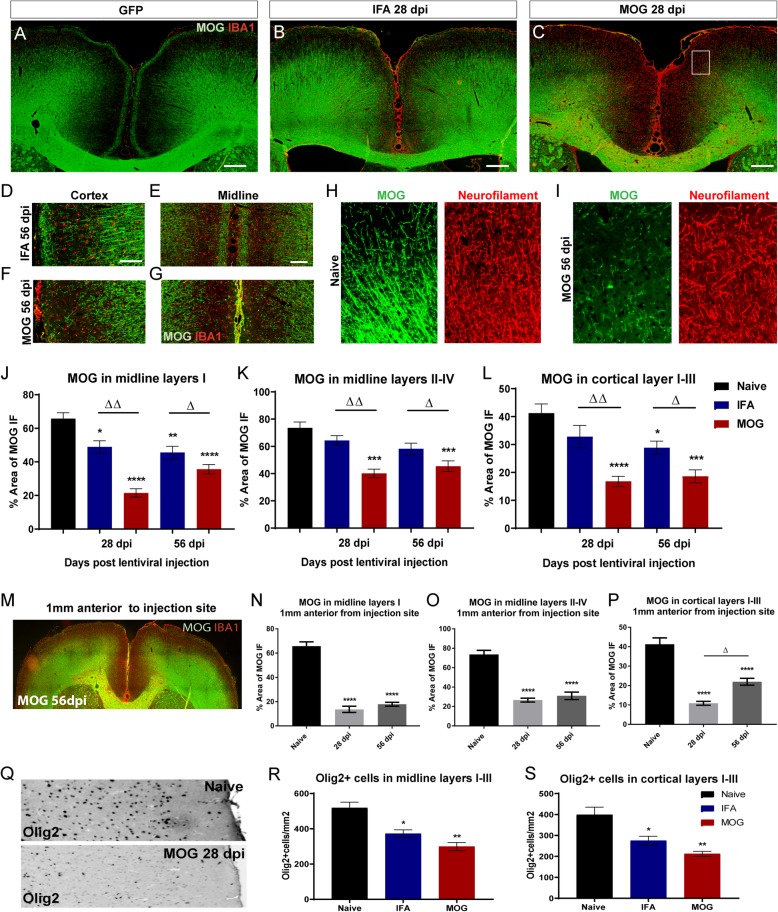
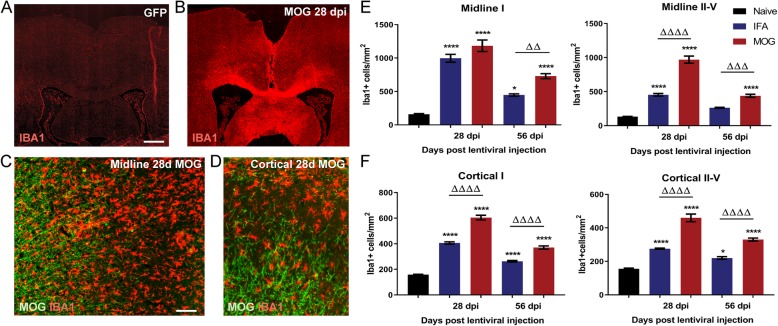
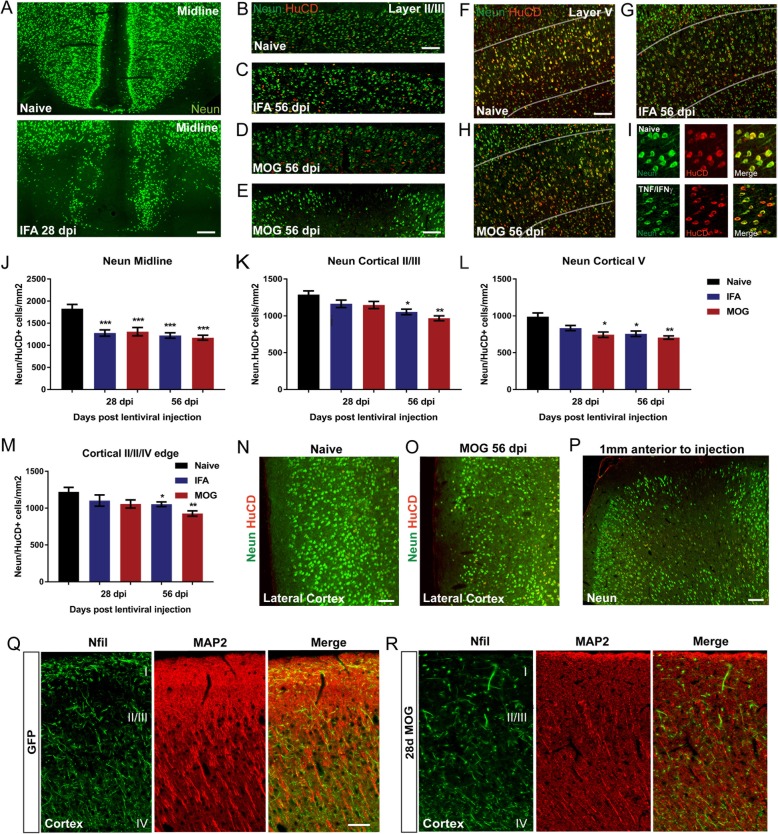
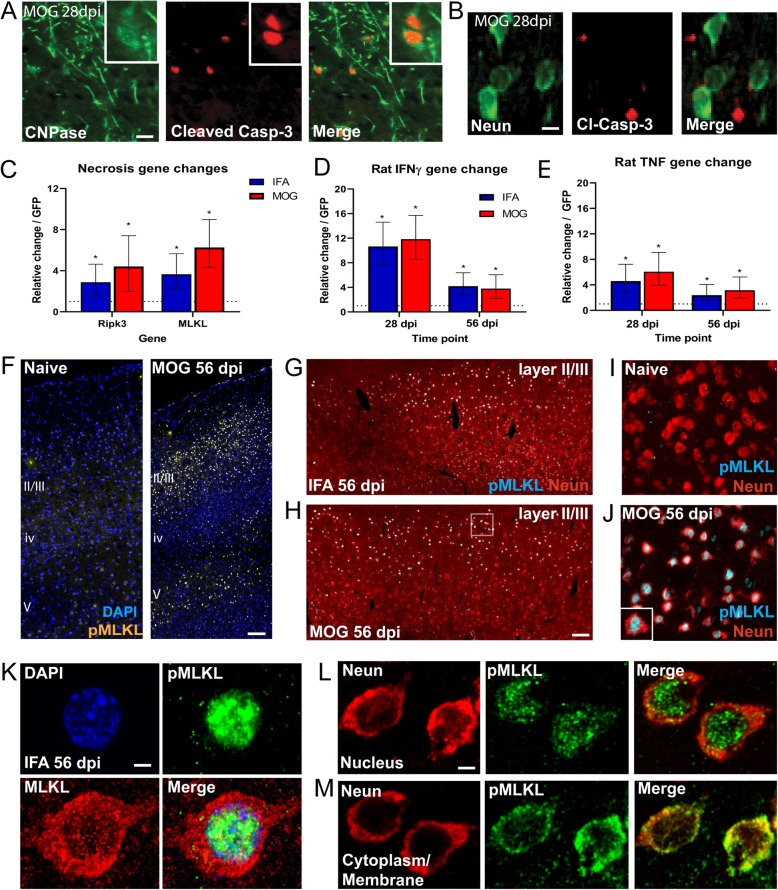
Analysis of isolated meninges and cerebrospinal fluid (CSF) of post-mortem MS cases has shown increased gene and protein expression for the pro-inflammatory cytokines: tumour necrosis factor (TNF) and interferon-γ (IFNγ). Here we tested the hypothesis that persistent production of these cytokines in the meningeal compartment and diffusion into underlying GM can drive chronic MS-like GM pathology. Lentiviral transfer vectors were injected into the sagittal sulcus of DA rats to deliver continuous expression of TNF + IFNγ transgenes in the meninges and the resulting neuropathology analysed after 1 and 2 months. Injection of TNF + IFNγ viral vectors, with or without prior MOG immunisation, induced extensive immune cell infiltration (CD4+ and CD8+ T-cells, CD79a + B-cells and macrophages) in the meninges by 28 dpi, which remained at 2 months. Control GFP viral vector did not induce infiltration. Subpial demyelination was seen underlying these infiltrates, which was partly dependant on prior myelin oligodendrocyte glycoprotein (MOG) immunisation. A significant decrease in neuronal numbers was seen at 28 and 56 days in cortical layers II-V that was independent of MOG immunisation. RNA analysis at 28 dpi showed an increase in expression of necroptotic pathway genes, including RIP3, MLKL, cIAP2 and Nox2. PhosphoRIP3+ and phosphoMLKL+ neurons were present in TNF + IFNγ vector injected animals, indicating activation of necroptosis. Our results suggest that persistent expression of TNF in the presence of IFNγ is a potent inducer of meningeal inflammation and can activate TNF signalling pathways in cortical cells leading to neuronal death and subpial demyelination and thus may contribute to clinical progression in MS.

Keywords: Animal model; Demyelination; Inflammation; Meninges; Multiple sclerosis; Neurodegeneration.


Conflict of interest statement

All the authors declare they have no competing interests.

Figures

Fig. 1
Fig. 1
Injection of cytokine expressing vectors into the subarachnoid space of rats leads to meningeal inflammation. Lentiviral vectors (LV) expressing TNF and IFNγ were injected into the subarachnoid space where the dye monastral blue was used to identify the correct positioning and location of the injection site (a). Use of a LV expressing eGFP showed significant transduction of meningeal cells lining the cortex down the midline (b), spreading to at least 500 μm anterior to the injection site (b) and along the cortical surface (c). Immunostaining for human TNF showed that expression of the human TNF transgene occurred in cells along the length of the midline (d). Significant levels of human transgene derived TNF and IFNγ were detectable in CSF from cytokine LV but not from GFP LV injected animals at both 28 and 56 days post-injection (e). Low magnification brightfield images of MOG immunised animals showed that injection of vectors for TNF and IFNγ led to the formation of large dense infiltrates of cells within the sagittal sulcus and across the surface of the cortex at 28 days post-injection, which were still present at 56 days (f), whereas the control GFP vector did not induce inflammation. Immunofluorescent staining showed the extensive infiltration of CD4+ and CD8+ T cells in the meninges within the sagittal sulcus and overlying the cortex of cytokine vector injected MOG animals (g,h). CD79a + B-cell aggregates in serial sections of the same area appeared to form more discrete clusters (i,j). The maximal infiltration of T- and B-cells into the sagittal sulcus was seen 28 days after injection for both IFA and MOG immunised animals and decreased by approximately 50% by 56 days (k), with no significant difference between animals immunised with MOG or IFA (1-way analysis of variance with Tukey correction, *** P < 0.001 compared to GFP). CD4+ and CD8+ T cell numbers were approximately equal and twice that of B-cells. Data represents mean ± SEM from n = 5–6 per group. Scale bars = 20 μm
Fig. 2
Fig. 2
Chronic expression of cytokines leads to demyelination of subpial cortical layers. Immunofluorescence for MOG and IBA1 shows no demyelination in eGFP vector injected animals (a), but widespread demyelination in the outer cortical layers at 28 days after cytokine lentiviral injection in IFA (b) and MOG (c) immunised animals. A decrease of MOG staining can be seen in IFA animals in the cortical (d) and midline layers (e), which was greater at 56 days in MOG immunised animals (f-g). Areas with loss of MOG at 56 dpi (white box in C) showed similar levels of 200 kd neurofilament protein when compared to naive (h-i). The degree of demyelination was significantly different for both IFA and MOG immunised animals at 28 and 56 days in midline layer I (j), but only in MOG immunised animals in midline layer II-IV, compared to naïve (k)(1-way analysis of variance with Tukey post test, *P < 0.05, ***P < 0.001, ****P < 0.0001, cytokine vs naïve. Δ = p < 0.05, ΔΔ = p < 0.001 IFA vs MOG). Demyelination of cortical layers I-III was significant in MOG immunised animals at both 28 and 56 dpi, but only at 56 days in IFA animals (l). Subpial demyelination also extended in the rostral plane in MOG immunised animals at 56 days (m). Quantification of demyelination 1 mm anterior to the injection site in MOG immunised animals was equal to or greater than at the injection site at both 28 and 56 days after cytokine vector injection (n-p). Immunostaining for the transcription factor Olig2 revealed a substantial reduction in oligodendroglial lineage cells in cortical layers of MOG animals when compared to naïve (q), both for IFA and MOG immunised animals at 28 days post injection in the midline (r) and cortical layers (s), with no significant difference between IFA and MOG immunised animals (data are mean +/−SEM from n = 5–6 animals per group. Statistics: 1-way analysis of variance with Tukey post test. *p < 0.05, **P < 0.01). Scale bars = 300 μm (a-c), 50 μm (d,e)
Fig. 3
Fig. 3
Viral delivery of cytokines into the CSF caused microglial activation in the underlying cortex. Microglial activation, indicated by IBA1 reactivity, was widespread in all cortical layers and the corpus callosum at 28 days (illustrated for MOG immunised animals) post cytokine viral vector injection, whereas injection with eGFP vector led to minimal Iba1 expression that was not different from naïve rats (a,b). Subpial demyelinated lesions in animals immunised with MOG and injected with cytokine vectors were characterised by large numbers of Iba1+ microglia with a highly activated morphology at 28 dpi (c,d). No amoeboid-like macrophages could be seen in the GM parenchyma at any stage. The number of Iba1+ cells was significantly increased in the cortical layers of both IFA and MOG immunised cytokine vector injected animals in all regions and at all timepoints, except for the midline II-IV at 56 dpi (e,f), with the greatest increases seen in MOG immunised animals. The greatest increase in Iba1+ cells was seen in the midline layer I region, closest to the immune aggregates in the sagittal sulcus (e), with slightly lower numbers in midline layer II-V (e). Iba1+ numbers were higher in cortical layer I than underlying layer II-V (f). Data are presented as mean ± SEM. Statistics: one-way ANOVA with Tukey post-hoc test. **** P < 0.0001, * P < 0.05 naïve versus cytokine or ΔΔΔΔ P < 0.0001. ΔΔΔ P < 0.001, ΔΔ P < 0.01, Δ p < 0.05 for comparison between 28 and 56 dpi for the same group (IFA vs IFA). Scale bar = 200 μm (a,b), 25 μm (c,d)
Fig. 4
Fig. 4
Neuronal loss in the cortical parenchyma. Loss of neuronal NeuN staining is seen in layer II along the sagittal sulcus and in layer V/VI bordering the corpus callosum at 28 days following cytokine vector injection (illustrated for IFA animals in a). No neuronal loss was seen in GFP vector animals (not shown). A decreased density of NeuN+/HuCD+ expressing neurons was seen at 56 days after cytokine vector injection in cortical layers II/III in both IFA (c) and MOG (d,e) immunised animals compared to naïve (b). Extensive regions spreading down from the pial surface in some animals displayed loss of NeuN/HuC/D+ cells (e). A reduction in NeuN+/HuCD+ neurons was present in cortical layer V (white lines) in IFA and MOG cytokine vector injected animals at 56 dpi (f-h). Images of co-staining with HuC/D and NeuN reveal the loss of NeuN expression in some neurons (i). Neuronal numbers were decreased in midline regions (layers I-IV) in both MOG and IFA immunised animals at 28 and 56 dpi (j). Neuronal loss in the upper layers II/III developed more gradually in both MOG and IFA animals and only became significant at 56 dpi (k). In layer V neuronal loss was significant at 28 and 56 dpi in MOG animals but only at 56 dpi in IFA animals (l). Levels of neuronal loss were similar for MOG or IFA animals at 56 dpi (k,l). Neuronal loss only became significant in the lateral cortex at 56 dpi (m-o). Neuronal loss could also be seen 1 mm anterior to the injection site (illustrated for a MOG animal at 56 dpi in p). Immunostaining for NFil and MAP2 in upper cortical layers revealed a reduction of staining in the apical dendritic tufts and the descending dendritic bundles that extended into layer II/III (illustrated for a MOG animal at 28 dpi in q,r). 1-way ANOVA with Tukey post multiple comparisons test, ***P < 0.001, **P < 0.01, *P < 0.05. Data represents mean ± SEM n = 5–7 animals per group. Scale bars = 30 μm (a), 100 μm (b-g,n-p), 20 μm (q,r)
Fig. 5
Fig. 5
Expression of cell death related proteins in cortical neurons. CNPase+/Cleaved Casp-3+ oligodendrocytes are illustrated at 28 dpi in the cortical layers of MOG immunised animals injected with cytokine viral vectors, indicating apoptosis (a), whereas no NeuN+/Cleaved Casp-3+ neurons were found (b). QRT-PCR analysis showed increased gene expression for the necroptosis genes RIPK3 and MLKL in cortical tissue from 28 dpi cytokine viral vector injected animals compared to GFP controls, with no significant difference between IFA or MOG immunised animals (c). Levels of endogenous rat IFNγ (d) and TNF (e) genes were upregulated at 28 and 56 dpi in both MOG and IFA immunised animals, with highest levels at 28dpi. Statistics C-E: t-tests on Ct values, *P < 0.05. Laminar distribution of pMLKL staining in naïve and MOG animals shows very minimal expression in naïve animals and significant expression in layers II/III and V in a MOG immunised animal at 56 dpi (f). This pattern was not different between MOG and IFA immunised animals (not shown). pMLKL expression was greatest in layers II-III in closest proximity to the subpial surface, with similar numbers of cells were present in IFA and MOG immunised animals (g,h). Co-staining for NeuN and pMLKL showed the absence of pMLKL in naïve cortex (i) and identified pMLKL-expressing cells as neurons in 56 dpi cytokine vector injected MOG immunised animals (j; from region in dashed box). Confocal imaging of neurons from the subpial cortical layers showed that pMLKL was upregulated in cytokine vector injected animals within the nucleus of neurons, whilst the unphosphorylated form was located in the cytoplasm (k). Although pMLKL was largely constrained to the nucleus in the majority of neurons (k,l), pMLKL could also be seen in the cytoplasm/membrane compartment in some neurons (m). Scale bars = 10 μm (a,b), 200 μm (f-h), 5 μm (k-m)
Fig. 6
Fig. 6
Changes to gait parameters measured using Catwalk XT. Following 1 week of training, a quantitative fully automated gait analysis was conducted on the animals 7 days before surgery and then repeated at 9, 21 and 35 days post injection of the cytokine or GFP lentiviral vector. The graphs show the average for each parameter from 6 compliant runs with separate lines for each of the paws (RF: right forelimb; LF: left forelimb; RH: right hindlimb; LH: left hindlimb). The body speed was significantly lower in both IFA and MOG immunised animals at 21 dpi compared to GFP (a). Both IFA and MOG animals showed a decrease in percentage of the regularity index (%), which is the number of normal step sequence patterns relative to the total number of paw placements used as a measure of interlimb coordination (b). Cytokine viral vector injection decreased the duration of the stance phase, which is the average time in seconds that the paw is in contact with the glass plate for each step cycle, of all paws at 21 dpi and the hind paws at 35 dpi (c). The duty cycle represents the percentage of time the paw accounts for the total step cycle of the paw and decreased for the right front and left and right hind paws at 21 dpi for IFA animals and at right front and hind paws for MOG animals in animals receiving cytokine viral vectors (d). There was no change to swing speed following cytokine injection at any timepoint (e). All values are given as mean ± SEM. Statistics: ANOVA with TUKEY post hoc test. *P < 0.01 compared to GFP injected group

References

    1. Agresti C, Bernardo A, Del Russo N, Marziali G, Battistini A, Aloisi F, et al. Synergistic stimulation of MHC class I and IRF-1 gene expression by IFN-gamma and TNF-alpha in oligodendrocytes. Eur J Neurosci. 1998;10:2975–2983. doi: 10.1111/j.1460-9568.1998.00313.x. - DOI - PubMed
    1. Aloisi F, De Simone R, Columba-Cabezas S, Levi G. Opposite effects of interferon-gamma and prostaglandin E2 on tumor necrosis factor and interleukin-10 production in microglia: a regulatory loop controlling microglia pro- and anti-inflammatory activities. J Neurosci Res. 1999;56:571–580. doi: 10.1002/(SICI)1097-4547(19990615)56:6<571::AID-JNR3>3.0.CO;2-P. - DOI - PubMed
    1. Bevan RJ, Evans R, Griffiths L, Watkins LM, Rees MI, Magliozzi R, et al. Meningeal inflammation and cortical demyelination in acute multiple sclerosis. Ann Neurol. 2018;84:829–842. doi: 10.1002/ana.25365. - DOI - PubMed
    1. Bo L, Vedeler CA, Nyland H, Trapp BD, Mork SJ. Intracortical multiple sclerosis lesions are not associated with increased lymphocyte infiltration. Mult Scler. 2003;9:323–331. doi: 10.1191/1352458503ms917oa. - DOI - PubMed
    1. Bsibsi M, Peferoen LA, Holtman IR, Nacken PJ, Gerritsen WH, Witte ME, et al. Demyelination during multiple sclerosis is associated with combined activation of microglia/macrophages by IFN-gamma and alpha B-crystallin. Acta Neuropathol. 2014;128:215–229. doi: 10.1007/s00401-014-1317-8. - DOI - PubMed

Publication types

MeSH terms