. 2020 Jul 10;295(28):9379-9391.
doi: 10.1074/jbc.RA120.012723. Epub 2020 May 12.

Structural optimization of a TNFR1-selective antagonistic TNFα mutant to create new-modality TNF-regulating biologics

Affiliations

Structural optimization of a TNFR1-selective antagonistic TNFα mutant to create new-modality TNF-regulating biologics

Masaki Inoue et al. J Biol Chem. .

Abstract

Excessive activation of the proinflammatory cytokine tumor necrosis factor-α (TNFα) is a major cause of autoimmune diseases, including rheumatoid arthritis. TNFα induces immune responses via TNF receptor 1 (TNFR1) and TNFR2. Signaling via TNFR1 induces proinflammatory responses, whereas TNFR2 signaling is suggested to suppress the pathophysiology of inflammatory diseases. Therefore, selective inhibition of TNFR1 signaling and preservation of TNFR2 signaling activities may be beneficial for managing autoimmune diseases. To this end, we developed a TNFR1-selective, antagonistic TNFα mutant (R1antTNF). Here, we developed an R1antTNF derivative, scR1antTNF-Fc, which represents a single-chain form of trimeric R1antTNF with a human IgG-Fc domain. scR1antTNF-Fc had properties similar to those of R1antTNF, including TNFR1-selective binding avidity, TNFR1 antagonistic activity, and thermal stability, and had a significantly extended plasma t1/2in vivo In a murine rheumatoid arthritis model, scR1antTNF-Fc and 40-kDa PEG-scR1antTNF (a previously reported PEGylated form) delayed the onset of collagen-induced arthritis, suppressed arthritis progression in mice, and required a reduced frequency of administration. Interestingly, with these biologic treatments, we observed an increased ratio of regulatory T cells to conventional T cells in lymph nodes compared with etanercept, a commonly used TNF inhibitor. Therefore, scR1antTNF-Fc and 40-kDa PEG-scR1antTNF indirectly induced immunosuppression. These results suggest that selective TNFR1 inhibition benefits the management of autoimmune diseases and that R1antTNF derivatives hold promise as new-modality TNF-regulating biologics.

Keywords: antagonist; arthritis; autoimmune disease; cytokine; drug delivery; drug design; forkhead box P3 (FOXP3); inflammation; inhibition mechanism; protein engineering; single-chain; tumor necrosis factor (TNF).


Conflict of interest statement

Conflict of interest—The authors declare that they have no conflicts of interest with the contents of this article.

Figures

Figure 1.
Figure 1.
Generation and characterization of scR1antTNF-Fc protein. A, schematic structure modeling of scR1antTNF-Fc protein. Two TNFR1 antagonistic proteins were fused with human IgG-Fc. N, N-terminal. Amino acid sequences and domain information of scR1antTNF-Fc are described in Fig. S1A. B, X-ray structure modeling of the scR1antTNF-TNFR1 complex. scR1antTNF bound to the homotrimer of TNFR1. Red, TNFR1; green, TNFR1 interaction domain of scR1antTNF; orange, peptide linker for forming the single-chain structure. C, schematic pCAG-based mammalian expression vector for scR1antTNF-Fc protein. The cDNA was composed to express scR1antTNF-Fc whereby triple R1antTNF domains fused by peptide linkers (GGGSGGG) were further fused to a human–IgG Fc domain (Ch2 and Ch3). Signal sequence peptide genes derived from a mouse IgG Vh (Vhss) or human IL-2 (IL-2ss) were linked at the 5′-terminal of scR1antTNF-Fc cDNA. D, supernatants of cultured medium (left side) and purified proteins (right side) 7 days after transfection were assessed by SDS-PAGE following Coomassie Brilliant Blue staining. Arrowhead shows an ∼75-kDa band of the scR1antTNF-Fc monomer. E, each recombinant protein expressed with Vhss and IL-2ss was purified by size-exclusion chromatography. F, the molecular weight of monomeric scR1antTNF-Fc protein was confirmed by Western blotting with an anti-human IgG-Fc antibody.
Figure 2.
Figure 2.
In vitro binding affinity of scR1antTNF-Fc. A, in vitro receptor-binding ability of human TNFα, scR1antTNF, and scR1antTNF-Fcs to human TNFR1 and human TNFR2 was analyzed by SPR. Each sensorgram shows the association (120 s) and dissociation (120 s) repeats at five serial concentrations (1.2, 3.7, 11.1, 33.3, and 100 nm) using single-cycle kinetics. Analytes: TNFα, scR1antTNF, scR1antTNF-Fc (Vhss), and scR1antTNF-Fc (IL-2ss). Ligands: Fc chimera proteins of human TNFR1 and human TNFR2. B, kinetic parameters of each protein to human TNFR1/TNFR2 were analyzed with a 1:1 binding model using BIAcore × 100 evaluation software (n = 1). The avidity of scR1antTNF-Fc (Vhss) and scR1antTNF-Fc (IL-2ss) were analyzed as a bivalent analyte. Kd, ka, and kd indicated the dissociation constant, association rate constant, and dissociation rate constant, respectively.
Figure 3.
Figure 3.
Thermal stability of scR1antTNF-Fc. A, thermal stabilities of scR1antTNF, scR1antTNF-Fc (Vhss), scR1antTNF-Fc (IL-2ss) and etanercept were measured by thermal shift assay using differential scanning fluorometry. Proteins serially diluted from 250 μg/ml by 2-fold dilution are indicated. B, temperature of the peak apex of five concentrations show the denaturation temperature (Tm). Tm values calculated from the result of thermal shift assay using Protein Thermal Shift Software.
Figure 4.
Figure 4.
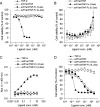
In vitro bioactivity of scR1antTNF-Fc via TNFR1 or TNFR2. A, in vitro agonistic bioactivities of scR1antTNF or scR1antTNF-Fcs through TNFR1 for LM cells were measured. Human TNFα was used as a control. B, antagonistic activities of scR1antTNF, scR1antTNF-Fc (Vhss), and scR1antTNF-Fc (IL-2ss) via TNFR1 were confirmed by LM cell assay. LM cells were treated with each protein in the presence of mouse TNFα (5 ng/ml). The TNF inhibition rate was determined from the LM cell viability. C, NF-κB induction was evaluated by reporter assay using Ramos-Blue cells. Ligand-dependent SEAP activities were detected. D, agonistic activity via TNFR2 was evaluated by the cell death of huTNFR2/mFas preadipocytes. Data are shown as the mean ± S.D. (n = 3).
Figure 5.
Figure 5.
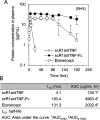
In vivo plasma clearance of scR1antTNF-Fc. A, plasma clearances of scR1antTNF, scR1antTNF-Fc, and etanercept were confirmed after i.p. injection. Etanercept was used as a positive control. Plasma concentrations of these proteins were measured by ELISA for human TNF or human IgG-Fc. Data are shown as the mean ± S.D. of five mice per group. B, half-lives and AUCs were calculated from time-concentration curves by moment analysis.
Figure 6.
Figure 6.
scR1antTNF-Fc treatment suppresses inflammation in arthritis mice. A, DBA/1 mice were immunized by the subcutaneous injection of bovine type II collagen with CFA. Saline (n = 6), etanercept (1250 μg/kg) (n = 6), and scR1antTNF-Fc (50 μg/kg) (n = 6) were administered i.p. twice a week from day 22 after immunization. B and C, sum of arthritis scores of four paws (B) and body weight (C) were measured for 3 weeks. D, arthritis incidence was calculated from the number of mice with swollen limbs. E, joint swelling in a representative individual from each group at day 42 is shown. Data are shown as the mean ± S.E.; *p < 0.05 (one-way ANOVA with Tukey's multiple comparisons test).
Figure 7.
Figure 7.
Effects of scR1antTNF-Fc treatment on joint pathology and blood cytokine levels. A, after treatment of CIA mice with saline, etanercept (1250 μg/kg), or scR1antTNF-Fc (50 μg/kg) for 3 weeks (on day 42), histological sections of the ankle joint from a hind limb were prepared and stained with H&E. B, histopathologic features such as cell infiltration, synovitis, destruction of cartilage, and the juxta-articular bone involvement on day 42 were scored. C, TRAP-positive cells were stained using serial sections to detect osteoclasts. TRAP-positive cells with ≥1 nucleus were counted as indicated by an arrow. D, mouse IL-1β (n = 6) in plasma on day 42 was measured by ELISA. Etanercept, 1250 μg/kg; scR1antTNF-Fc, 50 μg/kg. Data are shown as the mean ± S.D.; *, p < 0.05 (one-way ANOVA with Tukey's multiple comparisons test).
Figure 8.
Figure 8.
Effect of scR1antTNF-Fc administration on T cell subpopulations. At day 42, lymph nodes were isolated from CIA mice administered i.p. with saline (n = 6), etanercept (1250 μg/kg) (n = 6), or scR1antTNF-Fc (50 μg/kg) (n = 6) for 3 weeks. After single cells were prepared, the expressions of lymphocyte markers were analyzed by flow cytometry. A, representative flow cytometry data of each administration group are shown. T cells were separated by CD8, CD4, and Foxp3 expression levels. B, the percentage of CD4+ T cells and CD8+ T cells in lymph node cells was analyzed. C, the percentage of CD4+ Foxp3+ Tregs and CD4+ Foxp3 Tconvs in CD4+ T cells was measured. The ratio of Tregs/Tconvs was calculated from the results of individual mice. Data are shown as the mean ± S.D. of eight mice per group; *, p < 0.05, **, p < 0.01 (one-way ANOVA with Tukey's multiple comparisons test).
Figure 9.
Figure 9.
PEGylated scR1antTNF suppresses arthritis in CIA mice as well as scR1antTNF-Fc. A, schematic structure modeling of 40-kDa PEG-scR1antTNF. Branched PEG, which has two 20-kDa PEG chains, was fused to scR1anTNF on an N-terminal amine group. Amino acid sequences, domain information, and molecular modification sites of 40-kDa PEG-scR1antTNF are described in Fig. S1B. B, saline (n = 8), etanercept (1250 μg/kg) (n = 8), scR1antTNF-Fc (10 μg/kg) (n = 8), and 40-kDa PEG-scR1antTNF (10 μg/kg) (n = 8) were administered i.p. twice a week to CIA mice from day 22 after immunization. Arthritis scores were evaluated for 3 weeks. Data are shown as the mean ± S.E.; *, p < 0.05 (one-way ANOVA with Tukey's multiple comparisons test). C, body weight was measured from day 22 to day 35. D, wrist joint swelling of a representative mouse in each group at day 35 is shown. E, the percentages of CD4+ T cells and CD8+ T cells in lymph node cells were analyzed in each treatment group on day 35 by FCM. F, the percentages of CD4+ Foxp3+ Tregs and CD4+ Foxp3 Tconvs in CD4+ T cells were analyzed at day 35. The ratio of Tregs/Tconvs was calculated from the results of individual mice. Data are shown as the mean ± S.D.; *, p < 0.05; **, p < 0.01 (one-way ANOVA with Tukey's multiple comparisons test).

References

    1. Smolen J. S., Aletaha D., Barton A., Burmester G. R., Emery P., Firestein G. S., Kavanaugh A., McInnes I. B., Solomon D. H., Strand V., and Yamamoto K. (2018) Rheumatoid arthritis. Nat. Rev. Dis. Primers 4, 18001 10.1038/nrdp.2018.1 - DOI - PubMed
    1. Smolen J. S., Aletaha D., and McInnes I. B. (2016) Rheumatoid arthritis. Lancet 388, 2023–2038 10.1016/S0140-6736(16)30173-8 - DOI - PubMed
    1. Gottenberg J. E., Brocq O., Perdriger A., Lassoued S., Berthelot J. M., Wendling D., Euller-Ziegler L., Soubrier M., Richez C., Fautrel B., Constantin A. L., Mariette X., Morel J., Gilson M., Cormier G., et al. (2016) Non-TNF-targeted biologic vs a second anti-TNF drug to treat rheumatoid arthritis in patients with insufficient response to a first anti-TNF drug: A randomized clinical trial. JAMA 316, 1172–1180 10.1001/jama.2016.13512 - DOI - PubMed
    1. Laas K., Peltomaa R., Kautiainen H., and Leirisalo-Repo M. (2008) Clinical impact of switching from infliximab to etanercept in patients with rheumatoid arthritis. Clin. Rheumatol. 27, 927–932 10.1007/s10067-008-0880-6 - DOI - PubMed
    1. van der Bijl A. E., Breedveld F. C., Antoni C. E., Kalden J. R., Kary S., Burmester G. R., Beckmann C., Unnebrink K., and Kupper H. (2008) An open-label pilot study of the effectiveness of adalimumab in patients with rheumatoid arthritis and previous infliximab treatment: Relationship to reasons for failure and anti-infliximab antibody status. Clin. Rheumatol. 27, 1021–1028 10.1007/s10067-008-0866-4 - DOI - PMC - PubMed

Publication types

MeSH terms

Substances

LinkOut - more resources