. 2020 May 12;10(1):7869.
doi: 10.1038/s41598-020-64292-x.

Extracellular Signal-Regulated Kinases Mediate an Autoregulation of GABAB-Receptor-Activated Whole-Cell Current in Locus Coeruleus Neurons

Affiliations

Extracellular Signal-Regulated Kinases Mediate an Autoregulation of GABAB-Receptor-Activated Whole-Cell Current in Locus Coeruleus Neurons

Rui-Ni Wu et al. Sci Rep. .

Abstract

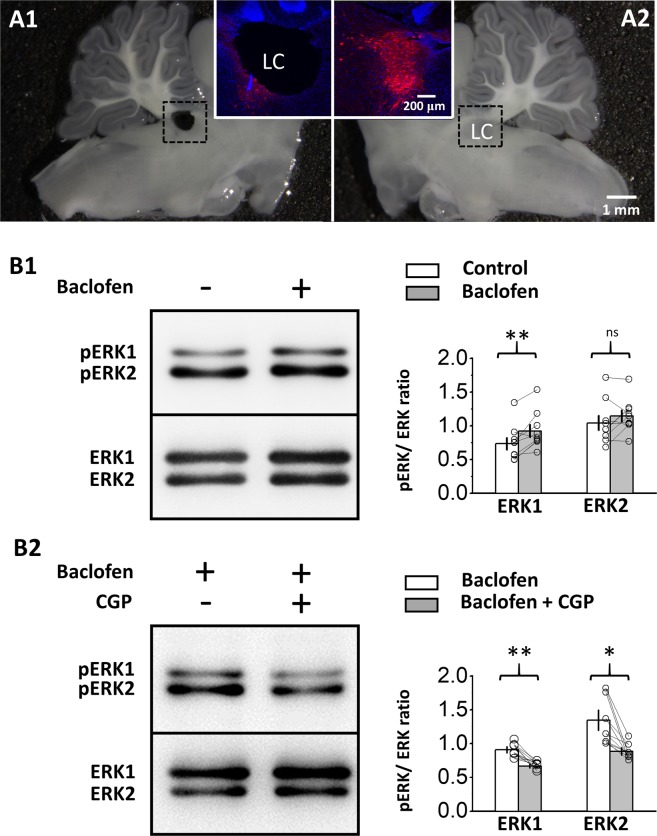
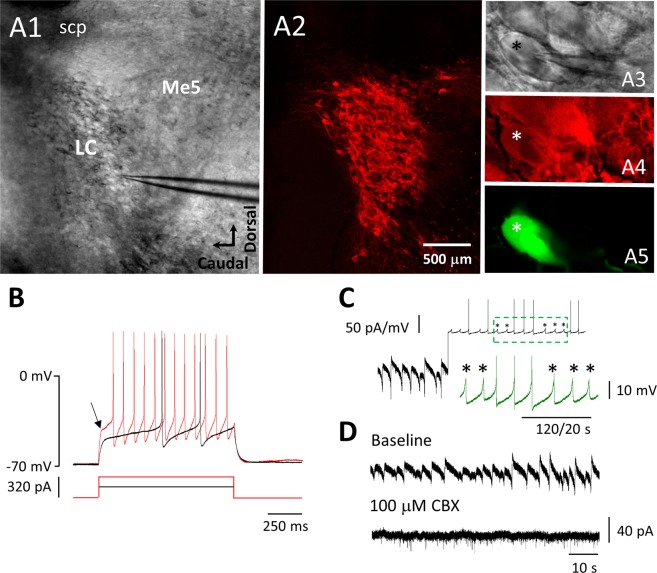
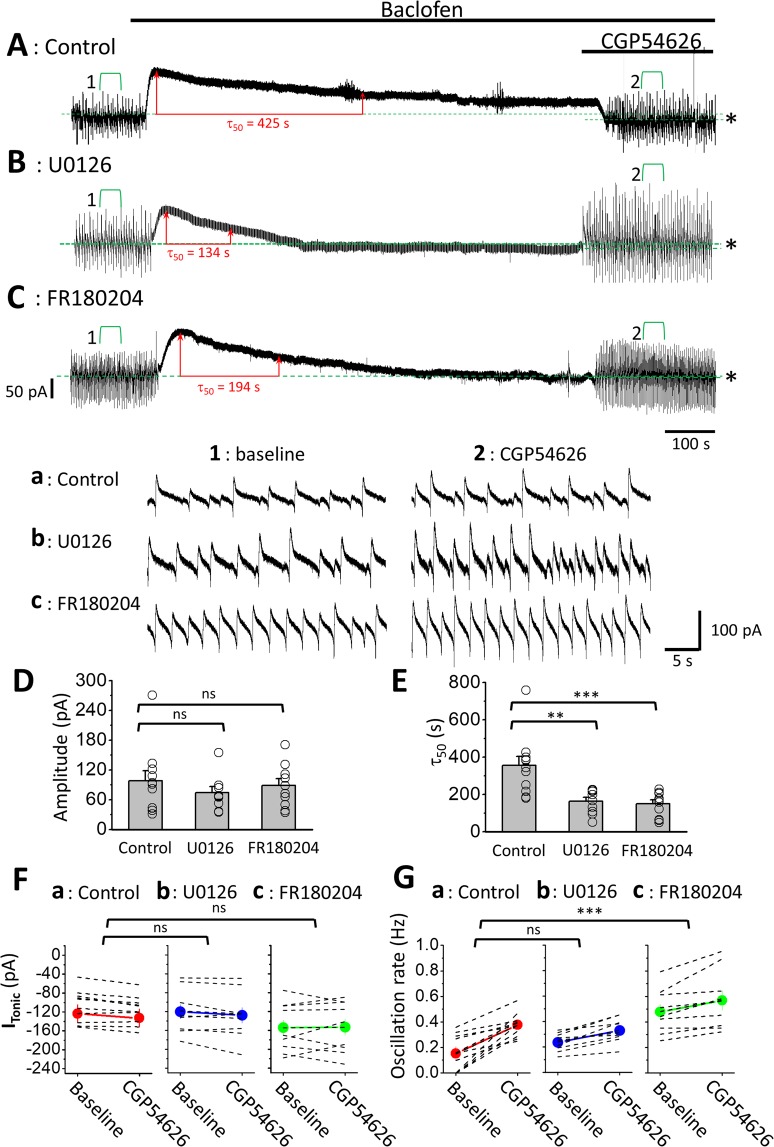
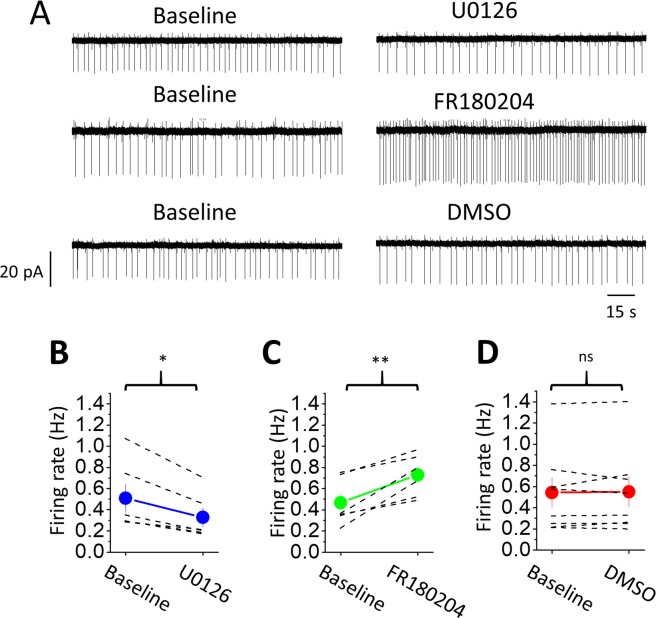
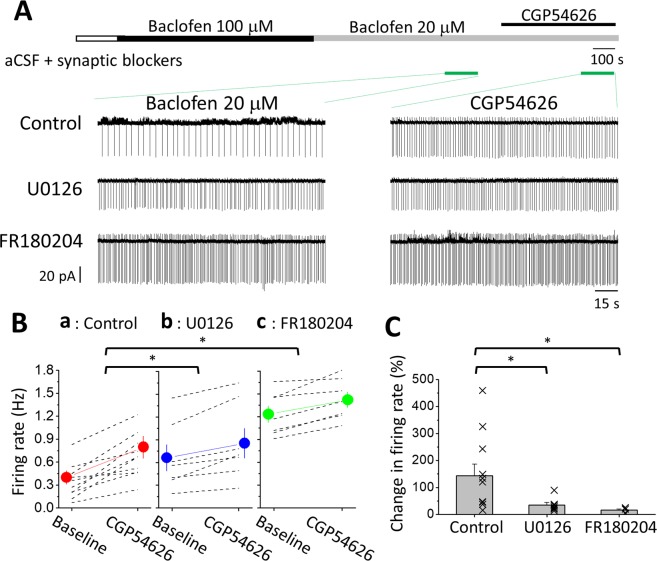
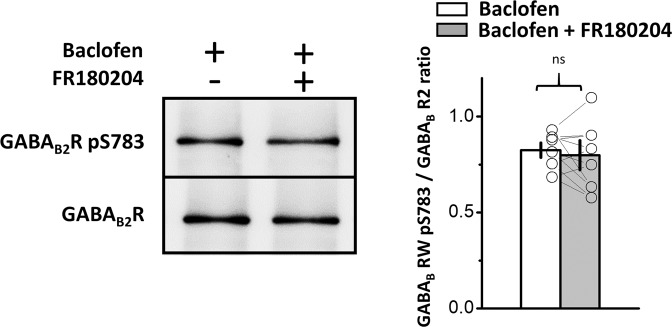
The norepinephrine-releasing neurons in the locus coeruleus (LC) are well known to regulate wakefulness/arousal. They display active firing during wakefulness and a decreased discharge rate during sleep. We have previously reported that LC neurons express large numbers of GABAB receptors (GABABRs) located at peri-/extrasynaptic sites and are subject to tonic inhibition due to the continuous activation of GABABRs by ambient GABA, which is significantly higher during sleep than during wakefulness. In this study, we further showed using western blot analysis that the activation of GABABRs with baclofen could increase the level of phosphorylated extracellular signal-regulated kinase 1 (ERK1) in LC tissue. Recordings from LC neurons in brain slices showed that the inhibition of ERK1/2 with U0126 and FR180204 accelerated the decay of whole-cell membrane current induced by prolonged baclofen application. In addition, the inhibition of ERK1/2 also increased spontaneous firing and reduced tonic inhibition of LC neurons after prolonged exposure to baclofen. These results suggest a new role of GABABRs in mediating ERK1-dependent autoregulation of the stability of GABABR-activated whole-cell current, in addition to its well-known effect on gated potassium channels, to cause a tonic current in LC neurons.


Conflict of interest statement

The authors declare no competing interests.

Figures

Figure 1
Figure 1
The activation of GABABRs increases pERK1 levels in LC tissue. (A) The images show two sagittal brainstem slices from an animal. The LC in the left slice was punched (A1) for western blot analysis, and the right slice was used for comparison (A2). IHC with anti-TH antibody was performed for the two slices, as shown in the insets showing merged fluorescence images of anti-TH (red) and DAPI (blue) staining of the dashed rectangular areas at high magnification. A comparison of the two slices shows that the punched area contained mostly TH-ir tissue. (B) Images show representative western blot analysis results for pERK1/2 in LC tissue punched from slices bathed in vehicle or baclofen (B1) and from slices bathed in baclofen or baclofen plus CGP54626 (B2). The plot in the right panels summarizes the results. Each paired circle and line indicates the result of a single experiment; bars and capped lines denote the mean and SEM, respectively. The asterisks denote significant differences compared to the control at p < 0.05 (*) and p < 0.01 (**); ns denotes no significance compared to the control.
Figure 2
Figure 2
Recordings from LC neurons (A) Images showing the identification of LC neurons with post hoc IHC using the anti-TH antibody. A1 and A3 show online phase contrast images of a sagittal brainstem slice at low (A1) and high magnification (A3). A2 and A4 show fluorescence images of anti-TH staining of the same field and magnification as shown in A1 and A3, respectively. A5 shows a fluorescence image of the same field and magnification as in A4 showing a recorded neuron filled with biocytin. This neuron also displayed TH-ir, as indicated by the asterisk. Abbreviations: Me5, mesencephalic trigeminal nucleus; scp, superior cerebellar peduncle. (B) Representative current-clamp recording from the TH-ir (LC) neuron shown in A, showing Vm responses (top traces) to current injection (bottom traces). Note the delay in the onset of AP (see arrow) elicited from Vm held at −70 mV. (C) A representative V-clamp (left bottom half) and I-clamp (right upper half) recording from an LC neuron. The arrow indicates switching of the recording from V-clamp to I-clamp mode. Note the biphasic IOsc in the V-clamp recording and the spontaneous APs and voltage oscillation in the I-clamp recording. The inserted green trace shows activity marked by the dashed rectangle on a faster and larger scale. Asterisks mark the voltage oscillations. The vertical bar to the left of the trace shows the amplitude scale for V-clamp (50 pA) or I-clamp (50 mV) recordings; the one to the right of the inserted trace shows the amplitude scale for the inserted trace; the bottom horizontal bar shows the time scale for the whole trace (120 s) and the inserted trace (20 s). (D) A representative experiment with V-clamp recordings from an LC neuron showing that IOsc are blocked by the application of 100 μM CBX, a gap junction blocker; top and bottom traces show recordings before and after CBX application, respectively.
Figure 3
Figure 3
The inhibition of ERK1/2 decreases the τ50 of IGABABR in LC neurons. (A-C) Representative recording of IGABABR from LC neurons in the control slice (A), U0126-treated slice (B), and FR180204-treated slice (C). The red double-headed line marks τ50, and the long and short green dashed lines mark the means of the membrane current recorded at baseline (before baclofen) and upon CGP54626 application. Note that the difference is measured as ITonic, as indicated by the asterisk. The activity marked with the green square bracket is enlarged and shown at the bottom (traces a-c). Note the increased frequency of IOsc with CGP54626 application compared with baseline. (D-G) Plots show summarized results of the amplitude (D) and τ50 (E) of IGABABR, ITonic (F) and the rate of IOsc (G). Each circle (D-E) or dashed line (F-G) shows the result of an individual experiment; bars (D-E) or circles (F-G) denote the mean, and capped lines denote the SEM. The asterisks indicate a significant difference in τ50 (E) or in the increment of IOsc frequency (G) compared to the control at p < 0.01 (**) or at p < 0.005 (***). p denotes a significant increase in IOsc frequency after CGP54626 application (G); ns denotes no significant difference compared to the control.
Figure 4
Figure 4
Effects of ERK1/2 inhibitors on the firing rate of LC neurons. (A) Representative episodes of firing rate recording from LC neurons before (baseline) (left panel) and after 30 mins of drug applications (right panel). The top, middle and bottom traces show the application of U0126, FR180204 and the vehicle (DMSO), respectively. (B-D) Summarized results show the change in the SFR upon U0126 (B), FR180204 (C) and DMSO (D) application. The asterisks indicate a significant difference compared to the control at p < 0.05 (*) or at p < 0.01 (**).
Figure 5
Figure 5
The inhibition of ERK1/2 attenuates GABABR-mediated tonic inhibition of LC neurons. (A) The top bar shows the experimental protocol, and the bottom traces show representative episodes of recordings with baclofen (left panel) and CGP54626 (right panel) from an LC neuron in control slices (upper raw), U0126-treated (middle), and FR180204-treated slices (bottom raw). The recordings were performed using the cell-attached configuration to record spontaneous APs. (B & C) Summarized results show the change in the spontaneous firing rate upon CGP54626 application (B) and GABABR-mediated tonic inhibition (C). Each dashed line (B) or cross (C) shows the results of an individual experiment; the circles (B) or bars (C) denote the mean, and capped lines denote the SEM. The asterisks indicate a significant difference compared to the control at p < 0.05 (*).
Figure 6
Figure 6
ERK1/2 activated by GABABR does not have an effect on pGABAB2R. Left images show representative western blot analysis results for pGABAB2R in LC tissue punched from slices bathed in baclofen or in baclofen plus FR180204. The plot in the right panel summarizes the results. Each paired circle and line indicates the result of a single experiment; bars and vertical lines denote the mean and SEM, respectively. ns denotes no significance compared to the control.

References

    1. Belelli D, et al. Extrasynaptic GABAA receptors: form, pharmacology, and function. J. Neurosci. 2009;29:12757–12763. doi: 10.1523/JNEUROSCI.3340-09.2009. - DOI - PMC - PubMed
    1. Walker, M.C.&Kullmann, D.M. Tonic GABAA receptor-mediated signaling in epilepsy. In:Jasper’s Basic Mechanisms of the Epilepsies [Internet]. (eds Noebels, J. L., Avoli, M., Rogawski, M. A., Olsen, R. W. & Delgado-Escueta, A. V.) 4th edition. (Bethesda (MD): National Center for Biotechnology Information(US) (2012). - PubMed
    1. Ulrich D, Bettler B. GABAB receptors: synaptic functions and mechanisms of diversity. Curr. Opin. Neurobiol. 2007;17:298–303. doi: 10.1016/j.conb.2007.04.001. - DOI - PubMed
    1. Kulik A, et al. Subcellular localization of metabotropic GABAB receptor subunits GABAB1a/b and GABAB2 in the rat hippocampus. J. Neurosci. 2003;23:11026–11035. doi: 10.1523/JNEUROSCI.23-35-11026.2003. - DOI - PMC - PubMed
    1. Chen L, Boyes J, Yung WH, Bolam JP. Subcellular localization of GABAB receptor subunits in rat globus pallidus. J. Comp. Neurol. 2004;474:340–352. doi: 10.1002/cne.20143. - DOI - PubMed

Publication types

MeSH terms