. 2020 May 12;11(1):2362.
doi: 10.1038/s41467-020-16092-0.

Hepatocyte mitochondria-derived danger signals directly activate hepatic stellate cells and drive progression of liver fibrosis

Affiliations

Hepatocyte mitochondria-derived danger signals directly activate hepatic stellate cells and drive progression of liver fibrosis

Ping An et al. Nat Commun. .

Abstract

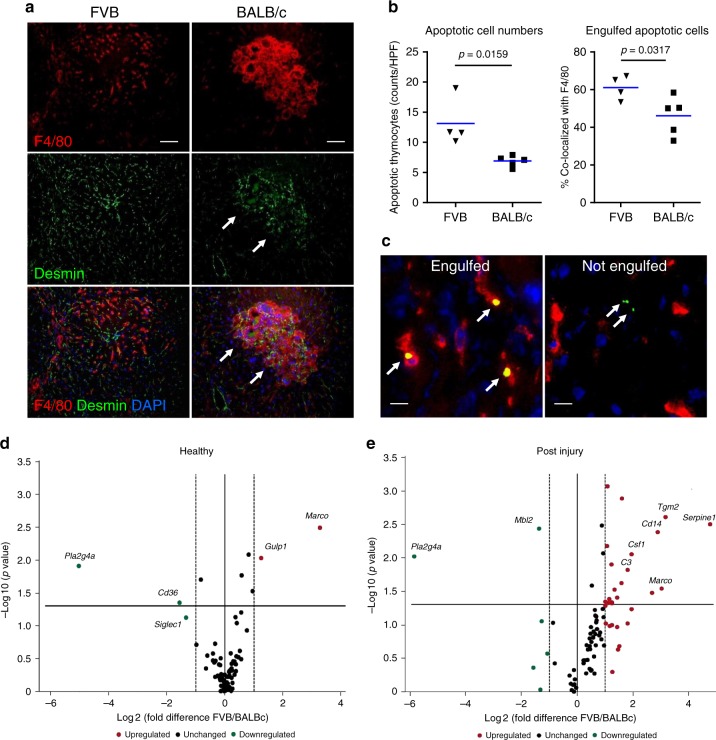
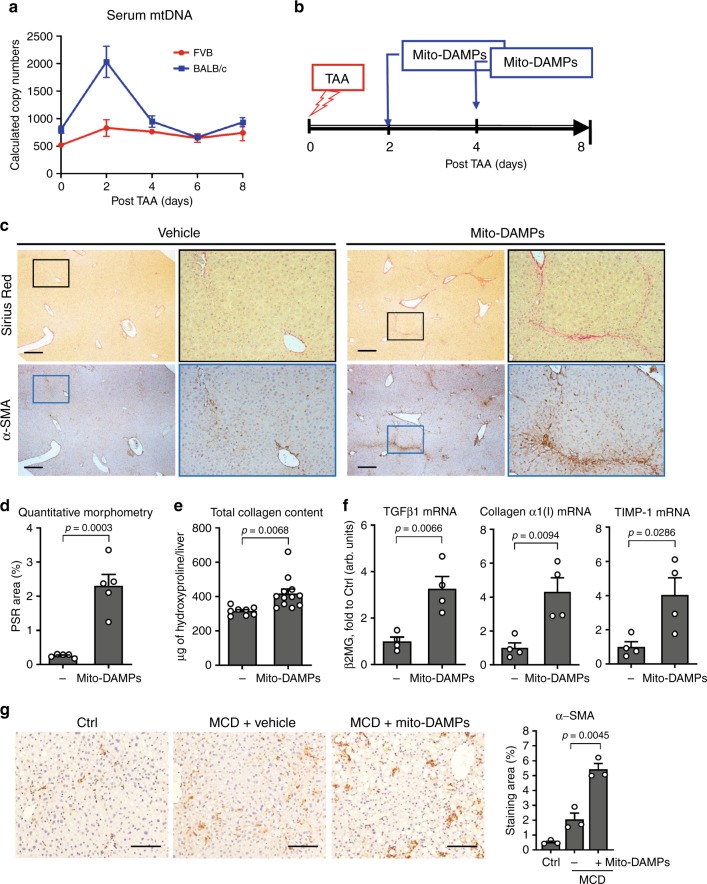
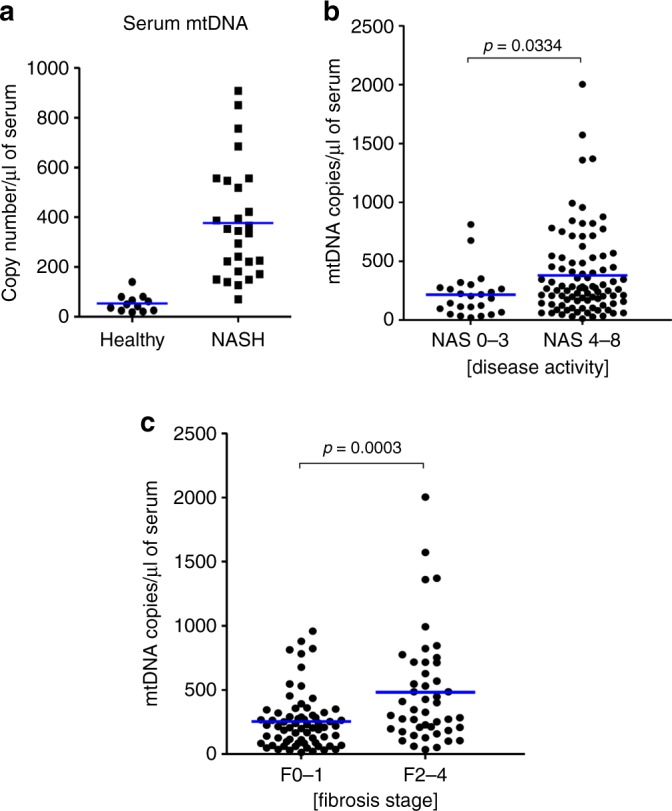
Due to their bacterial ancestry, many components of mitochondria share structural similarities with bacteria. Release of molecular danger signals from injured cell mitochondria (mitochondria-derived damage-associated molecular patterns, mito-DAMPs) triggers a potent inflammatory response, but their role in fibrosis is unknown. Using liver fibrosis resistant/susceptible mouse strain system, we demonstrate that mito-DAMPs released from injured hepatocyte mitochondria (with mtDNA as major active component) directly activate hepatic stellate cells, the fibrogenic cell in the liver, and drive liver scarring. The release of mito-DAMPs is controlled by efferocytosis of dying hepatocytes by phagocytic resident liver macrophages and infiltrating Gr-1(+) myeloid cells. Circulating mito-DAMPs are markedly increased in human patients with non-alcoholic steatohepatitis (NASH) and significant liver fibrosis. Our study identifies specific pathway driving liver fibrosis, with important diagnostic and therapeutic implications. Targeting mito-DAMP release from hepatocytes and/or modulating the phagocytic function of macrophages represents a promising antifibrotic strategy.


Conflict of interest statement

The authors declare no competing interests.

Figures

Fig. 1
Fig. 1. Fibrotic responses to acute TAA-induced hepatocyte injury recapitulate strain differences in fibrosis susceptibility (BALB/c > C57Bl/6 > FVB) in chronic liver fibrosis model.
a Experimental design of acute TAA-induced incipient liver fibrosis model in mice. Injury and wound healing responses were evaluated at 1, 3, 5, and 8 days after a single, acute sub-lethal dose of TAA (100 mg/kg, i.p.). b Significant collagen synthesis and deposition is readily detected in fibrosis-susceptible BALB/c mice after 5 days post-TAA injection by total hepatic collagen content measurements, with 2.5-fold increase in BALB/c strain, but not in FVB strain, after 5 days. For each strain at 0/1/3/5/8 days time-points, n = 7/6/5/4/8 (FVB), n = 5/6/4/4/11 (C57Bl/6), n = 8/6/4/4/12 (BALB/c) of individual animals. *P < 0.05; **p < 0.01; and ***p < 0.001 compared to respective strain controls (one-way ANOVA, followed by Tukey’s post test). c Extent of liver injury in response to TAA is comparable among studied strains and does not determine susceptibility to fibrosis. Cumulative hepatotoxicity of a single TAA injection was determined by serum ALT levels at early time-points at 12, 24, 48, and 96 h, which were used to calculate area under the curve (AUC). For each strain at 0.5/1/2/4 days time-points, n = 4/6/9/4/11 (FVB), n = 4/6/6/6/7 (C57Bl/6), n = 4/6/6/6/10 (BALB/c) of individual animals. AUC was similar between FVB and BALB/c strain (see total area under curve values in the table above the graph) and was greater in C57Bl/6, demonstrating no direct relationship of TAA hepatotoxicity with fibrosis susceptibility. d Connective tissue staining demonstrates scarless repair of pericentral areas in FVB, but pronounced pericentral fibrosis in BALB/c strain. C57Bl/6 mice show modest fresh fibers deposition. Representative images of pericentral areas in livers 8 days post TAA is shown (Sirius Red, original magnification, ×200; bar, 50 μm). C57Bl/6 strain demonstrates intermediate fibrotic response. Total HYP (mg/whole liver) was calculated from individual liver weights and respective relative HYP values (n = 4–12). Ctrl: non-fibrotic control group (n = 4) that received vehicle (saline) only; TAA: fibrotic mice treated with single-dose TAA (n = 4–12). Data are expressed as means ± SEM. Source data are provided as a Source Data file.
Fig. 2
Fig. 2. Delayed clearance of dead hepatocytes after injury precedes amplified fibrotic response in fibrosis-susceptible BALB/c strain.
a Histological examination suggests that single-dose TAA causes similar cell death in livers of FVB and BALB/c mice, but that the subsequent clearance rate of necrotic masses differs significantly. Necrotic masses (eosinophilic areas) are rapidly cleared in fibrosis-resistant FVB mice (by day 3), but persist in fibrosis-susceptible BALB/c mice past day 5 (representative low-magnification images, hematoxylin/eosin, ×50; bar, 20 μm). b Macroscopic appearance of representative livers from FVB and BALB/c mice 8 days post-TAA injury. FVB livers completely recovered by day 8 and appear virtually indistinguishable from healthy uninjured liver, while BALB/c livers demonstrate increased turgor, stiff consistence, and strong whitish pattern indicative of incomplete repair. c Pro-fibrogenic gene expression in post-TAA livers indicate that delayed normalization of multiple pro-fibrogenic mRNA expression is associated with fibrosis susceptibility in BALB/c mice. No significant strain difference at peak of fibrogenic response was observed (day 3). Hepatic expression of pro-fibrogenic (pro-collagen α1(I), TGFβ1, TIMP-1, and MMP-2) transcript levels was quantified by QRT-PCR during recovery (0–8 days) after single TAA injury. Results are expressed as means ± SEM, fold to healthy wild-type controls relative to β2MG mRNA (for each strain at 0/1/3/5/8 days time-points, n = 4/4/4/4/7 (FVB), n = 4/4/4/4/8 (BALB/c) of individual animals). P value as indicated (two-tailed, Mann–Whitney t test, not adjusted) when both strains are compared at corresponding time-point. Source data are provided as a Source Data file.
Fig. 3
Fig. 3. Impaired phagocytic macrophage function and efferocytosis after liver injury in fibrosis-susceptible BALB/c strain.
a Double immunofluorescence staining for the HSC marker desmin (green) and macrophage cell marker F4/80 (red) in FVB (left column) and BALB/c mice (right column) in late stage (8 days) of recovery. Normal peri-sinusoidal localization of desmin-positive stellate cells and F4/80-positive macrophages is restored in FVB mice, but not in BALB/c mice. Note large clusters of desmin-positive stellate cells (arrow) accumulate within granuloma-like macrophage infiltrates persisting in pericentral areas of BALB/c livers. Representative images at original magnification (×200; bar, 50 μm). b Total apoptotic cell counts (left panel) and % of apoptotic thymocytes engulfed by hepatic F4/80+ macrophages (right panel) significantly increased in the livers of FVB versus BALB/c mice 48 h post-TAA-induced liver injury. In vivo apoptotic thymocytes phagocytosis assay was performed as described in “Methods” and analyzed by cell scoring/counting in 10 random HPF per mouse. n = 4 (FVB), n = 5 (BALB/c); p value as indicated (two-tailed, Mann–Whitney t test). c Representative images of apoptotic cells (green, arrows; bar, 10 μm) scored as engulfed (left panel) or non-engulfed (right panel) by hepatic F4/80+ macrophages (red) 1 h after i.v. infusion of fluorescently labeled apoptotic thymocytes (green). d, e Volcano plots comparing statistically significant phagocytosis-related gene expression changes between FVB and BALB/c strains in total RNA of naive (d, healthy) or injured (e, 48 h post-TAA) livers. Total of 84 phagocytosis genes analyzed via RT2PCR phagocytosis array; values are obtained from four biological replicates after normalization to housekeeping gene β2MG. Log 2 values of the fold changes are plotted on the x-axis, the −log 10-transformed p values are plotted on the y-axis. The solid line in the graphs marks the p value of 0.05, and the dotted line marks a one-fold change. While only few genes were differentially expressed at baseline (C, two genes upregulated and two genes down-regulated), 20 genes were upregulated in response to injury in FVB mice compared to BALB/c (p < 0.05, t test). Differentially regulated genes by mini-array are annotated, and subset of genes cross-validated by TaqMan RT-PCR method are shown in bold (see also Supplementary Tables 4–6 for complete list of genes and TaqMan RT-PCR validation data). Source data are provided as a Source Data file.
Fig. 4
Fig. 4. Phagocytes depletion amplifies fibrogenic response and abrogates resistance to fibrosis in FVB mice, blunting strain differences after acute liver injury.
a Scheme of phagocytic macrophage depletion experiment where single injection of clodronate liposomes was performed either (1) 24 h prior (CLO-TAA) or (2) 24 h after (TAA-CLO) TAA administration, and (3) myeloid cell subsets depletion via administration of Gr-1, CD11b, or Ly-6G-specific mAB on first, third, and fifth day post TAA. All mice were sacrificed and evaluated at day 8 post TAA. b Connective tissue staining demonstrates significant pericentral deposition of collagen in FVB mice with macrophage depletion, virtually indistinguishable from lesions in BALB/c. No collagen deposition occurs in FVB mice without macrophage depletion (×50; bar, 100 μm). c Collagen deposition in livers of FVB and BALB/c mice with macrophage depletion before or after liver insult (for Ctrl/TAA/CLO + TAA/TAA + CLO groups, n = 4/11/4/7 (BALB/c), n = 4/7/7/8 (FVB) of individual animals). Macrophage depletion (before or after injury) abrogates fibrosis resistance in FVB mice, while having a minor effect on collagen levels in fibrosis-susceptible BALB/c mice. d Pro-fibrogenic gene expression in post-TAA livers demonstrates that fibrogenic responses are amplified and persist longer in FVB mice treated with CLO, similarly to levels observed in fibrosis-susceptible BALB/c. Hepatic expression of pro-fibrogenic (TGFβ1, pro-collagen α1(I), and TIMP-1) transcript levels was quantified by QRT-PCR 8 days after single TAA injury. Results are expressed as means ± SEM, and in arbitrary units (fold to healthy wild-type controls) relative to β2MG mRNA as described in “Methods.” e Fibrosis-resistant FVB mice were administered cell subset-specific antibody to deplete myeloid cells (Gr-1 mAB RB6-8C5, 200 μg/mouse), monocytes (CD11b mAB M1/70, 200 μg/mouse), isotype control (Iso, LTF-2 IgG2b, 200 μg/mouse), or granulocytes/neutrophils (Ly-6G mAB 1A8, 500 μg/mouse) on first, third, and fifth day after TAA injections (for Ctrl/TAA/CLO + TAA/TAA + CLO groups, n = 8/6/5/7 (BALB/c) and n = 9/6/5/8 (FVB) of individual animals). Representative low-magnification (×50; bar, 100 μm)) images show serial liver sections stained with H/E (upper row) and connective tissue staining (lower row, picrosirius red). *P < 0.05 compared to healthy controls of respective strain; #p < 0.05 compared to TAA group of respective strain without macrophage depletion (ANOVA with Dunnett’s post test). Source data are provided as a Source Data file.
Fig. 5
Fig. 5. Administration of hepatocyte-derived mito-DAMPs amplifies fibrogenic HSC activation in vivo and circumvent the resistance to fibrosis in FVB mice with TAA-induced liver injury.
a Release of mito-DAMPs into systemic circulation is elevated in fibrosis-susceptible BALB/c, but not in resistant FVB strain 2 days after single TAA-induced liver injury, as quantified by mtDNA levels in the serum. Data shown are 12S mtDNA region QRT-PCR expressed as target copy number/μl of serum (means ± SEM, for 0/2/4/6/8 days time-points, n = 6/5/4/9/4 (FVB), and n = 6/3/5/10/5 (BALB/c) of individual animals). b Scheme of exogenous hepatocyte mito-DAMP administration experiment. Purified mito-DAMPs (9.5 μg of mtDNA/mouse) were injected intraperitoneally into FVB mice 2 and 4 days post-TAA injury, and fibrotic responses evaluated 8 days after TAA. c Connective tissue staining (Sirius Red, upper panel) and immunohistochemistry for α-SMA (lower panel) in livers of FVB mice with mito-DAMP injection. Representative images shown at low (×50; bar, 50 μm) and high (×200) magnification as indicated. d Quantitative morphometry of collagen area (n = 5). e Hepatic collagen deposition is increased in mito-DAMP-treated FVB mice, as assessed biochemically via hydroxyproline content (controls (−), n = 8; mito-DAMPs, n = 12 individual animals). f Hepatic expression of pro-fibrogenic (pro-collagen α1(I), TGFβ1, and TIMP-1) transcript levels as quantified by QRT-PCR (n = 4). g Representative α-SMA staining images in C57Bl/6 mice with early-stage steatohepatitis due to MCD feeding for 2 weeks with morphometric quantification (×100, n = 3; bar, 50 μm), 24 h after mito-DAMP administration (9.5 μg of mtDNA/mouse, i.p.). Results are expressed as means ± SEM, and in arbitrary units (fold to healthy controls) relative to β2MG mRNA as described in “Methods.” Two-tailed p value indicated as compared to vehicle controls (unpaired t test). Source data are provided as a Source Data file.
Fig. 6
Fig. 6. Hepatocyte-derived mito-DAMPs directly trigger fibrogenic activation of primary hepatic stellate cells, with mtDNA as a major active component.
Freshly isolated murine HSCs were incubated for 24 h in vitro with increasing concentration of mito-DAMPs (corresponding to 2.5–7.5 μg of intact mtDNA/ml) prepared from purified liver mitochondria. a Changes in HSC morphology upon mito-DAMPs exposure (upper panel, phase contrast and lower panel, immunofluorescence for HSC activation marker α-SMA; bar, 50 μm). Representative images of two independent experiments (cell isolations). b HSC proliferation assessed by the MTT assay (n = 5 of biological replicates for Ctrl and n = 6 for mito-DAMP-treated groups, results are representative of two independent experiments with similar results). c Pro-fibrogenic gene expression of pro-collagen α1(I), TGFβ1, and TIMP-1 quantified by QRT-PCR (n = 3 of biological replicates, results are representative of two independent experiments with similar results). d DNA microgel image showing complete mtDNA degradation following pre-incubation with DNase I as described in “Methods.” Fibrogenic activation of HSCs by mito-DAMPs (7.5 μg/ml) is significantly attenuated by mtDNA depletion, as assessed via e α-SMA immunofluorescence (bar, 10 μm; images are representative of two independent experiments), f cell proliferation (MTT assay, blue line indicates mean values, p values as indicated via ANOVA with Tukey’s post test, n = 12 biological replicates derived from two independent experiments), and g pro-fibrogenic gene expression of pro-collagen α1(I), TGFβ1, and TIMP-1 (% to intact mito-DAMP-treated controls, two-tailed p values indicated, unpaired t test, n = 6 of biological replicates derived from two independent experiments performed in triplicates). Data are expressed as means ± SEM. *P < 0.05; **p < 0.01; and ***p < 0.001 compared to vehicle-treated controls (one-way ANOVA, followed by Dunnett’s post test). Source data are provided as a Source Data file.
Fig. 7
Fig. 7. Circulating mito-DAMP levels are elevated in patients with NASH in association with histologically significant hepatic fibrosis.
Characteristics of the healthy human subjects and treatment-naive patients with biopsy-proven NAFLD/NASH are summarized in Table 1. a Serum levels of mtDNA are markedly elevated in the sera of patients with NAFLD/NASH (cohort I, n = 27) compared to healthy subjects (n = 11). Increased mtDNA levels in relation to histological NAFLD/NASH disease activity (b) and fibrosis (c) (cohort II, n = 114). mtDNA (D-loop region) was quantified by real-time TaqMan PCR in total DNA isolated from serum as described in “Methods” (dot-plot depict individual values, bar shows group average, two-tailed p value indicated, unpaired t test). Source data are provided as a Source Data file.

References

    1. Poynard T, Bedossa P, Opolon P. Natural history of liver fibrosis progression in patients with chronic hepatitis C. The OBSVIRC, METAVIR, CLINIVIR, and DOSVIRC groups. Lancet. 1997;349:825–832. doi: 10.1016/S0140-6736(96)07642-8. - DOI - PubMed
    1. Hillebrandt S, Goos C, Matern S, Lammert F. Genome-wide analysis of hepatic fibrosis in inbred mice identifies the susceptibility locus Hfib1 on chromosome 15. Gastroenterology. 2002;123:2041–2051. doi: 10.1053/gast.2002.37069. - DOI - PubMed
    1. Shi Z, Wakil AE, Rockey DC. Strain-specific differences in mouse hepatic wound healing are mediated by divergent T helper cytokine responses. Proc. Natl Acad. Sci. USA. 1997;94:10663–10668. doi: 10.1073/pnas.94.20.10663. - DOI - PMC - PubMed
    1. Friedman SL. Evolving challenges in hepatic fibrosis. Nat. Rev. Gastroenterol. Hepatol. 2010;7:425–436. doi: 10.1038/nrgastro.2010.97. - DOI - PubMed
    1. Hillebrandt S, et al. Complement factor 5 is a quantitative trait gene that modifies liver fibrogenesis in mice and humans. Nat. Genet. 2005;37:835–843. doi: 10.1038/ng1599. - DOI - PubMed

Publication types

MeSH terms