. 2020 Oct;30(10):902-913.
doi: 10.1038/s41422-020-0333-6. Epub 2020 May 12.

Whole-genome sequencing of 508 patients identifies key molecular features associated with poor prognosis in esophageal squamous cell carcinoma

Affiliations

Whole-genome sequencing of 508 patients identifies key molecular features associated with poor prognosis in esophageal squamous cell carcinoma

Yongping Cui et al. Cell Res. 2020 Oct.

Erratum in

Abstract

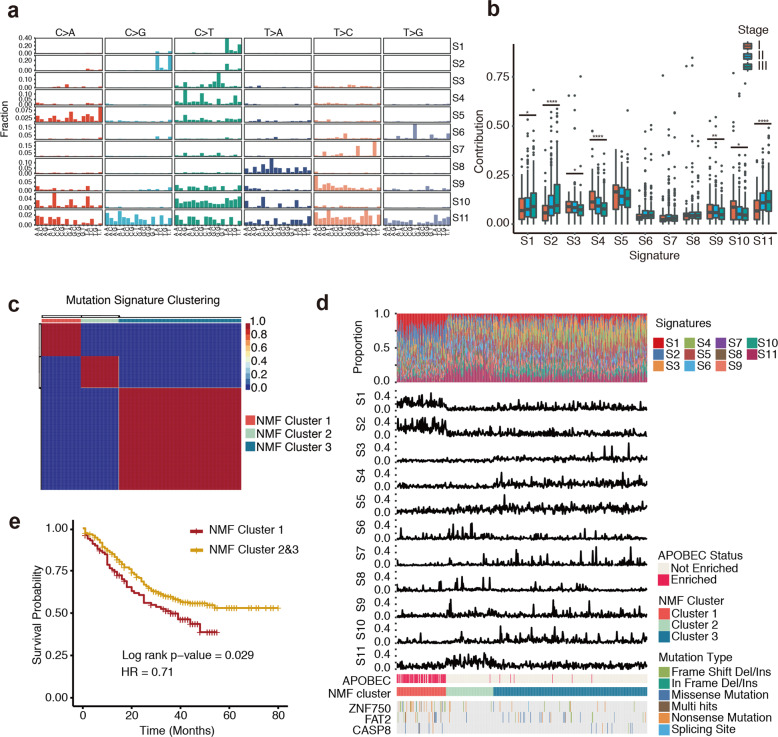
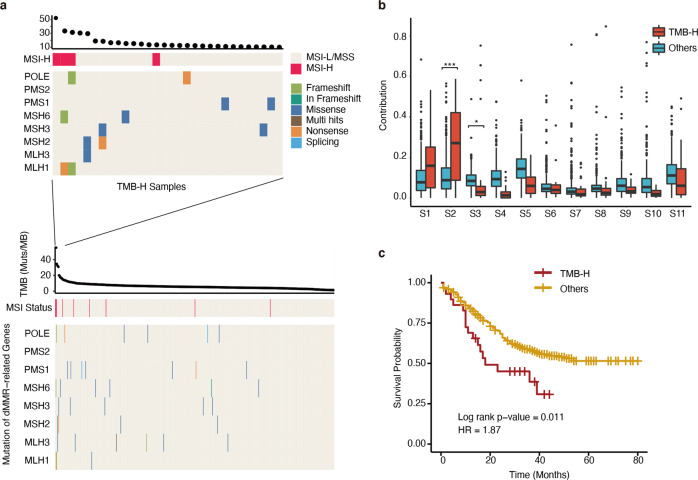
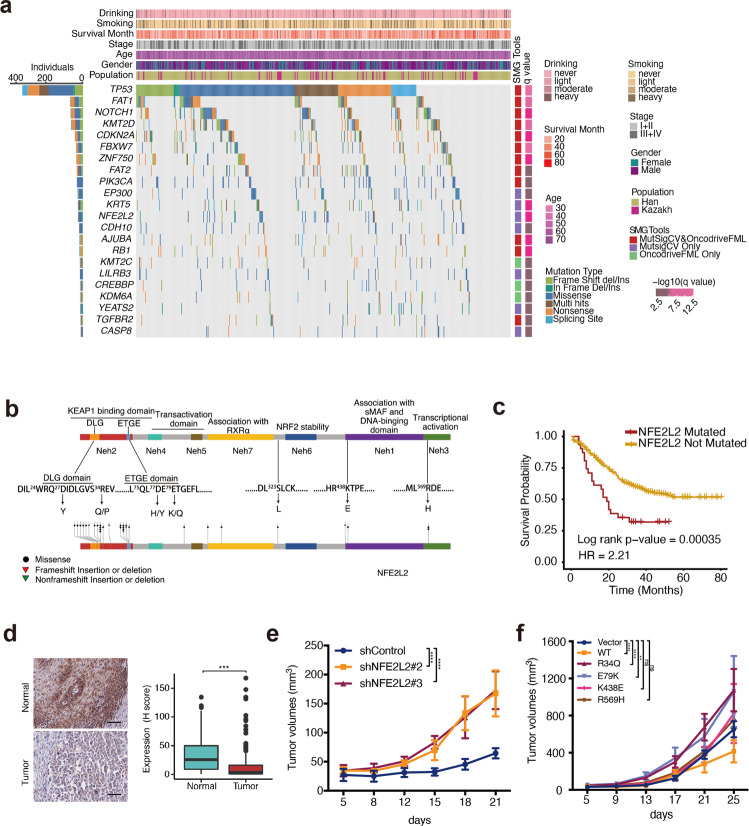
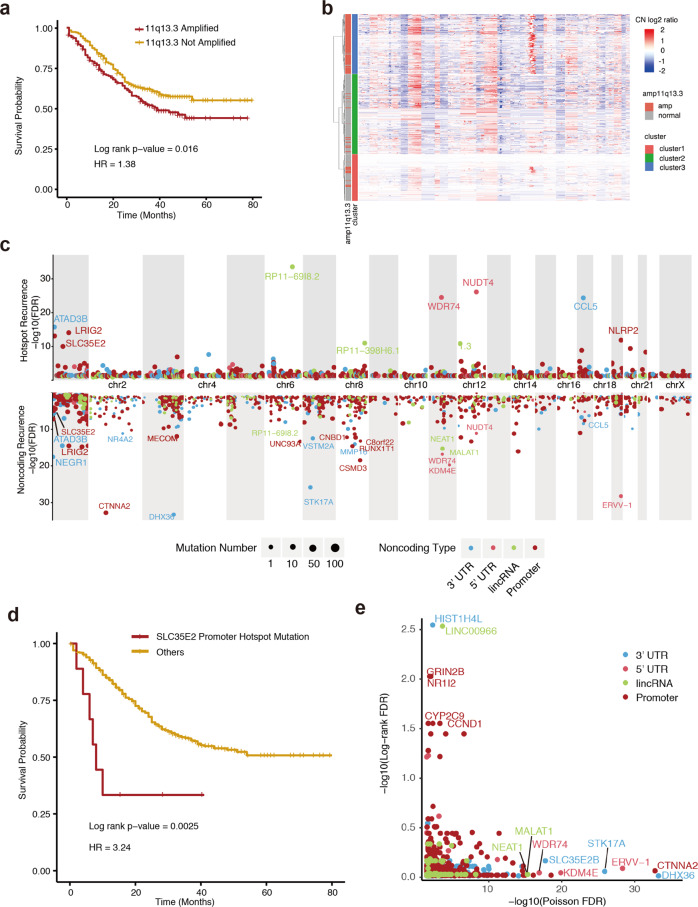
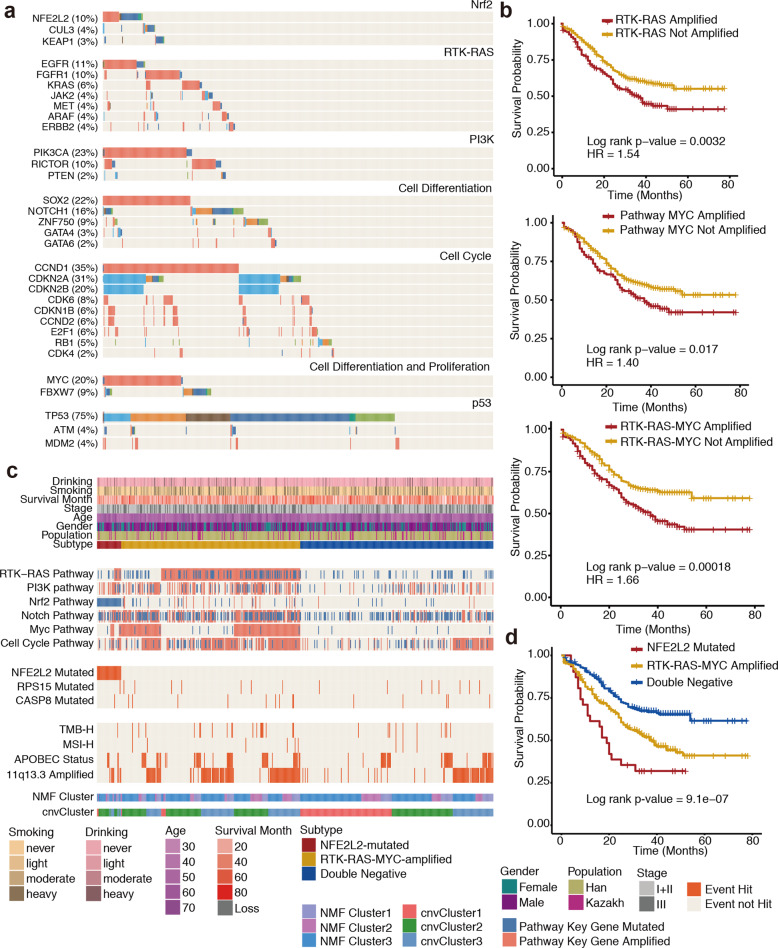
Esophageal squamous cell carcinoma (ESCC) is a poor-prognosis cancer type with limited understanding of its molecular etiology. Using 508 ESCC genomes, we identified five novel significantly mutated genes and uncovered mutational signature clusters associated with metastasis and patients' outcomes. Several functional assays implicated that NFE2L2 may act as a tumor suppressor in ESCC and that mutations in NFE2L2 probably impaired its tumor-suppressive function, or even conferred oncogenic activities. Additionally, we found that the NFE2L2 mutations were significantly associated with worse prognosis of ESCC. We also identified potential noncoding driver mutations including hotspot mutations in the promoter region of SLC35E2 that were correlated with worse survival. Approximately 5.9% and 15.2% of patients had high tumor mutation burden or actionable mutations, respectively, and may benefit from immunotherapy or targeted therapies. We found clinically relevant coding and noncoding genomic alterations and revealed three major subtypes that robustly predicted patients' outcomes. Collectively, we report the largest dataset of genomic profiling of ESCC useful for developing ESCC-specific biomarkers for diagnosis and treatment.


Conflict of interest statement

The authors declare no competing interests.

Figures

Fig. 1
Fig. 1. Profile of mutational signatures in 508 ESCC patients.
a Eleven mutation signatures detected in ESCC (S1−S11). b Boxplots of the contributions of 11 mutation signatures in tumors at different stages. *P < 0.05, **P < 0.01, ***P < 0.001. c Three clusters identified by NMF. d Upper, proportions of somatic mutations in 11 mutation signatures for each individual. Lower, status of APOBEC enrichment, signature clusters and somatic mutations in ZNF750, FAT2 and CASP8. e Kaplan–Meier curve of cluster 1 and cluster 2&3.
Fig. 2
Fig. 2. TMB and MSI analyses.
a The upper panel and lower panel are for the TMB-H patients and all patients, respectively. Each panel shows TMB, MSI-H status, and somatic mutation status in MMR-related genes, respectively. Patients are ordered decreasingly by their TMB values. b The contributions of 11 mutation signatures in TMB-H tumors and other tumors. *P < 0.05, ***P < 0.001. c Kaplan–Meier curve of TMB-H patients and other patients.
Fig. 3
Fig. 3. Mutational landscape of somatic alterations across 508 ESCC genomes and oncogenic mutations of NFE2L2 identified from SMGs.
a SMGs identified by MutSigCV and OncodriveFML with q value < 0.1. Rows are genes and columns are tumor samples. The patients’ phenotypic information is shown in the upper panel. The right panel shows the significance of each SMG. b Somatic mutations affecting NFE2L2. c Kaplan–Meier curve of NFE2L2-mutated and nonmutated samples. d Representative images (left) and statistical analysis (right) of IHC for NFE2L2. Scale bars, 50 μm. e Tumor volumes of NFE2L2 shRNA and control KYSE450 cells. n = 6 mice per group. f Tumor volumes of NFE2L2-wt, mutant, and the corresponding control KYSE150 cells. n = 6 mice per group. Data in (df) represent mean ± SD. Data were analyzed by unpaired two-tailed Student’s t-test (d) or two-way ANOVA with Bonferroni correction (e, f). ns no significant, **P < 0.01, ***P < 0.001, ****P < 0.0001.
Fig. 4
Fig. 4. CNA profiling and noncoding mutations.
a Kaplan–Meier curve of 11q13.3-amplified samples and others. b Hierarchical clustering of tumors based on log2 ratio of copy number. Rows represent tumors and columns are genomic positions. The patients are grouped into three clusters. Amplifications are marked by red and deletions are marked by blue. c The significance of noncoding hotspot mutations (upper) and frequent mutated noncoding elements (lower). The y-axes are the log10 FDRs. Circle size represents the number of mutations. d Kaplan−Meier curve of patients with or without mutations at the SLC35E2 promoter region. e Scatter plot of the significance of mutation frequencies in noncoding elements given by the Poisson model (x-axis) against the significance of the noncoding mutations with prognosis given by the log rank test (y-axis).
Fig. 5
Fig. 5. Genomic alterations in actionable targets and cancer pathways, and an integrative model of the alterations.
a Copy number alterations and nonsilent somatic mutations of key genes in five cancer pathways. Genes are ordered by alteration frequency. Wide bars represent the amplifications (red) and deletions (blue) while narrow bars represent various types of somatic mutations. b Kaplan−Meier curves of RTK-RAS amplification (upper), MYC amplification (middle) and RTK-RAS-MYC amplification (lower). c Integrative profiling of multiple genomic alterations in 508 patients. d Kaplan−Meier curve of the NFE2L2-mutated, RTK-RAS-MYC-amplified and double-negative ESCC subtypes.

References

    1. Bray F, et al. Global cancer statistics 2018: GLOBOCAN estimates of incidence and mortality worldwide for 36 cancers in 185 countries. CA Cancer J. Clin. 2018;68:394–424. - PubMed
    1. Chen W, et al. Cancer statistics in China, 2015. CA Cancer J. Clin. 2016;66:115–132. - PubMed
    1. Lin Y, et al. Esophageal cancer in high-risk areas of China: research progress and challenges. Ann. Epidemiol. 2017;27:215–221. - PubMed
    1. Lin DC, Wang MR, Koeffler HP. Genomic and epigenomic aberrations in esophageal squamous cell carcinoma and implications for patients. Gastroenterology. 2018;154:374–389. - PMC - PubMed
    1. Gao YB, et al. Genetic landscape of esophageal squamous cell carcinoma. Nat. Genet. 2014;46:1097–1102. - PubMed

Publication types