. 2019 Oct 18:8:1775.
doi: 10.12688/f1000research.20715.2. eCollection 2019.

Prediction of cell position using single-cell transcriptomic data: an iterative procedure

Affiliations

Prediction of cell position using single-cell transcriptomic data: an iterative procedure

Andrés M Alonso et al. F1000Res. .

Abstract

Single-cell sequencing reveals cellular heterogeneity but not cell localization. However, by combining single-cell transcriptomic data with a reference atlas of a small set of genes, it would be possible to predict the position of individual cells and reconstruct the spatial expression profile of thousands of genes reported in the single-cell study. With the purpose of developing new algorithms, the Dialogue for Reverse Engineering Assessments and Methods (DREAM) consortium organized a crowd-sourced competition known as DREAM Single Cell Transcriptomics Challenge (SCTC). Within this context, we describe here our proposed procedures for adequate reference genes selection, and an iterative procedure to predict spatial expression profile of other genes.

Keywords: DREAM Challenge; Drosophila Embryo; Gene expression Patterns; Single-Cell RNA sequencing.


Conflict of interest statement

No competing interests were disclosed.

Figures

Figure 1.
Figure 1.. Performance of the gene selection procedure.
Histogram of the performance obtained with 20 genes selected at random (yellow).The performance obtained with the set of 20 genes selected by the proposed method is indicated with a black arrow.
Figure 2.
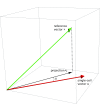
Figure 2.. Overlap-based score.
Low-dimensional representation of the angle between the expression vector u, and the projected expression vector v p.
Figure 3.
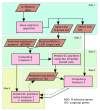
Figure 3.. Flow diagram of the proposed method.
Step 1: The set of N genes and the additional 100 outgroup genes are selected from the sc-RNAseq data. Step 2: Using the binarized expression data of the N selected genes we compute measure 1 for the1297 single-cell vectors against the 3039 binarized vectors of the reference atlas. Step 3: We predict the single-cell positions using the positions of the 10 better scored cells. Step 4: We build the putative expression patterns of the outgroup set of genes and we compute measure 2 against the expression level of 1297 single-cells. Step 5: By means of using the composed score S, the predicted expression patterns of the outgroup set of genes is improved in each iteration. The last two steps are repeated (2 or 3 times).
Figure 4.
Figure 4.. Prediction performance.
Panel A: Performance obtained by means of using the iterative procedure with 20 genes. Panel B: Predicted expression pattern of the ftz gene obtained with 60 genes after two iteration steps. The expression level of each nuclei is given in white-red scale. Gray nuclei correspond to positional bins without prediction.

References

    1. Battich N, Stoeger T, Pelkmans L: Image-based transcriptomics in thousands of single human cells at single-molecule resolution. Nat Methods. 2013;10(11):1127–33. 10.1038/nmeth.2657 - DOI - PubMed
    1. Shapiro E, Biezuner T, Linnarsson S: Single-cell sequencing-based technologies will revolutionize whole-organism science. Nat Rev Genet. 2013;14(9):618–30. 10.1038/nrg3542 - DOI - PubMed
    1. Sierant MC, Choi J: SingleSingle-Cell Ssequencing in Cancer: Recent Applications to Immunogenomics and Multi-omics Tools. Genomics Inform. 2018;16:e17. 10.5808/GI.2018.16.4.e17 - DOI - PMC - PubMed
    1. Durruthy-Durruthy R, Gottlieb A, Hartman BH, et al. : Reconstruction of the mouse otocyst and early neuroblast lineage at single-cell resolution. Cell. 2014;157(4):964–78. 10.1016/j.cell.2014.03.036 - DOI - PMC - PubMed
    1. Achim K, Pettit JB, Saraiva LR, et al. : High-throughput spatial mapping of single-cell RNA-seq data to tissue of origin. Nat Biotechnol. 2015;33(5):503–9. 10.1038/nbt.3209 - DOI - PubMed

LinkOut - more resources