. 2021 May;17(5):1205-1221.
doi: 10.1080/15548627.2020.1753002. Epub 2020 May 13.

Mitophagy deficiency increases NLRP3 to induce brown fat dysfunction in mice

Affiliations

Mitophagy deficiency increases NLRP3 to induce brown fat dysfunction in mice

Myoung Seok Ko et al. Autophagy. 2021 May.

Abstract

Although macroautophagy/autophagy deficiency causes degenerative diseases, the deletion of essential autophagy genes in adipocytes paradoxically reduces body weight. Brown adipose tissue (BAT) plays an important role in body weight regulation and metabolic control. However, the key cellular mechanisms that maintain BAT function remain poorly understood. in this study, we showed that global or brown adipocyte-specific deletion of pink1, a Parkinson disease-related gene involved in selective mitochondrial autophagy (mitophagy), induced BAT dysfunction, and obesity-prone type in mice. Defective mitochondrial function is among the upstream signals that activate the NLRP3 inflammasome. NLRP3 was induced in brown adipocyte precursors (BAPs) from pink1 knockout (KO) mice. Unexpectedly, NLRP3 induction did not induce canonical inflammasome activity. Instead, NLRP3 induction led to the differentiation of pink1 KO BAPs into white-like adipocytes by increasing the expression of white adipocyte-specific genes and repressing the expression of brown adipocyte-specific genes. nlrp3 deletion in pink1 knockout mice reversed BAT dysfunction. Conversely, adipose tissue-specific atg7 KO mice showed significantly lower expression of Nlrp3 in their BAT. Overall, our data suggest that the role of mitophagy is different from general autophagy in regulating adipose tissue and whole-body energy metabolism. Our results uncovered a new mitochondria-NLRP3 pathway that induces BAT dysfunction. The ability of the nlrp3 knockouts to rescue BAT dysfunction suggests the transcriptional function of NLRP3 as an unexpected, but a quite specific therapeutic target for obesity-related metabolic diseases.Abbreviations: ACTB: actin, beta; BAPs: brown adipocyte precursors; BAT: brown adipose tissue; BMDMs: bone marrow-derived macrophages; CASP1: caspase 1; CEBPA: CCAAT/enhancer binding protein (C/EBP), alpha; ChIP: chromatin immunoprecipitation; EE: energy expenditure; HFD: high-fat diet; IL1B: interleukin 1 beta; ITT: insulin tolerance test; KO: knockout; LPS: lipopolysaccharide; NLRP3: NLR family, pyrin domain containing 3; PINK1: PTEN induced putative kinase 1; PRKN: parkin RBR E3 ubiquitin protein ligase; RD: regular diet; ROS: reactive oxygen species; RT: room temperature; UCP1: uncoupling protein 1 (mitochondrial, proton carrier); WT: wild-type.

Keywords: Brown adipocyte; inflammasome; pink1; transcriptional activation; white adipocyte.


Conflict of interest statement

No potential conflict of interest was reported by the authors.

Figures

Figure 1.
Figure 1.
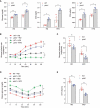
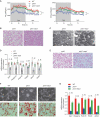
Decreased energy expenditure in pink1 KO mice. (A) Body weight of pink1 KO (pink1) mice and WT littermates fed RD or HFD (n = 13). (B) Average daily food intake per mouse (n = 13). (C-F) Decreased EE in pink1 KO mice. (C) O2 consumption and CO2 production (n = 8). (D) EE was calculated as (3.815 + 1.232 × RER) × VO2/lean mass (n = 8). (E) RER and (F) locomotor activity (n = 8). Data are presented as mean ± SEM. Student’s two-tailed unpaired t-test (D) or one-way repeated-measures ANOVA (A-C, E and F); **p < 0.01, ***p < 0.001
Figure 2.
Figure 2.
Insulin resistance in pink1 KO mice. (A) Fasting plasma glucose, INS, and free fatty acid (FFA) levels in pink1 KO mice (n = 6). (B) Glucose infusion rate (GIR) in the euglycemic hyperinsulinemic clamp studies (n = 7). (C) Mean GIR values from 80 to 120 min (n = 7). (D) ITT (n = 7). (E) Glucose disappearance rate for ITT (kITT; %/min) (n = 7). Data are presented as mean ± SEM. Student’s two-tailed unpaired t-test (A, C and E) or one-way repeated-measures ANOVA (B, D); *p < 0.05, **p < 0.01
Figure 3.
Figure 3.
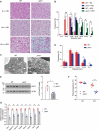
Brown fat dysfunction in pink1 KO mice. (A and B) H&E stained BAT sections. Scale bar: 50 µm (A). Average sizes of adipocytes in H&E sections of 16-weeks-old mice measured by ImageJ (B). For each mouse, 10 fields of H&E sections were randomly selected for analysis (n = 4). (C and D) Transmission electron micrographs of BAT revealing the ballooning of the mitochondrial matrix and disorganized mitochondrial cristae in pink1 KO mice (n = 4). Scale bar: 1 µm. (D) Morphometric analysis of TEM images performed with ImageJ on a sample of 10 randomly selected images from 4 mice. (E) Representative western blots of UCP1 protein in BAT from 3 independent experiments are shown (left panel). Equal amounts of protein (30 μg) were loaded in each lane, and the exposure times for detecting UCP1 and ACTB were both 30 s. See Fig. S3 for details. The intensities of UCP1 were quantified using the ImageJ software and compared with that of ACTB (right panel). (F) Core temperature in mice at RT and after exposure to 4°C for 6 h (n = 7). (G) mRNA expression of brown adipocyte-specific genes (n = 6). Data are presented as mean ± SEM. One-way ANOVA with Bonferroni correction for post hoc analysis (B) or Student’s two-tailed unpaired t-test (D-G). *p < 0.05, **p < 0.01, ***p < 0.001 vs WT; #p < 0.05, ##p < 0.01, ###p < 0.001 vs RD
Figure 4.
Figure 4.
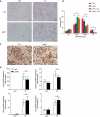
Effects of the ADRB3 agonist on thermogenic gene induction in inguinal WAT (iWAT). Eight-weeks-old male WT and pink1 KO mice received daily intraperitoneal injections of CL-316,243 (CL) for 3 d. (A) H&E staining of iWAT. Scale bar: 50 µm (n = 4). Average sizes of adipocytes in H&E sections of 16-weeks-old mice measured by ImageJ (B). For each mouse, 10 fields of H&E sections were randomly selected for analysis. (C) Immunohistochemical staining of UCP1-positive adipocytes. Arrows indicate UCP1 staining in the iWAT. Scale bar: 50 µm (n = 4). (D) Ucp1 and thermogenic gene expression (n = 6). Data are presented as mean ± SEM. One-way ANOVA with Bonferroni correction for post hoc analysis (B) or Student’s two-tailed unpaired t-test (D). *p < 0.05 versus CL-untreated mice, ns; not significant
Figure 5.
Figure 5.
BAPs of pink1 KO fail to differentiate into brown adipocytes. (A-C) BAPs obtained from the stromal vascular fraction of interscapular BAT of WT and pink1 KO mice were differentiated into brown adipocytes. After 7 d of differentiation, adipocytes were fixed, and the lipid droplets were stained with Oil Red O solution. (A) Phase-contrast fields. Scale bar: 50 µm (n = 4). (B and C) Oil-red O micrographs of differentiated brown adipocytes. Lipid droplet area was measured with ImageJ. For analysis, 10–12 fields in each slide were randomly selected. Scale bar: 10 µm (n = 4). (D and E) mRNA expression levels of brown adipocyte-specific genes (D) and white adipocyte-specific genes (E) in differentiated brown adipocytes (n = 6). (F) Estimation of mitophagy by mt-Keima method in WT and pink1 KO BAPs. The ratio of fluorescence intensity in mt-Keima staining (458 nm) and mitochondria fused with the lysosome (561 nm) was measured using ImageJ (n = 9). (G) Measurements of mitochondrial ROS by flow cytometry using mitochondrial superoxide probe MitoSox Red. Quantitative analysis of MitoSox Red fluorescence intensity (n = 5). Data are presented as mean ± SEM. Student’s two-tailed unpaired t-test (C-G). *p < 0.05, **p < 0.01, ***p < 0.001
Figure 6.
Figure 6.
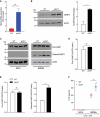
Increased NLRP3 expression in pink1 KO BAPs is not associated with inflammasome activation. (A) mRNA expression (n = 6) and (B) representative western blots of NLRP3 in the BAPs of WT and pink1 KO mice from 3 independent experiments are shown. Equal amounts of protein (10 μg) were loaded in each lane, and the exposure times for detecting NLRP3 and ACTB were both 2 min. See Fig. S5A for details. The level of NLRP3 was quantified using the ImageJ software and compared with that of ACTB. (C) Immunoblot of cleaved-CASP1. LPS-primed (100 ng/ml for 4 h) BAPs and BMDMs from WT or pink1 KO mice were stimulated with ATP (5 mM for 30 min). Representative blots from 3 replicated independent experiments are shown. (D) Equal amounts of protein (10 μg) were loaded in each lane, and the exposure times for detecting CASP1 and ACTB in BAPs were 5 min and 2 min, respectively. See Fig. S5B and S5D for details. (E) The exposure times for detecting pro-CASP1, cleaved-CASP1, and ACTB in BMDMs were 30 s, 30 min, and 30 s, respectively. See Fig. S5 C and S5E for details. (F) ELISA measurement of IL1B levels of supernatants after LPS and ATP treatment (n = 6). Data are presented as mean ± SEM. Student’s two-tailed unpaired t-test; *p < 0.05, **p < 0.01, ***p < 0.001, ns; not significant
Figure 7.
Figure 7.
Increased Nlrp3 in BAPs from pink1 KO mice transcriptionally activates white adipocyte-like differentiation. (A and B) Binding of NLRP3 to the promoter regions of Cebpa. ChIP assay was performed to assess the NLRP3 binding sites in the nt −374 to −365 region of the Cebpa promoter. Four independent experiments were performed. Undifferentiated BAPs or 5 d post-differentiation BAPs were used in the ChIP assay. (C and D) Effect of overexpression of Nlrp3 in WT BAPs on the expression of Nlrp3, white adipocyte- (C), and brown adipocyte-specific markers (D). BAPs were transfected with a lentivirus carrying Nlrp3 or control vector (Con) and harvested 7 d after differentiation (n = 6). (E-H) Rescue of mitophagy by overexpression of Pink1 in pink1 KO BAPs. pink1 KO BAPs were transfected with lentiviruses for pink1 (pink1-Pink1) or control vector (pink1-Con). (E) Estimation of mitophagy by mt-Keima method. The ratio of fluorescence intensity in mt-Keima staining (458 nm) and mitochondria fused with the lysosome (561 nm) was measured using ImageJ (n = 4). (F-H) mRNA expressions of Nlrp3 (F), white adipocyte markers (G) and brown adipocyte (H) (n = 6). Data are presented as mean ± SEM. Student’s two-tailed unpaired t-test (B-E); *p < 0.05, ***p < 0.001. One-way ANOVA with Bonferroni correction for post hoc analysis (F-H); *p < 0.05, **p < 0.01 vs WT BAPs; #p < 0.05 vs pink1 KO BAPs
Figure 8.
Figure 8.
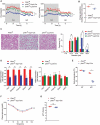
BAT changes in pink1 KO mice are reversed in the pink/nlrp3 double-KO mice. (A-D) Eight-week-old male mice in each group were fed RD for 8 weeks. Gas exchange (A), H&E staining of BAT in pink1 nlrp3 double-KO mice (pink1 nlrp3) (n = 4). Scale bar: 50 µm (B), and representative transmission electron micrograph of BAT from pink1 KO and pink1 nlrp3 double-KO mice (n = 4). Bar: 1 µm (C). mRNA expression of BAT-specific genes in the BAT (n = 6) (D). (E) H&E staining of BAT in pink1 casp1 double-KO (pink1 casp1) mice (n = 4). Scale bar: 50 µm. Data are presented as mean ± SEM. One-way repeated-measures ANOVA with Bonferroni correction for post hoc analysis (A) or one-way ANOVA with Bonferroni correction for post hoc analysis (D); **p < 0.01, ***p < 0.001 vs. WT; ##p < 0.01 vs. pink1 KO mice. (F and G) Reversal of defective differentiation to mature brown adipocytes in pink1 nlrp3 KO BAPs. (F) Phase-contrast microscopy (top) and Oil-Red O (down) images were showing the reversal of morphologic changes in differentiated brown adipocytes obtained from pink1 nlrp3 double-KO mice (n = 4). After 7 d of differentiation, images were obtained. Scale bar: 5 µm (phase-contrast) and 50 µm (Oil-Red O). (G) mRNA expression of BAT markers in the BAPs (n = 6). Data are presented as mean ± SEM. One-way ANOVA with Bonferroni correction for post hoc analysis. **p < 0.01 vs WT BAPs; ##p < 0.01 vs pink1 KO BAPs
Figure 9.
Figure 9.
Pink1 deficiency in brown adipocytes is sufficient to induce brown fat dysfunction. (A) O2 consumption and CO2 production in brown fat-specific (pink1 f/f-Ucp1-Cre) or myeloid cell-specific (pink1 f/f-Lyz2-Cre) pink1 KO mice (n = 4). (B) EE in pink1 f/f-Ucp1-Cre pink1 KO mice and Pink1 f/f mice (n = 4). (C) H&E staining of BAT. Scale bar: 50 µm (n = 4). (D) mRNA expression levels of brown fat-specific genes (n = 4). (E) Core temperature in pink1 f/f-Ucp1-Cre pink1 KO mice and Pink1 f/f mice at RT and after exposure to 4°C for 6 h (n = 4). (F and G) ITT (F) and glucose disappearance rate for ITT (kITT; %/min) (G) in pink1 f/f-Ucp1-Cre pink1 KO mice (n = 5). Data are presented as mean ± SEM. One-way repeated-measures ANOVA (A and F), or One-way ANOVA with Bonferroni correction for post hoc analysis (C) or Student’s two-tailed unpaired t-test (B, D, E and G); *p < 0.05, **p < 0.01, ***p < 0.001 vs Pink1 f/f, #p < 0.05, ##p < 0.01 vs pink1 f/f-Ucp1-Cre; ns, not significant

References

    1. Cypess AM, Lehman S, Williams G, et al. Identification and importance of brown adipose tissue in adult humans. N Engl J Med. 2009;360(15):1509–1517. . PMID:19357406 - PMC - PubMed
    1. Peirce V, Carobbio S, Vidal-Puig A.. The different shades of fat. Nature. 2014;510(7503):76–83. . PMID:24899307 - PubMed
    1. Lowell BB, Spiegelman BM. Towards a molecular understanding of adaptive thermogenesis. Nature. 2000;404(6778):652–660. . PMID:10766252 - PubMed
    1. Cypess AM, White AP, Vernochet C, et al. Anatomical localization, gene expression profiling and functional characterization of adult human neck brown fat. Nat Med. 2013;19(5):635–639. . PMID:23603815 - PMC - PubMed
    1. Harms M, Seale P. Brown and beige fat: development, function and therapeutic potential. Nat Med. 2013;19(10):1252–1263. . PMID:24100998 - PubMed

Publication types

MeSH terms

Substances