

Lateralization of epilepsy using intra-hemispheric brain networks based on resting-state MEG data
- PMID: 32400923
- PMCID: PMC7336137
- DOI: 10.1002/hbm.24990
Lateralization of epilepsy using intra-hemispheric brain networks based on resting-state MEG data
Abstract
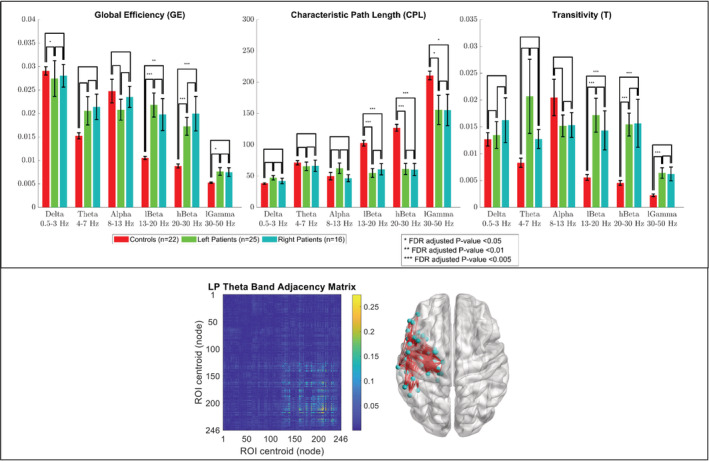
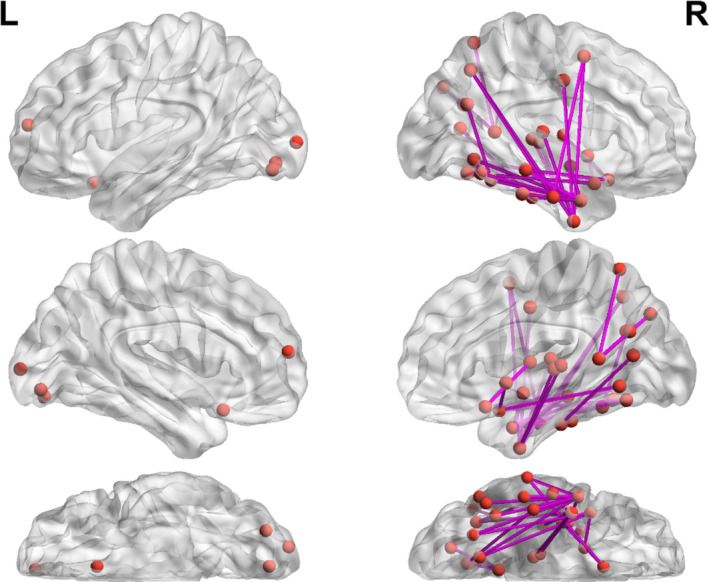
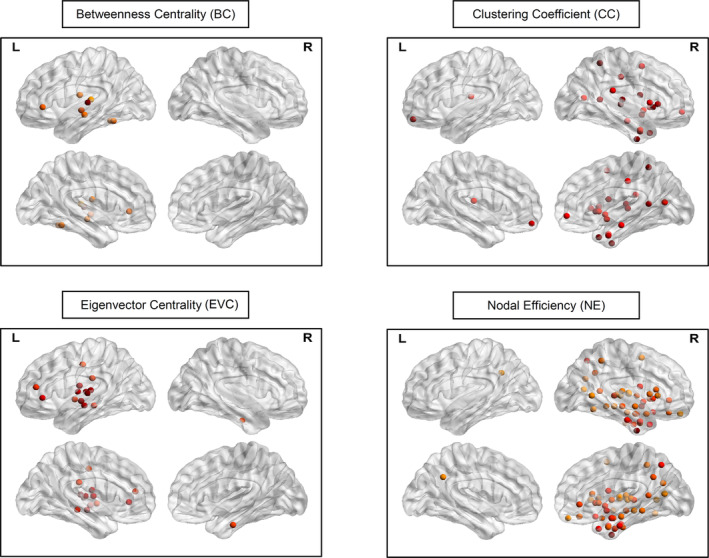
Focal epilepsy originates within networks in one hemisphere. However, previous studies have investigated network topologies for the entire brain. In this study, magnetoencephalography (MEG) was used to investigate functional intra-hemispheric networks of healthy controls (HCs) and patients with left- or right-hemispheric temporal lobe or temporal plus extra-temporal lobe epilepsy. 22 HCs, 25 left patients (LPs), and 16 right patients (RPs) were enrolled. The debiased weighted phase lag index was used to calculate functional connectivity between 246 brain regions in six frequency bands. Global efficiency, characteristic path length, and transitivity were computed for left and right intra-hemispheric networks. The right global graph measures (GGMs) in the theta band were significantly different (p < .005) between RPs and both LPs and HCs. Right and left GGMs in higher frequency bands were significantly different (p < .05) between HCs and the patients. Right GGMs were used as input features of a Naïve-Bayes classifier to classify LPs and RPs (78.0% accuracy) and all three groups (75.5% accuracy). The complete theta band brain networks were compared between LPs and RPs with network-based statistics (NBS) and with the clustering coefficient (CC), nodal efficiency (NE), betweenness centrality (BC), and eigenvector centrality (EVC). NBS identified a subnetwork primarily composed of right intra-hemispheric connections. Significantly different (p < .05) nodes were primarily in the right hemisphere for the CC and NE and primarily in the left hemisphere for the BC and EVC. These results indicate that intra-hemispheric MEG networks may be incorporated in the diagnosis and lateralization of focal epilepsy.
Keywords: focal epilepsy; functional connectivity; graph measures; intra-hemispheric brain networks; machine learning; magnetoencephalography; network-based statistics.
© 2020 The Authors. Human Brain Mapping published by Wiley Periodicals, Inc.
Conflict of interest statement
The authors declare no conflict of interest.
Figures


Similar articles
-
What graph theory actually tells us about resting state interictal MEG epileptic activity.Neuroimage Clin. 2015 May 23;8:503-15. doi: 10.1016/j.nicl.2015.05.008. eCollection 2015. Neuroimage Clin. 2015. PMID: 26106575 Free PMC article.
-
Frequency-band specific directed connectivity networks reveal functional disruptions and pathogenic patterns in temporal lobe epilepsy: a MEG study.Sci Rep. 2025 Apr 10;15(1):12326. doi: 10.1038/s41598-025-90299-3. Sci Rep. 2025. PMID: 40210922 Free PMC article.
-
Large-scale cortico-subcortical functional networks in focal epilepsies: The role of the basal ganglia.Neuroimage Clin. 2016 Dec 18;14:28-36. doi: 10.1016/j.nicl.2016.12.014. eCollection 2017. Neuroimage Clin. 2016. PMID: 28123951 Free PMC article.
-
Non-invasive brain mapping in epilepsy: Applications from magnetoencephalography.J Neurosci Methods. 2016 Feb 15;260:283-91. doi: 10.1016/j.jneumeth.2015.11.012. Epub 2015 Nov 28. J Neurosci Methods. 2016. PMID: 26642968 Review.
-
Magnetoencephalography in focal epilepsy.Epilepsia. 2000;41 Suppl 3:S39-47. doi: 10.1111/j.1528-1157.2000.tb01533.x. Epilepsia. 2000. PMID: 11001335 Review.
Cited by
-
Dynamic evolution of frontal-temporal network connectivity in temporal lobe epilepsy: A magnetoencephalography study.Hum Brain Mapp. 2024 Oct;45(14):e70033. doi: 10.1002/hbm.70033. Hum Brain Mapp. 2024. PMID: 39319686 Free PMC article.
-
MEG abnormalities and mechanisms of surgical failure in neocortical epilepsy.Epilepsia. 2023 Mar;64(3):692-704. doi: 10.1111/epi.17503. Epub 2023 Jan 24. Epilepsia. 2023. PMID: 36617392 Free PMC article.
-
Hub overload and failure as a final common pathway in neurological brain network disorders.Netw Neurosci. 2024 Apr 1;8(1):1-23. doi: 10.1162/netn_a_00339. eCollection 2024. Netw Neurosci. 2024. PMID: 38562292 Free PMC article. Review.
-
Genetic fingerprinting with heritable phenotypes of the resting-state brain network topology.Commun Biol. 2024 Sep 30;7(1):1221. doi: 10.1038/s42003-024-06807-0. Commun Biol. 2024. PMID: 39349968 Free PMC article.
-
MEG Node Degree for Focus Localization: Comparison with Invasive EEG.Biomedicines. 2023 Feb 2;11(2):438. doi: 10.3390/biomedicines11020438. Biomedicines. 2023. PMID: 36830974 Free PMC article.
References
-
- Benjamini, Y. , & Hochberg, Y. (1995). Controlling the false discovery rate ‐ A practical and powerful approach to multiple testing. Journal of the Royal Statistical Society, Series B: Statistical Methodology, 57, 289–300. 10.2307/2346101 - DOI
-
- Berg, A. T. , Berkovic, S. F. , Brodie, M. J. , Buchhalter, J. , Cross, J. H. , van Emde Boas, W. , … Scheffer, I. E. (2010). Revised terminology and concepts for organization of seizures and epilepsies: Report of the ILAE commission on classification and terminology, 2005‐2009. Epilepsia, 51(4), 676–685. 10.1111/j.1528-1167.2010.02522.x - DOI - PubMed
-
- Boccaletti, S. , Latora, V. , Moreno, Y. , Chavez, M. , & Hwang, D. U. (2006). Complex networks: Structure and dynamics. Physics Reports‐Review Section of Physics Letters, 424(4–5), 175–308. 10.1016/j.physrep.2005.10.009 - DOI
-
- Bonacich, P. (1972). Factoring and weighting approaches to status scores and clique identification. The Journal of Mathematical Sociology, 2(1), 113–120. 10.1080/0022250X.1972.9989806 - DOI
MeSH terms
LinkOut - more resources
Full Text Sources
Research Materials
Miscellaneous
