. 2020 May 13;18(5):e3000705.
doi: 10.1371/journal.pbio.3000705. eCollection 2020 May.

Vascularized human cortical organoids (vOrganoids) model cortical development in vivo

Affiliations

Vascularized human cortical organoids (vOrganoids) model cortical development in vivo

Yingchao Shi et al. PLoS Biol. .

Abstract

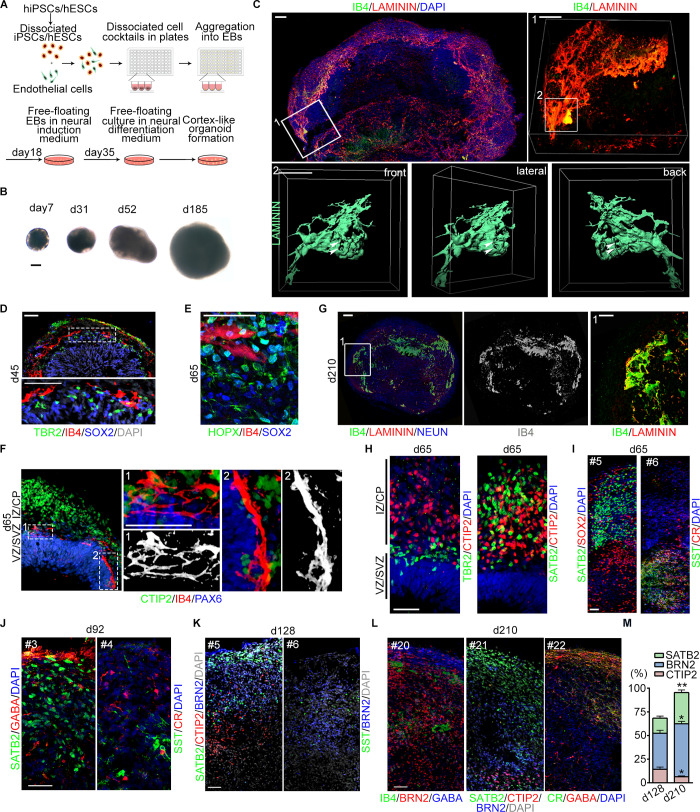
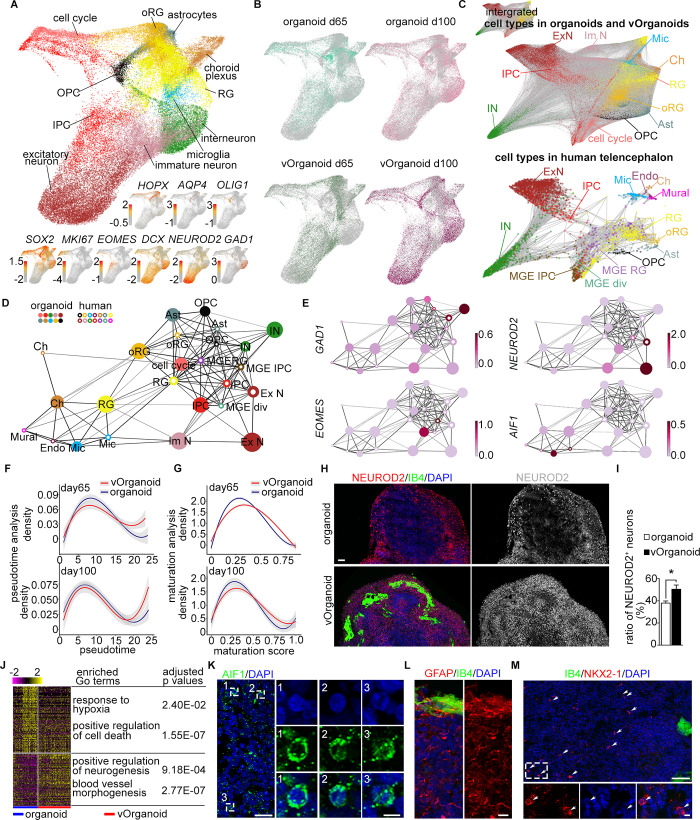
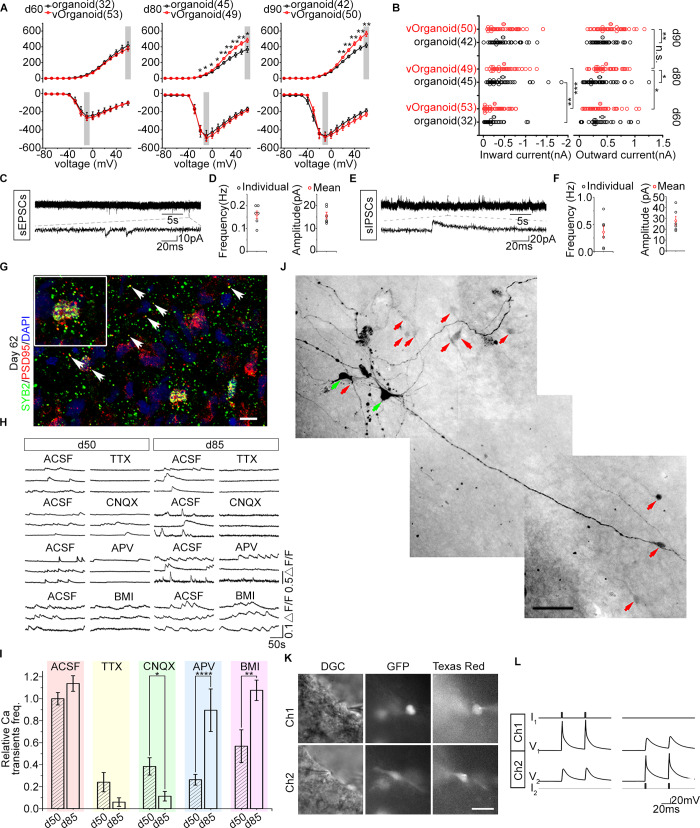
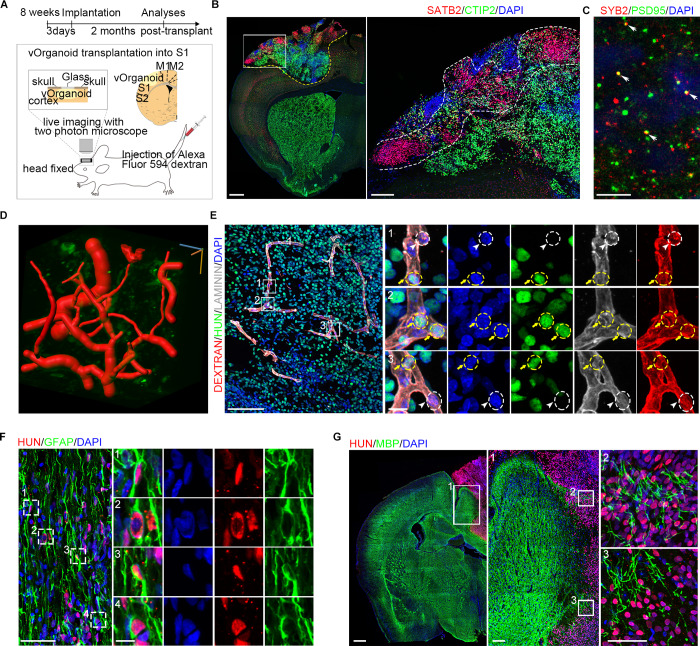
Modeling the processes of neuronal progenitor proliferation and differentiation to produce mature cortical neuron subtypes is essential for the study of human brain development and the search for potential cell therapies. We demonstrated a novel paradigm for the generation of vascularized organoids (vOrganoids) consisting of typical human cortical cell types and a vascular structure for over 200 days as a vascularized and functional brain organoid model. The observation of spontaneous excitatory postsynaptic currents (sEPSCs), spontaneous inhibitory postsynaptic currents (sIPSCs), and bidirectional electrical transmission indicated the presence of chemical and electrical synapses in vOrganoids. More importantly, single-cell RNA-sequencing analysis illustrated that vOrganoids exhibited robust neurogenesis and that cells of vOrganoids differentially expressed genes (DEGs) related to blood vessel morphogenesis. The transplantation of vOrganoids into the mouse S1 cortex resulted in the construction of functional human-mouse blood vessels in the grafts that promoted cell survival in the grafts. This vOrganoid culture method could not only serve as a model to study human cortical development and explore brain disease pathology but also provide potential prospects for new cell therapies for nervous system disorders and injury.


Conflict of interest statement

The authors have declared that no competing interests exist.

Figures

Fig 1
Fig 1. Cerebral vOrganoids with vascular system recapitulate the cortical spatial organization.
(A) Schematic diagram of the 3D culture methods for generating cerebral organoids with complicate vascular systems. (B) Representative bright field (BF) images of vOrganoids at different stages. Scale bar, 200 μm. (C) Whole mount imaging of vOrganoid on day 42. The elaborate mesh-like vascular systems in vOrganoids were displayed by immunofluorescence staining for LAMININ and IB4. Areas 1 and 2 outlined in boxes were magnified and reconstructed in 3D to depict the complexity of vasculature in vOrganoids. Scale bar, 100 μm (upper left), 50 μm (in box 1), 50 μm (in box 2). The arrowheads pointed out the hollows in the vascular systems that are permeable at different views. (D) Representative immunofluorescence staining figure for TBR2, SOX2, and IB4 to reveal that the vasculogenesis in vOrganoids is synchronous to the neurogenesis at early stage. Scale bar, 50 μm. (E) Representative immunofluorescence staining figure for HOPX, SOX2, and IB4 to demonstrate that the HOPX+ SOX2+oRG cells could be detected in the vOrganoids at day 65. Scale bar, 50 μm. (F) Representative immunofluorescence staining figure for CTIP2/IB4/PAX6 at day 65 to demonstrate that the IB4+ vascular structures would progressively extend into newborn neurons (CTIP2+) with the development of vOrganoids. Scale bar, 50 μm. (G) Representative IB4 and LAMININ staining figure in vOrganoid at day 210 to demonstrate that the vascular system could be maintained for over 200 days. Scale bars, 100 μm. (H) The spatial organization of vOrganoids was illustrated by immunofluorescence staining for TBR2/CTIP2 (left panel) and SATB2/CTIP2 (right panel) at day 65. Scale bar, 50 μm. (I) Representative immunofluorescence staining figure for the SATB2 and SOX2 to illustrate that SATB2+ cells are mainly located above the SOX2+ progenitor cells (left panel); SST and CR staining illustrated the emergence of interneurons in vOrganoids at day 65 (right panel). The “#5” and “#6” labelled in the upper left represent the number of continuous sections of vOrganoids. Scale bars, 50 μm. (J-L) Representative immunostaining figure for the pyramidal layer markers and interneuron markers in the continuous cryosections of vOrganoids at day 92 (J), day 128 (K), and day 210 (L). Scale bars, 50 μm. (M) The percentage of SATB2+, BRN2+, and CTIP2+ cells in the vOrganoids of day 128 and day 210, respectively. n = 3 organoids from three independent experiments. All data are presented as means ± SEM, independent-samples t test, *p < 0.05, **p < 0.01. The numerical data underlying this figure can be found in the Fig 1M sheet of S1 Data. BRN2, POU class 3 homeobox 2; CR, calretinin; CTIP2, chicken ovalbumin upstream promoter transcription factor (COUP-TF)–interacting protein 2; EB, embryonic body; hESC, human embryonic stem cell; hiPSC, human-induced pluripotent stem cell; HOPX, homeodomain only protein X; IB4, isolectin I-B4; iPSC, induced pluripotent stem cells; oRG, outer radial glia; PAX6, paired box 6; SATB2, SATB homeobox 2; SOX2, SRY-box transcription factor 2; SST, somatostatin; TBR2, eomesodermin; vOrganoid, vascularized organoid.
Fig 2
Fig 2. Cell type mapping between the scRNA-seq data of organoids and human fetal telencephalon.
(A) Visualization of the major cell types in organoids and vOrganoids by 3D UMAP. Each dot represents one individual cell and colored by cell types. The expression of known gene markers was visualized at the lower panel and cells were colored by the expression level (red, high; gray, low). (B) The cell distributions of control organoids and vOrganoids at d65 and d100, respectively, were individually showed using UMAP. Each dot represents one individual cell and colored by sample information. (C) The scRNA-seq data of organoids and human fetal telencephalon were integrated to display the cell similarities in forced-directed graph. The integrated data were showed in the top left zoomed-out plot. Meanwhile, the cell distributions of organoids and human fetal telencephalon were highlighted separately. Each dot represents a single cell and is colored according to the cell types in the integrated data. The width of edges is scaled with cell–cell connectivity. (D) The correlations among cell types are displayed in the PAGA graph. The cell types in the organoids and human fetal cortex datasets were denoted by the solid and hollow dots, respectively. And the same cell types in two datasets were colored identically. The size of dots was scaled with the cell numbers; width of edges was scaled with the connectivity between cell types. (E) The expression of the well-known gene markers in different cell types is showed in the PAGA plots. The GAD1, NEUROD2, EOMES, and AIF1 are the specific genes for interneuron, excitatory neurons, IPCs, and microglia, respectively. Nodes are colored according to the gene expression levels (light pink, low; dark red, high). (F) The fitted curves of cell density along the pseudo-time at day 65 (upper) and day 100 (lower) The shadow represents the confidence interval around the fitted curve. (G) The curves of cell density along the pseudo-maturation trajectory at day 65 (upper) and day 100 (lower). The shadow represents the confidence interval around the fitted curve. (H) Immunofluorescence staining for NEUROD2/IB4 in the control organoids and vOrganoids at day 65. The expressions of NEUROD2 are individually displayed in the right panel. Scale bar, 100 μm. (I) The ratio of NEUROD2+ excitatory neurons is higher in the vOrganoids than in the control organoids at day 65. n = 4, 4 control organoids and vOrganoids from three independent experiments. (J) Heatmap showing the expression of DEGs between the progenitor cells (included RG, oRG, cell cycle active cells, and IPCs) of control organoids and vOrganoids at day 65. The enriched gene ontology of the DEGs and the adjusted p-values are also listed. (K) Representative immunofluorescence staining figure for AIF1, a specific microglia marker, to illustrate the presence of microglia in organoids. Scale bar, 10 μm (left), 5 μm (right). (L) Immunofluorescence staining for GFAP to illustrate the presence of astrocytes in organoids. Scale bar, 10 μm. (M) A few of NKX2-1–positive cells are detected in the immunofluorescence staining section. The area in the white dashed box is magnified in the lower panel. Scale bar, 200 μm (upper), 20 μm (lower). The numerical as well as metadata underlying this figure can be found in the Fig 2A, 2B, 2C and 2I sheets of S1 Data. AIF1, allograft inflammatory factor 1; Ast, astrocyte; cell cycle, cell cycle active cell; Ch, choroid plexus; DEG, differentially expressed gene; Endo, endothelial cell; EOMES, eomesodermin; ExN, excitatory neuron; GAD1, glutamate decarboxylase 1; GFAP, glial fibrillary acidic protein; IB4, isolectin I-B4; ImN, immature neuron; IN, interneuron; IPC, intermediate progenitor cell; MGE, medial ganglionic eminence; MGE-div, MGE dividing cell; Mic, microglia; Mural, mural cell; NEUROD2, neuronal differentiation 2; NKX2-1, NK2 homeobox 1; OPC, oligodendrocytes progenitor cell; oRG, outer radial glia; PAGA, partition-based graph abstraction; RG, radial glia cell; scRNA-seq, single-cell RNA sequencing; UMAP, Uniform Mainfold Approximation and Projection; vOrganoid, vascularized organoid.
Fig 3
Fig 3. Electrophysiological properties of cells in the vOrganoids at different developmental stages.
(A) The amplitudes of outward (upper) and inward (lower) currents from the organoids (black) and vOrganoids (red) cells at day 60 (32 cells from 5 organoids in 4 independent experiments; 53 cells from 8 vOrganoids in 6 independent experiments), day 80 (45 cells from 6 organoids in 4 independent experiments; 49 cells from 6 vOrganoids in 4 independent experiments, p-values: 0.0428, 0.0278, 0.0222, 0.0171, 0.0085, 0.0066, 0.0072, 0.0099, and 0.0131 when evoked voltages are −20, −10, 0, 10, 20, 30, 40, 50, and 60 mV) and day 90 (42 cells from 6 organoids in 4 independent experiments; 50 cells from 6 vOrganoids in 5 independent experiments, p-values: 0.0090, 0.0027, 0.0033, 0.0025, and 0.0018 when evoked voltages are 20, 30, 40, 50, and 60 mV). Two-sample t test, data shown as mean ± SEM, *p < 0.05, **p < 0.01, ***p < 0.001. (B) The amplitudes of outward currents elicited by +60 mV (indicated by gray box in upper panel of A) and the amplitudes of inward currents elicited by −10 mV (indicated by gray box in lower panel of A) from organoid (black) and vOrganoid (red) cells at day 60, day 80, and day 90. Open circles indicate the amplitude of current from individual cells. Filled circles indicate the mean value. p-Values: 0.0108 (outward current of vOrganoid d60 versus d80), 0.0615 (outward current of vOrganoid d80 versus d90), 0.0131 (outward current at day 80 organoid versus vOrganoid), 0.0018 (outward current at day 90 organoid versus vOrganoid), 0.0066 (inward current of organoid d60 versus d80), 0.00001 (inward current of vOrganoid d60 versus d80). Two-sample t test, data shown as mean ± SEM, *p < 0.05, **p < 0.01, ***p < 0.001. (C-F) Spontaneous EPSCs (C) and IPSCs (E) were recorded in vOrganoids. The average frequency and amplitude of EPSCs and IPSCs are shown in (D) and (F), respectively. n = 6, 6 cells from 3 organoid and 3 vOrganoids in three independent experiments for sEPSCs (D) and sIPSCs (F), respectively. (G) Synapses in vOrganoids are revealed by immunofluorescence staining for the pre- and postsynaptic markers, SYB2 and PSD95, respectively. Scale bar, 10 μm. (H) Intracellular spontaneous calcium fluctuations were measured before and after the application of TTX, CNQX, APV, and BMI in the vOrganoids at day 50 and day 85, respectively. (I) The effects of different treatments on spontaneous calcium fluctuations were compared between day 50 and day 85 in the statistical results. Relative Ca2+ transient frequencies are normalized with the ACSF data of day 50. There are 188 and 124 cells in total for day 50 and day 85. All data are presented as means ± SEM. n = 188, 124, 31, 9, 65, 33, 77, 36, 15, and 46 from three independent experiments. Two-sample t test, p_ACSF = 0.1266, p_TTX = 0.2798, p_CNQX = 0.0208, p_APV = 0.00005, p_BMI = 0.0075. *p < 0.05, **p < 0.01, ***p < 0.001, ****p < 0.0001. (J) Coupling pattern was visualized by cell injection. Green arrows indicated the injected cells. Red arrows indicated the cells that were connected to the injected cells. Scale bar, 50 μm. (K-L) The gap junctions between two cells (CMV-GFP labeled) were identified by dual-patch recording. The morphology of cells that dual patched was showed in (K). Scale bar, 50 μm in (K). The voltage deflections with small amplitudes were recorded in one cell while currents were injected into the other cell (L). The numerical data underlying this figure can be found in the Fig 3A, 3B, 3D, 3F and 3I sheets of S1 Data. ACSF, artificial cerebral spinal fluid; APV, DL-2-Amino-5-phosphonopentanoic acid; BMI, bicuculline methiodide; CMV, cytomegalovirus; CNQX, 6-Cyano-7-nitroquinoxaline-2,3-dione; DGC, dodt gradient contrast; GFP, green fluorescent protein; PSD95, postsynaptic density protein-95; sEPSC, spontaneous excitatory postsynaptic current; sIPSC, spontaneous inhibitory postsynaptic current; SYB2, synaptobrevin 2; TTX, tetrodotoxin; vOrganoid, vascularized organoid.
Fig 4
Fig 4. The vOrganoids play important roles in the reconstruction of vascular system after transplantation.
(A) Schematic diagram to demonstrate the vOrganoids implantation protocols in our studies. The vOrganoids were transplanted into the S1 cortex of NOD-SCID mice. (B) Representative immunofluorescence staining figure for the classical cortical layer markers, CTIP2 and SATB2, at 2 months postimplantation. The boxed area was magnified in the right panel. Scale bar, 500 μm (left), 50 μm (right). (C) Representative immunofluorescence staining figure for presynaptic (SYB2) and postsynaptic (PSD95) in the vOrganoid grafts of 60 dpi. The displayed area was close to the graft–host border. The colocalization (arrowheads) and close association of SYB2 and PSD95 indicate that synaptic connectivity emerges in the organoid grafts. Scale bar, 10 μm. (D) The blood vessels in the vOrganoid grafts were reconstructed in three dimensions. The red tubular structure was blood vessels. Scale bar was labeled at three dimensions. Scale bar, 30 μm. (E) Immunofluorescence staining for LAMININ, dextran, and HUN were performed to confirm that the human ECs derived from vOrganoids (labeled by yellow circles and yellow arrows) and the mice ECs derived from hosts (labeled by white circles and white arrowheads) were both detected in the vascular systems in the vOrganoid grafts. Scale bar, 100 μm (left), 10 μm (right). (F) Representative immunofluorescence staining figure for GFAP and HUN in the vOrganoid grafts. A few HUN-positive astrocytes were labeled by boxes and magnified in right panels. Scale bar, 50 μm (left), 10 μm (right). (G) Representative immunofluorescence staining figure for MBP and HUN to illustrate that myelinization just could be infrequently observed at the border of graft-host commissure. The boxed areas were magnified. Scale bar, 500 μm (left), 100 μm (middle), 50 μm (right). See also S4 Fig. CTIP2, chicken ovalbumin upstream promoter transcription factor (COUP-TF)–interacting protein 2; dpi, days postimplantation; GFAP, glial fibrillary acidic protein; HUN, human nuclear; MBP, myelin basic protein; NOD-SCID, nonobese diabetic severe combined immunodeficient; PSD95, postsynaptic density protein-95; SATB2, SATB homeobox 2; SYB2, synaptobrevin 2; vOrganoid, vascularized organoid.

Comment in

References

    1. Kriegstein A, Noctor S, Martinez-Cerdeno V. Patterns of neural stem and progenitor cell division may underlie evolutionary cortical expansion. Nat Rev Neurosci. 2006;7(11):883–890. 10.1038/nrn2008 - DOI - PubMed
    1. Rakic P. Evolution of the neocortex: a perspective from developmental biology. Nat Rev Neurosci. 2009;10(10):724–735. 10.1038/nrn2719 - DOI - PMC - PubMed
    1. Moreira L, Bakir B, Chatterji P, Dantes Z, Reichert M, Rustgi AK. Pancreas 3D Organoids:Current and Future Aspects as a Research Platform for Personalized Medicine in Pancreatic Cancer. Cell Mol Gastroenterol Hepatol. 2018;5(3):289–298. 10.1016/j.jcmgh.2017.12.004 - DOI - PMC - PubMed
    1. Takebe T, Sekine K, Enomura M, Koike H, Kimura M, Ogaeri T, et al. Vascularized and functional human liver from an iPSC-derived organ bud transplant. Nature. 2013;499(7459):481–484. 10.1038/nature12271 - DOI - PubMed
    1. Morizane R, Lam AQ, Freedman BS, Kishi S, Valerius MT, Bonventre JV. Nephron organoids derived from human pluripotent stem cells model kidney development and injury. Nat Biotechnol. 2015;33(11):1193–1200. 10.1038/nbt.3392 - DOI - PMC - PubMed

Publication types