

Quantitative High-Resolution Imaging of Live Microbial Cells at High Hydrostatic Pressure
- PMID: 32402241
- PMCID: PMC7264842
- DOI: 10.1016/j.bpj.2020.04.017
Quantitative High-Resolution Imaging of Live Microbial Cells at High Hydrostatic Pressure
Abstract
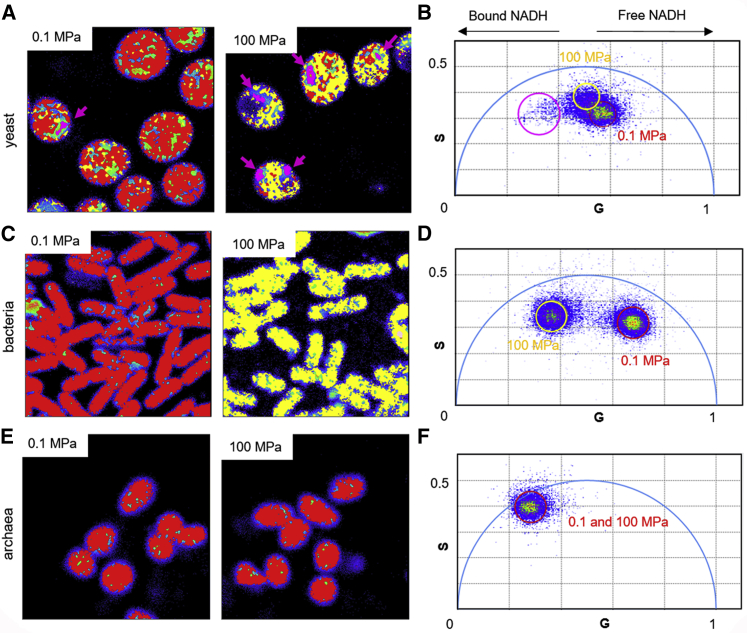
The majority of the Earth's microbial biomass exists in the deep biosphere, in the deep ocean, and within the Earth's crust. Although other physical parameters in these environments, such as temperature or pH, can differ substantially, they are all under high pressures. Beyond emerging genomic information, little is known about the molecular mechanisms underlying the ability of these organisms to survive and grow at pressures that can reach over 1000-fold the pressure on the Earth's surface. The mechanisms of pressure adaptation are also important in food safety, with the increasing use of high-pressure food processing. Advanced imaging represents an important tool for exploring microbial adaptation and response to environmental changes. Here, we describe implementation of a high-pressure sample chamber with a two-photon scanning microscope system, allowing for the first time, to our knowledge, quantitative high-resolution two-photon imaging at 100 MPa of living microbes from all three kingdoms of life. We adapted this setup for fluorescence lifetime imaging microscopy with phasor analysis (FLIM/Phasor) and investigated metabolic responses to pressure of live cells from mesophilic yeast and bacterial strains, as well as the piezophilic archaeon Archaeoglobus fulgidus. We also monitored by fluorescence intensity fluctuation-based methods (scanning number and brightness and raster scanning imaging correlation spectroscopy) the effect of pressure on the chromosome-associated protein HU and on the ParB partition protein in Escherichia coli, revealing partially reversible dissociation of ParB foci and concomitant nucleoid condensation. These results provide a proof of principle that quantitative, high-resolution imaging of live microbial cells can be carried out at pressures equivalent to those in the deepest ocean trenches.
Copyright © 2020 Biophysical Society. Published by Elsevier Inc. All rights reserved.
Figures


Similar articles
-
Rate and Extent of Growth of a Model Extremophile, Archaeoglobus fulgidus, Under High Hydrostatic Pressures.Front Microbiol. 2020 Jun 12;11:1023. doi: 10.3389/fmicb.2020.01023. eCollection 2020. Front Microbiol. 2020. PMID: 32595611 Free PMC article.
-
Pressure as an environmental parameter for microbial life--a review.Biophys Chem. 2013 Dec 15;183:30-41. doi: 10.1016/j.bpc.2013.06.019. Epub 2013 Jul 1. Biophys Chem. 2013. PMID: 23891571 Review.
-
Microorganisms under high pressure--adaptation, growth and biotechnological potential.Biotechnol Adv. 2013 Dec;31(8):1426-34. doi: 10.1016/j.biotechadv.2013.06.007. Epub 2013 Jul 3. Biotechnol Adv. 2013. PMID: 23831003 Review.
-
Cultivation of Piezotolerant and Piezophilic Hyperthermophiles with a Newly Developed Constant High Pressure and Temperature Culturing and Monitoring System.Microbes Environ. 2023;38(6):ME23055. doi: 10.1264/jsme2.ME23055. Microbes Environ. 2023. PMID: 37866887 Free PMC article.
-
Distinctive gene and protein characteristics of extremely piezophilic Colwellia.BMC Genomics. 2020 Oct 6;21(1):692. doi: 10.1186/s12864-020-07102-y. BMC Genomics. 2020. PMID: 33023469 Free PMC article.
Cited by
-
Matrix glycoconjugate characterization in multispecies biofilms and bioaggregates from the environment by means of fluorescently-labeled lectins.Front Microbiol. 2022 Aug 8;13:940280. doi: 10.3389/fmicb.2022.940280. eCollection 2022. Front Microbiol. 2022. PMID: 36003926 Free PMC article.
-
N-terminus GTPase domain of the cytoskeleton protein FtsZ plays a critical role in its adaptation to high hydrostatic pressure.Front Microbiol. 2024 Aug 16;15:1441398. doi: 10.3389/fmicb.2024.1441398. eCollection 2024. Front Microbiol. 2024. PMID: 39220037 Free PMC article.
-
High-pressure small-angle X-ray scattering cell for biological solutions and soft materials.J Appl Crystallogr. 2021 Feb 1;54(Pt 1):111-122. doi: 10.1107/S1600576720014752. eCollection 2021 Feb 1. J Appl Crystallogr. 2021. PMID: 33841059 Free PMC article.
-
Response and adaptation of the transcriptional heat shock response to pressure.Front Microbiol. 2024 Nov 18;15:1470617. doi: 10.3389/fmicb.2024.1470617. eCollection 2024. Front Microbiol. 2024. PMID: 39624728 Free PMC article.
-
Characterizing the Piezosphere: The Effects of Decompression on Microbial Growth Dynamics.Front Microbiol. 2022 May 17;13:867340. doi: 10.3389/fmicb.2022.867340. eCollection 2022. Front Microbiol. 2022. PMID: 35663870 Free PMC article.
References
-
- Duffy M. HPP keeps food safe, while extending shelf life. Food Safety Tech. 2018
Publication types
MeSH terms
Substances
LinkOut - more resources
Full Text Sources
Molecular Biology Databases
