. 2020 Jun 18;78(6):1133-1151.e14.
doi: 10.1016/j.molcel.2020.04.024. Epub 2020 May 12.

KAP1 Is a Chromatin Reader that Couples Steps of RNA Polymerase II Transcription to Sustain Oncogenic Programs

Affiliations

KAP1 Is a Chromatin Reader that Couples Steps of RNA Polymerase II Transcription to Sustain Oncogenic Programs

Curtis W Bacon et al. Mol Cell. .

Abstract

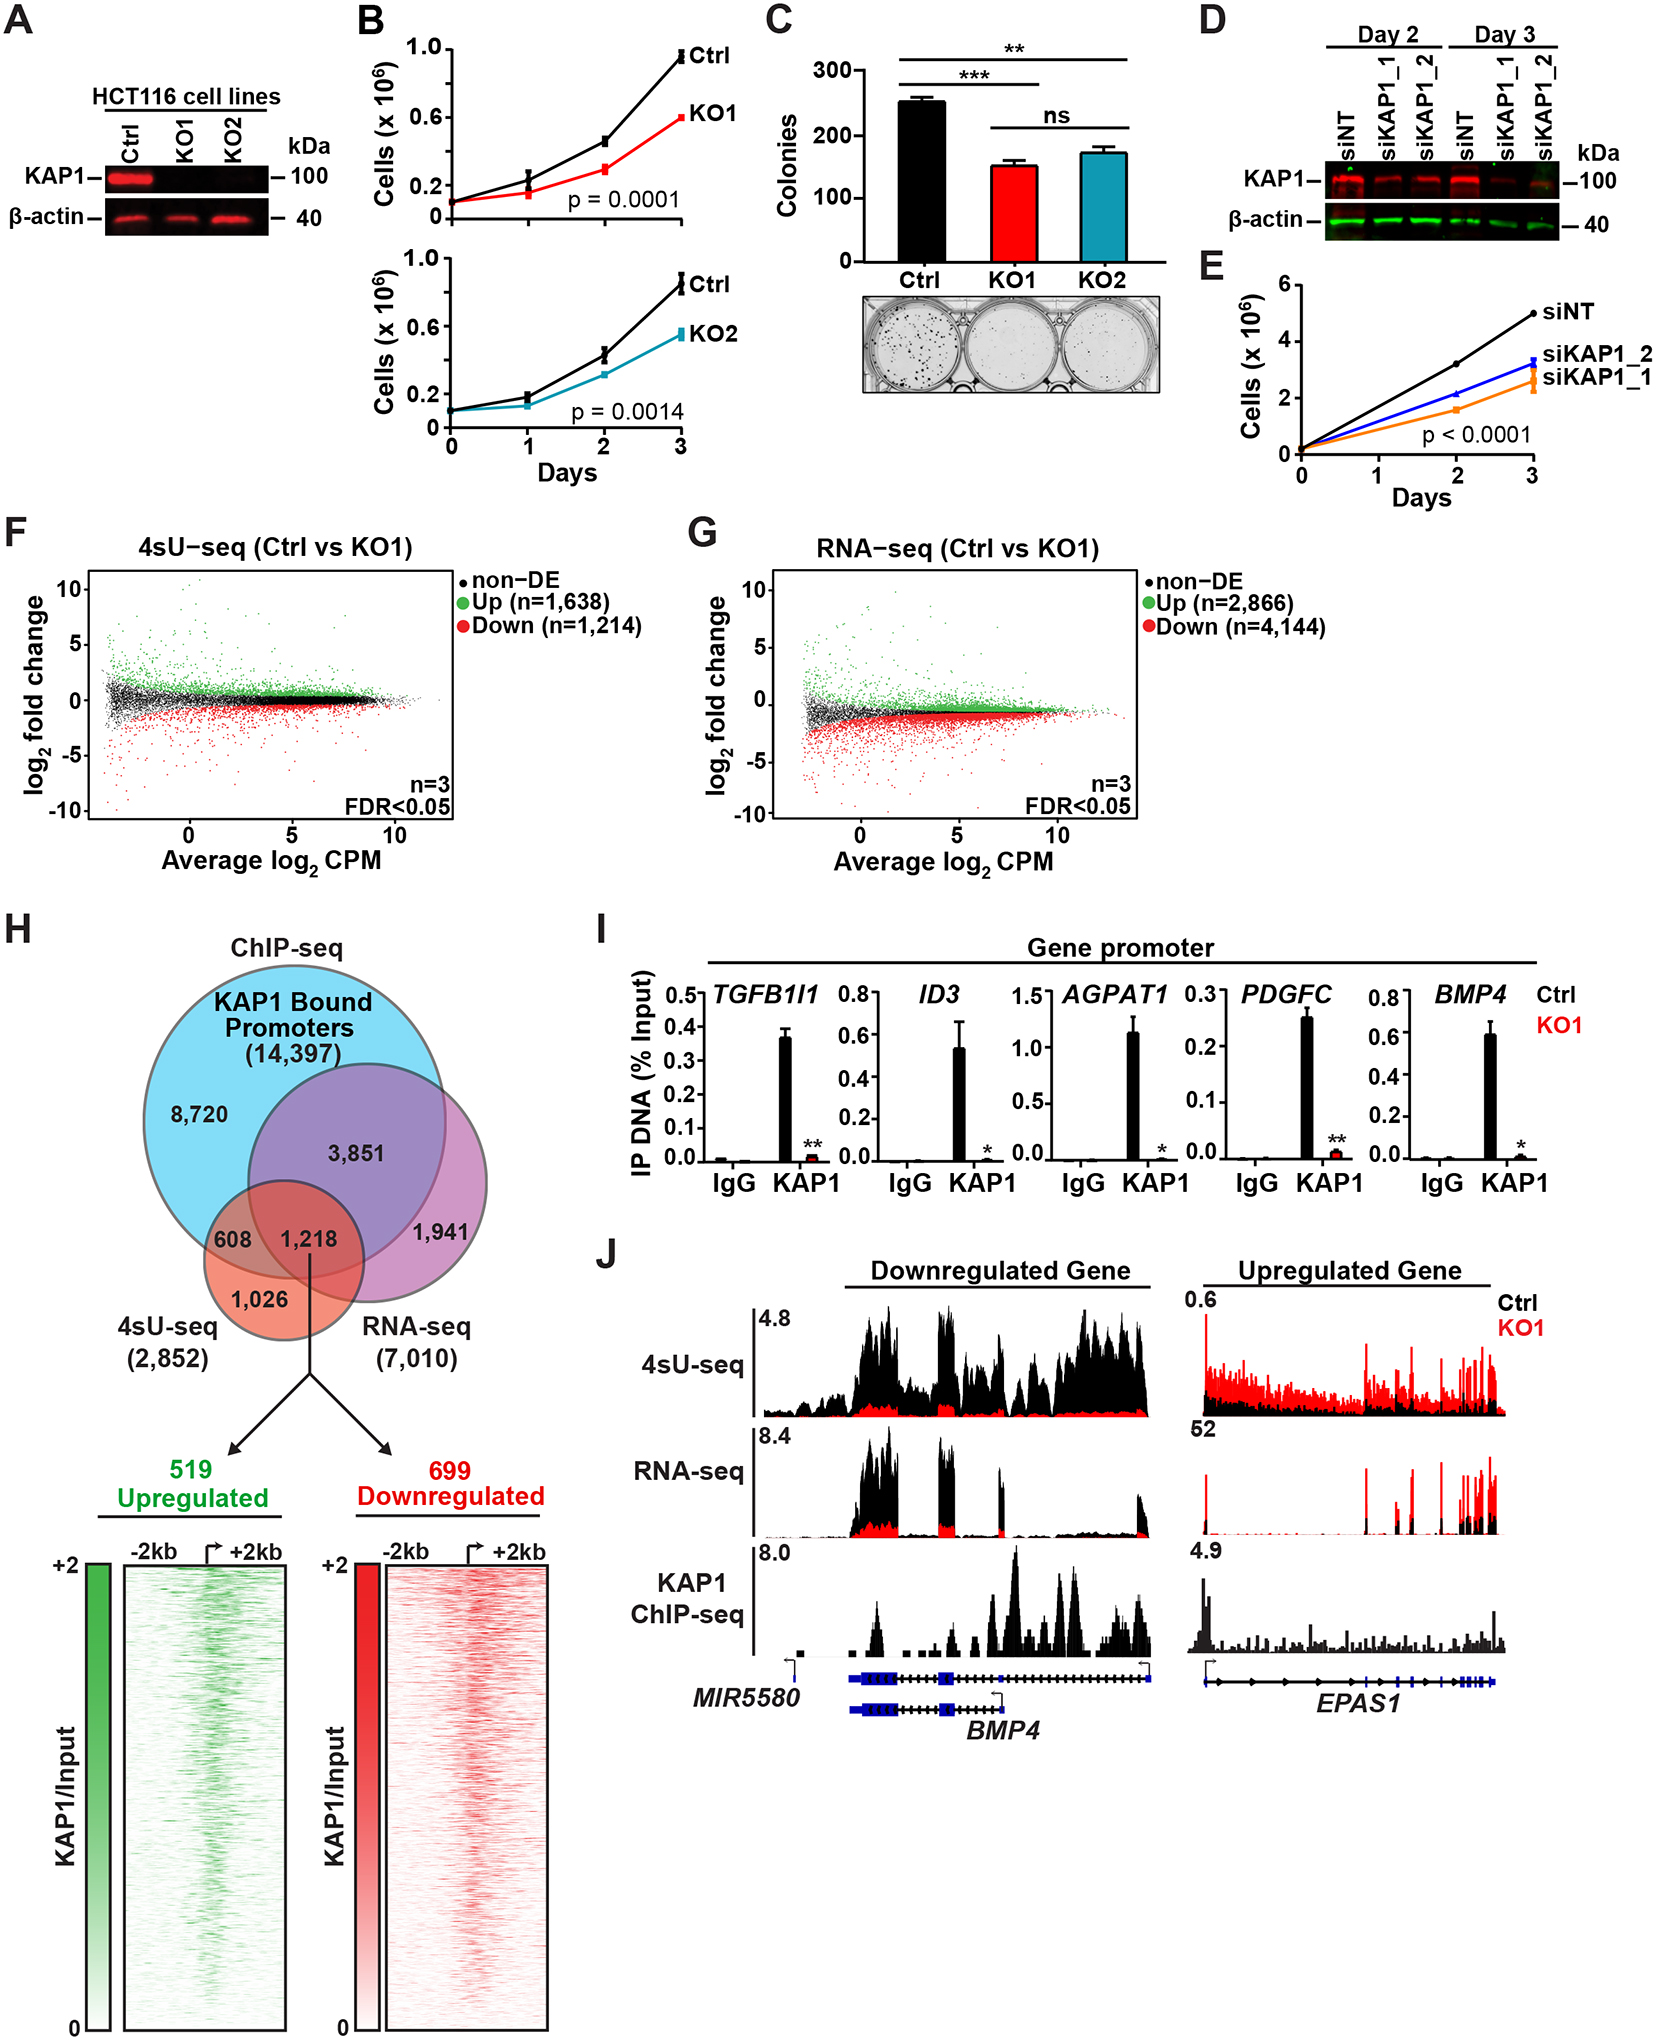
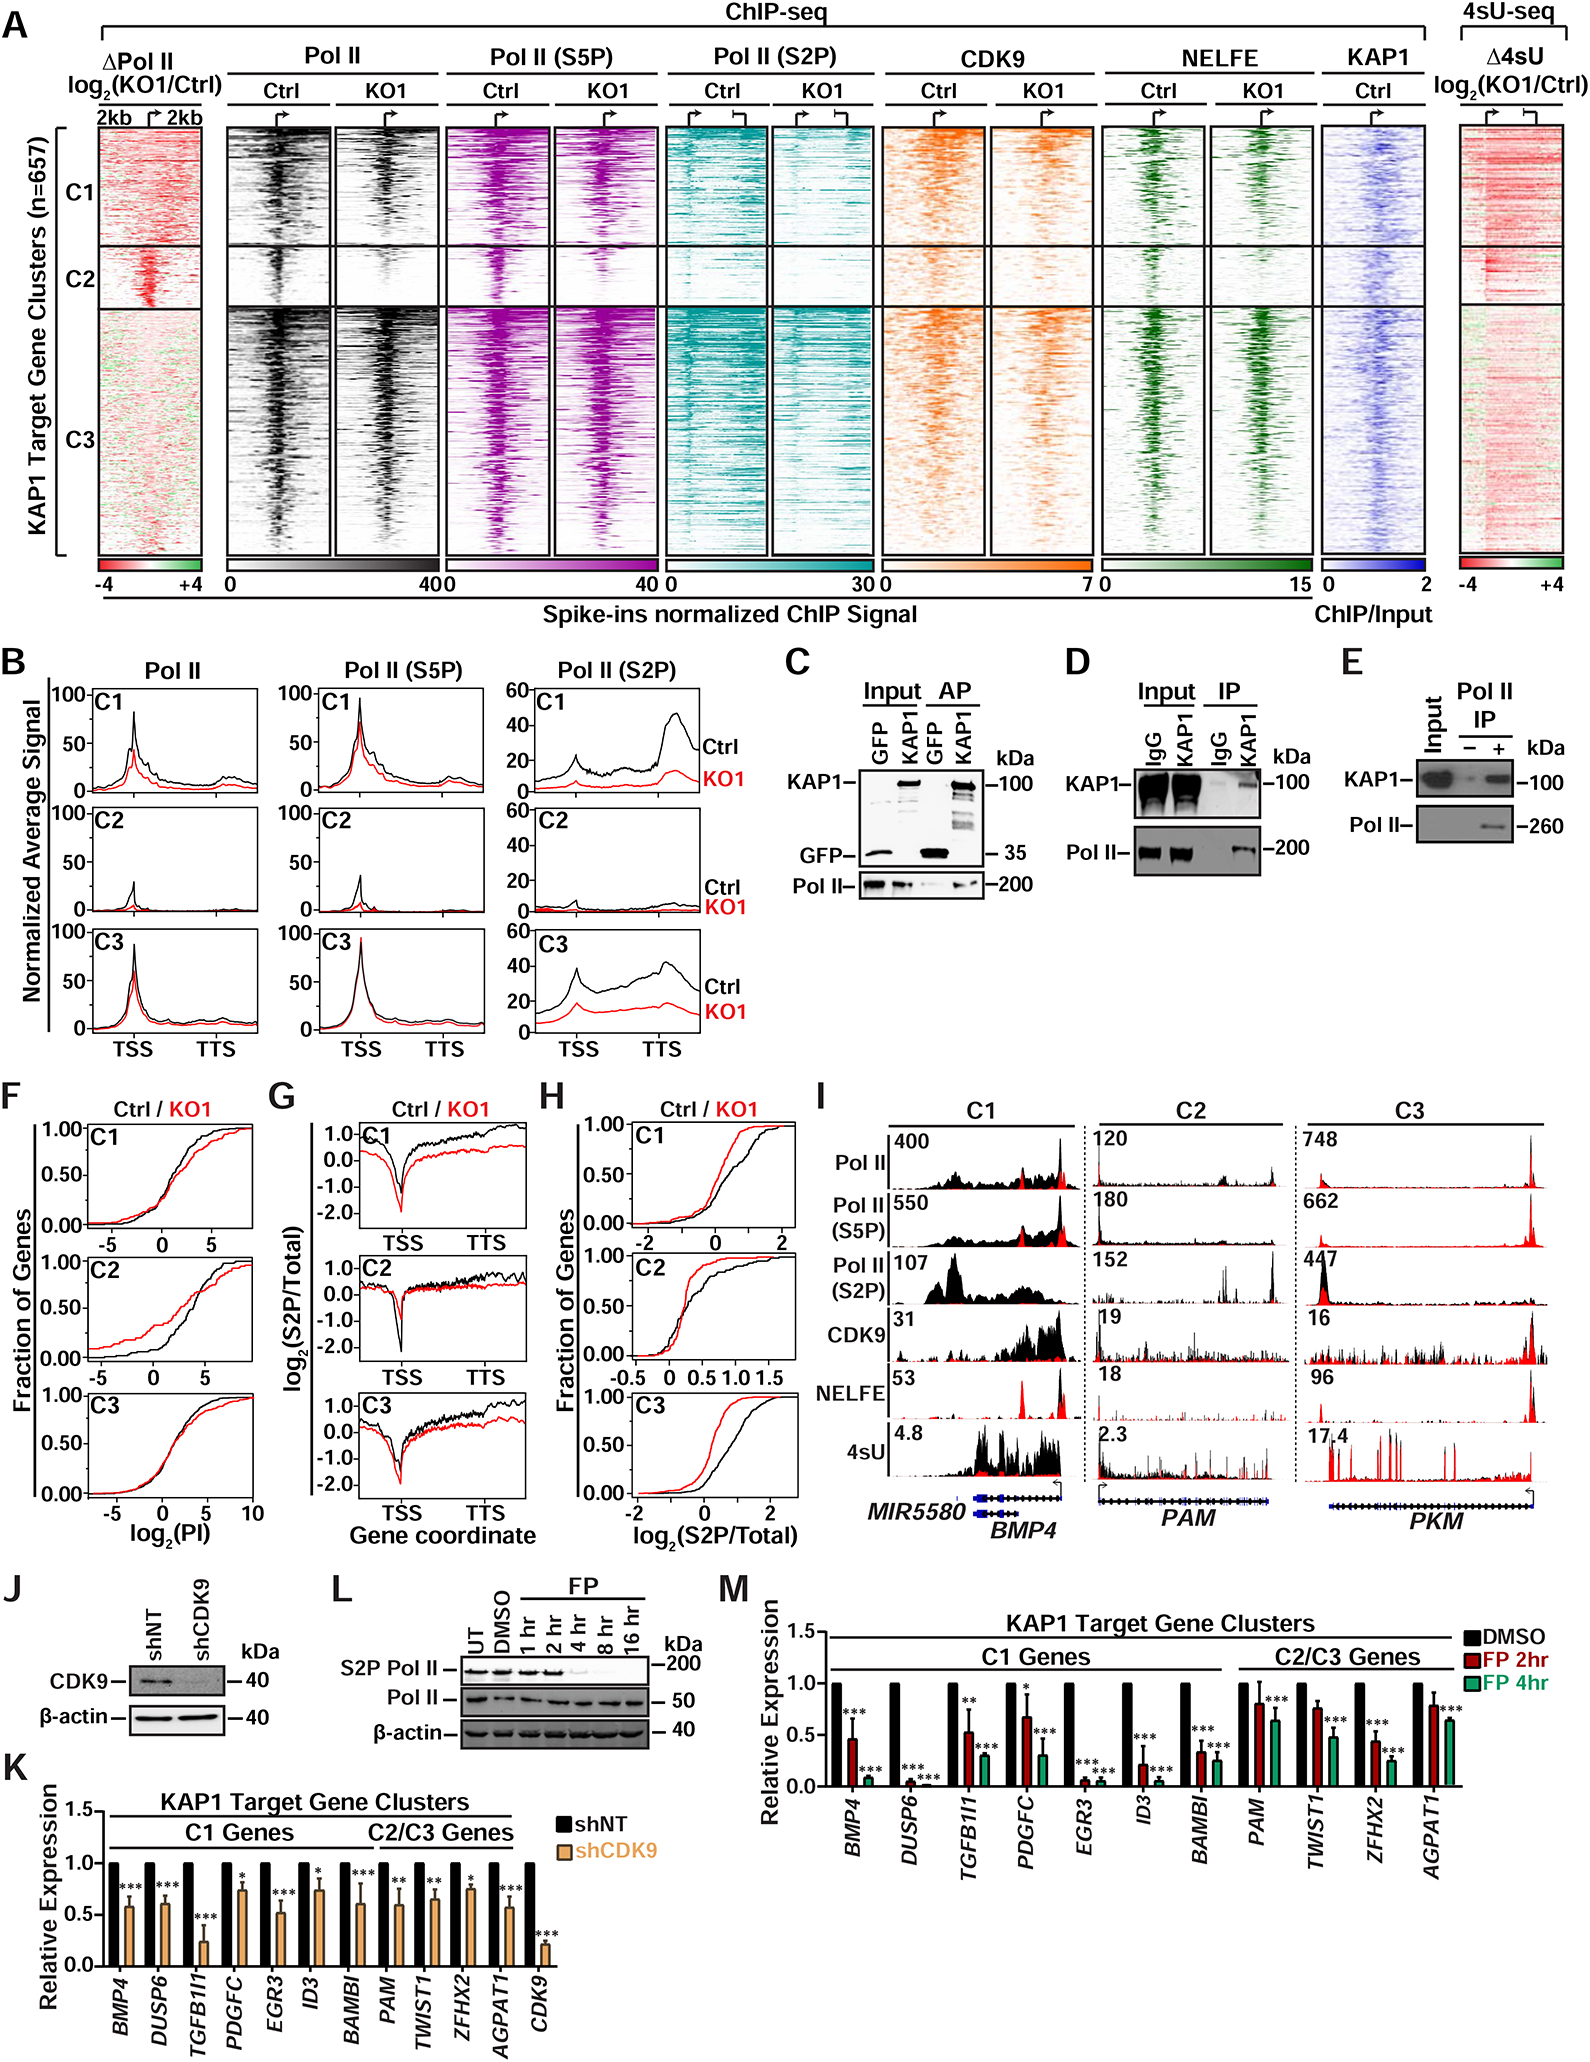
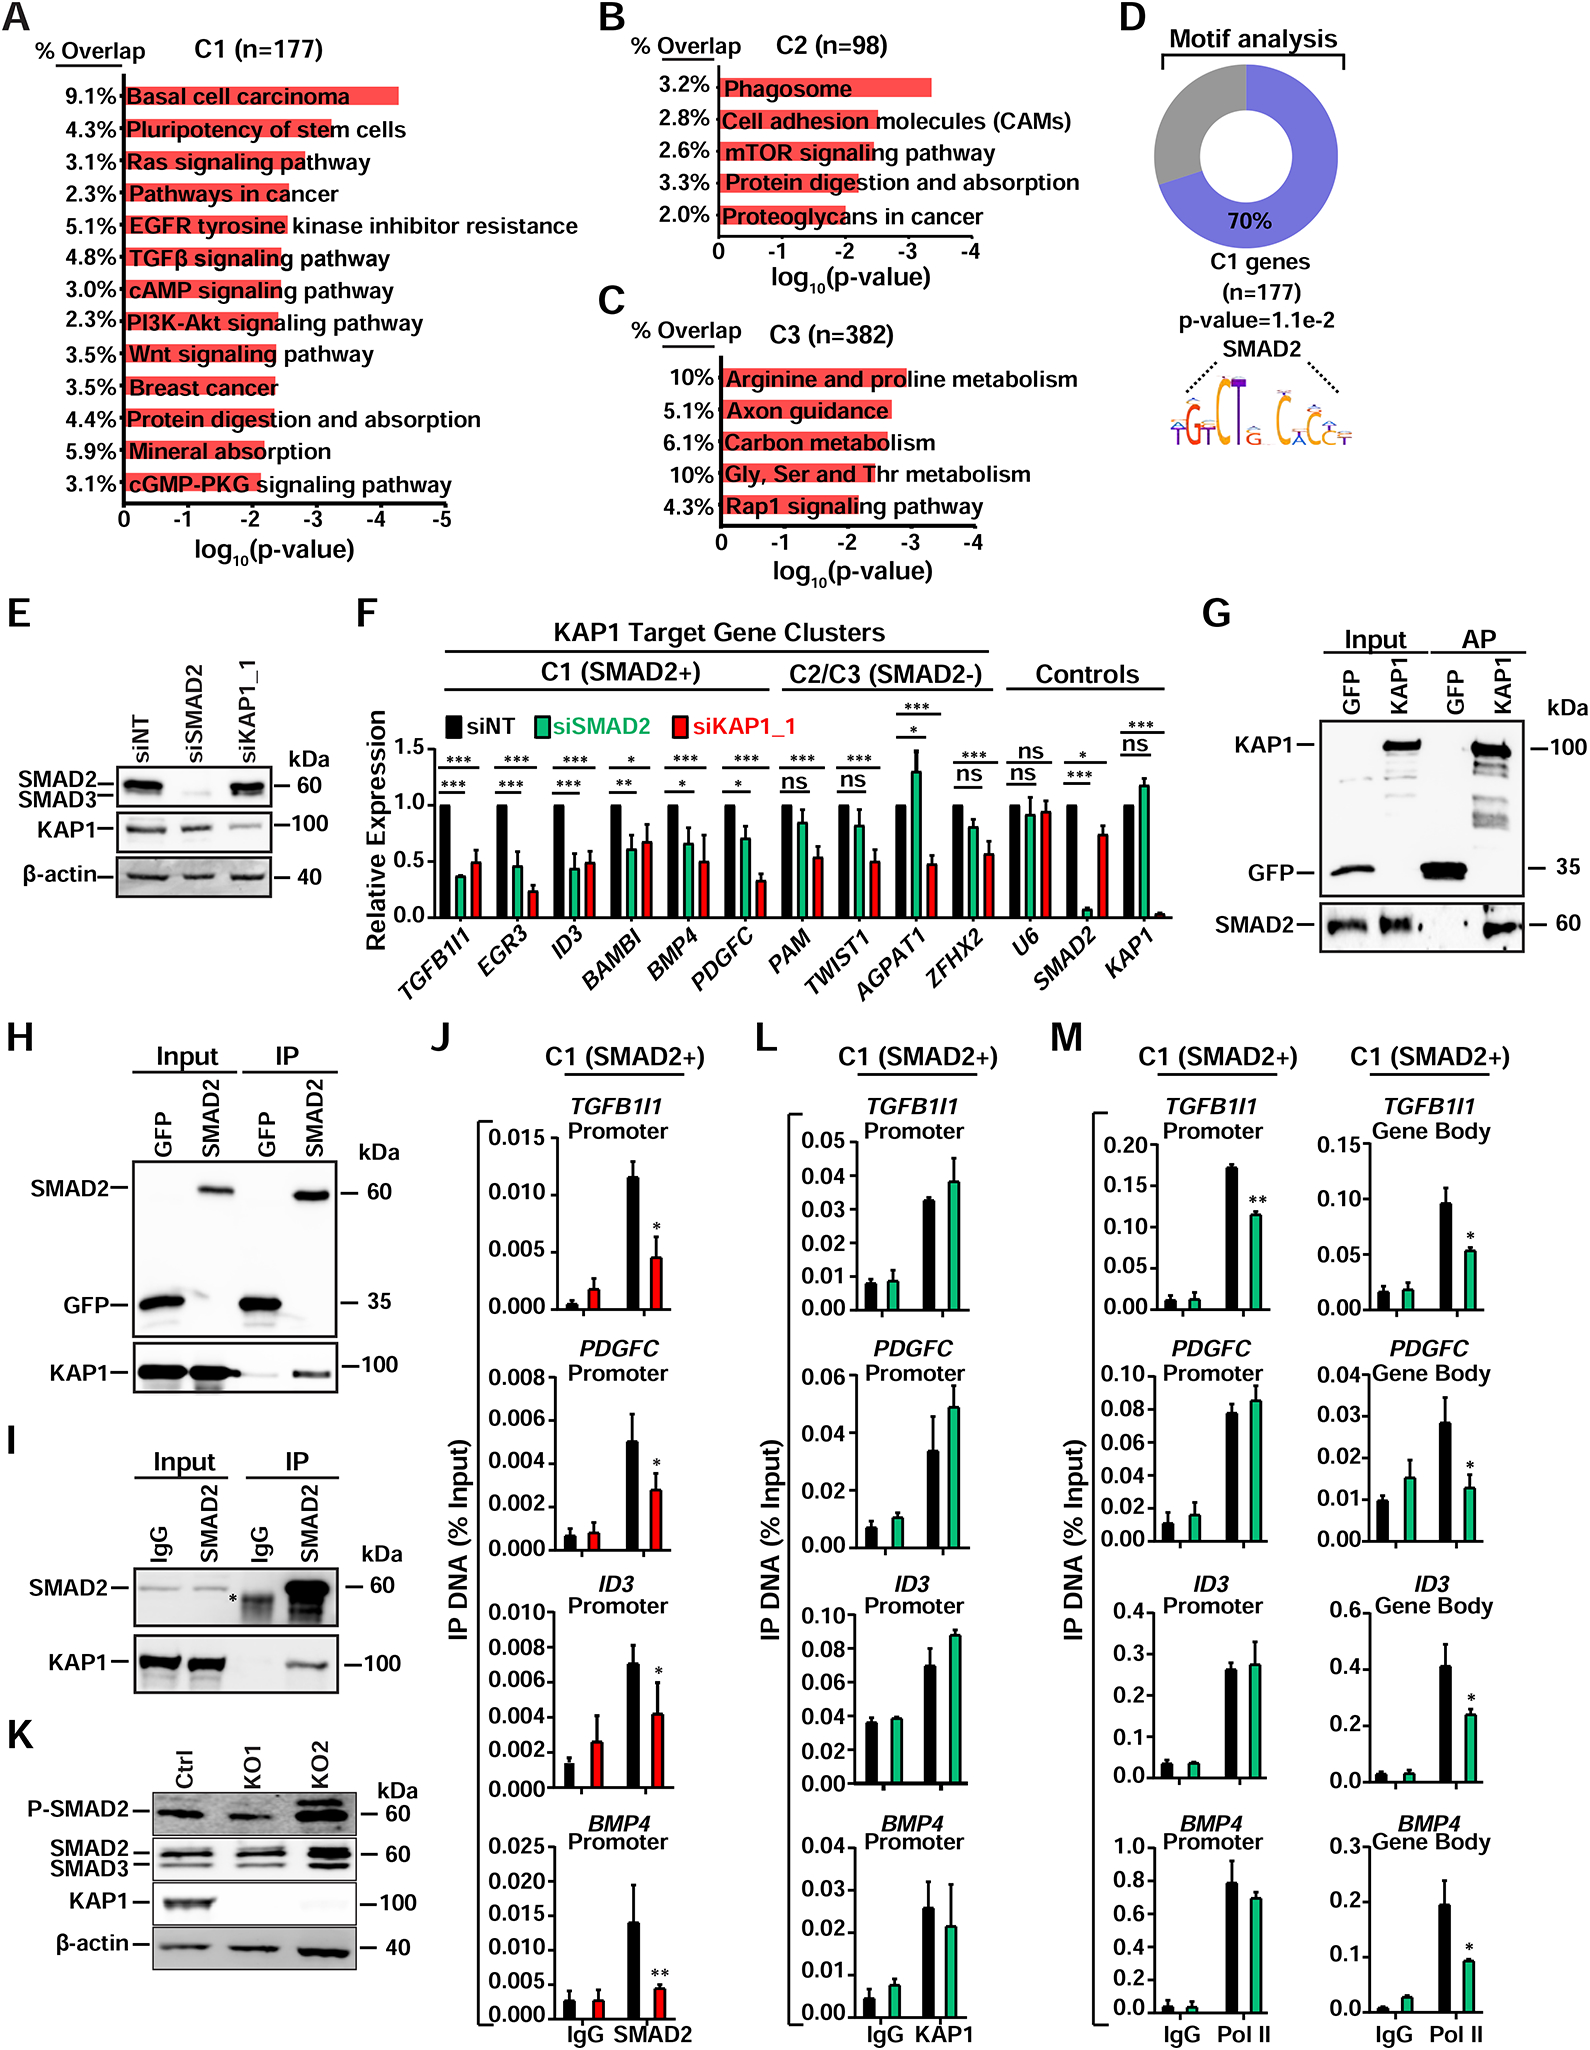
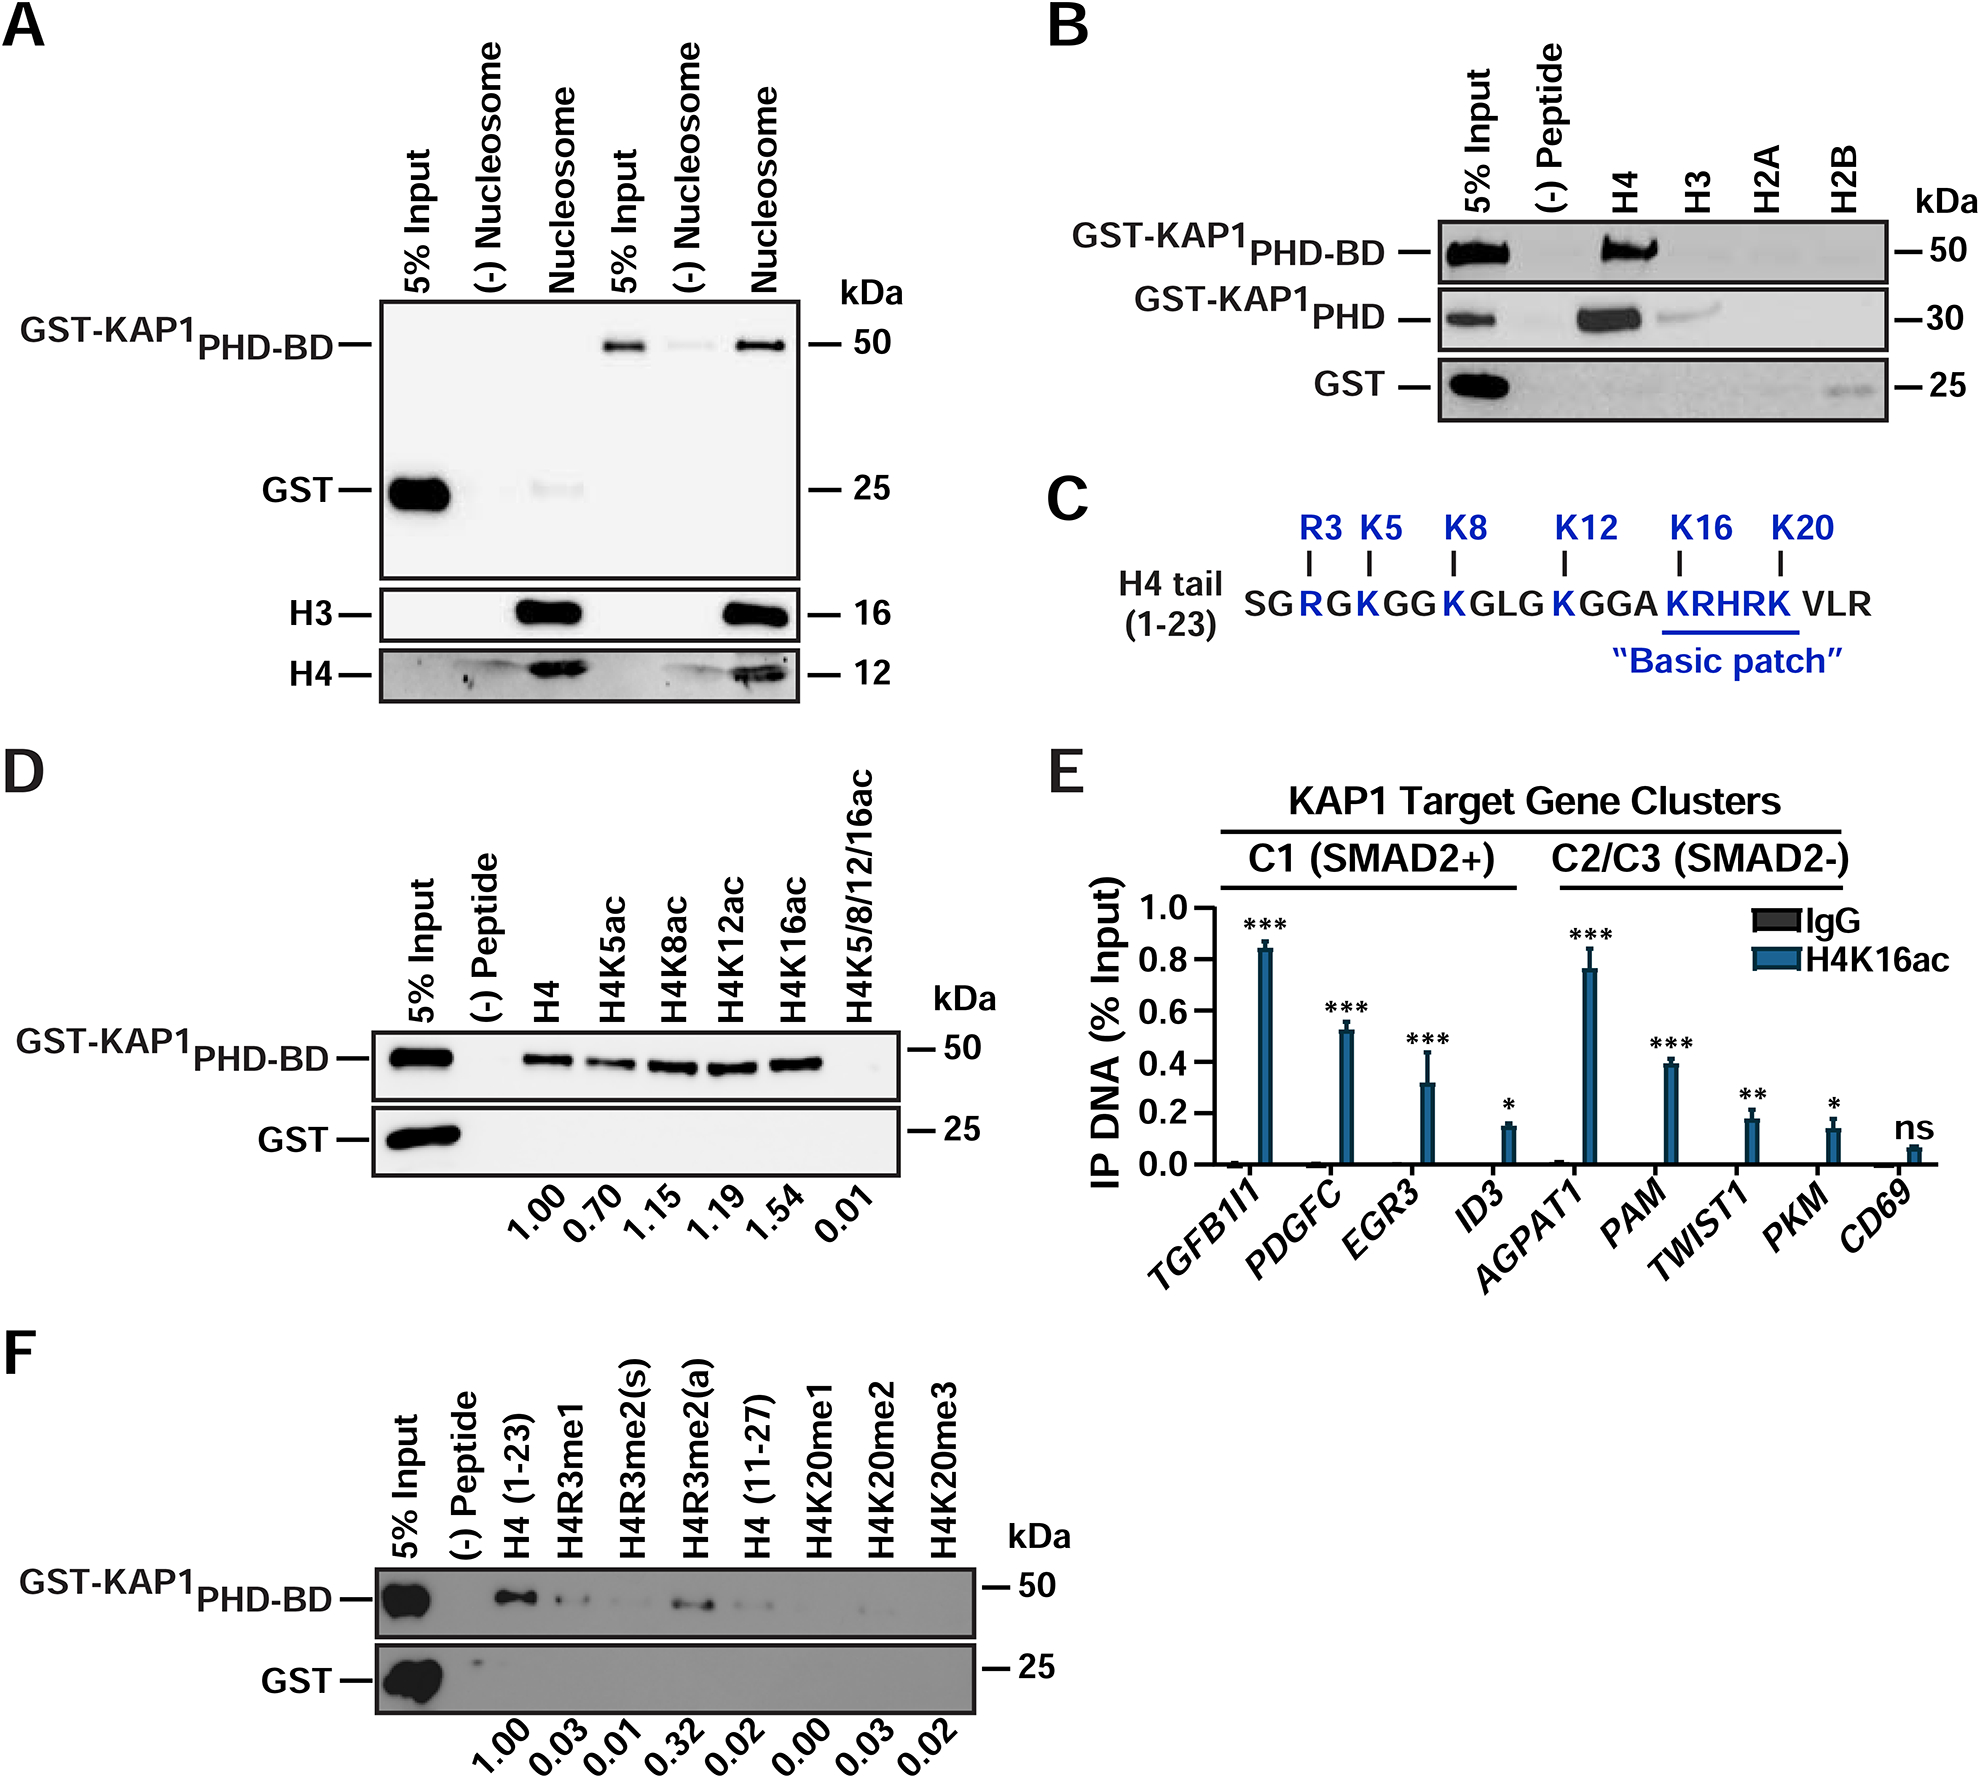
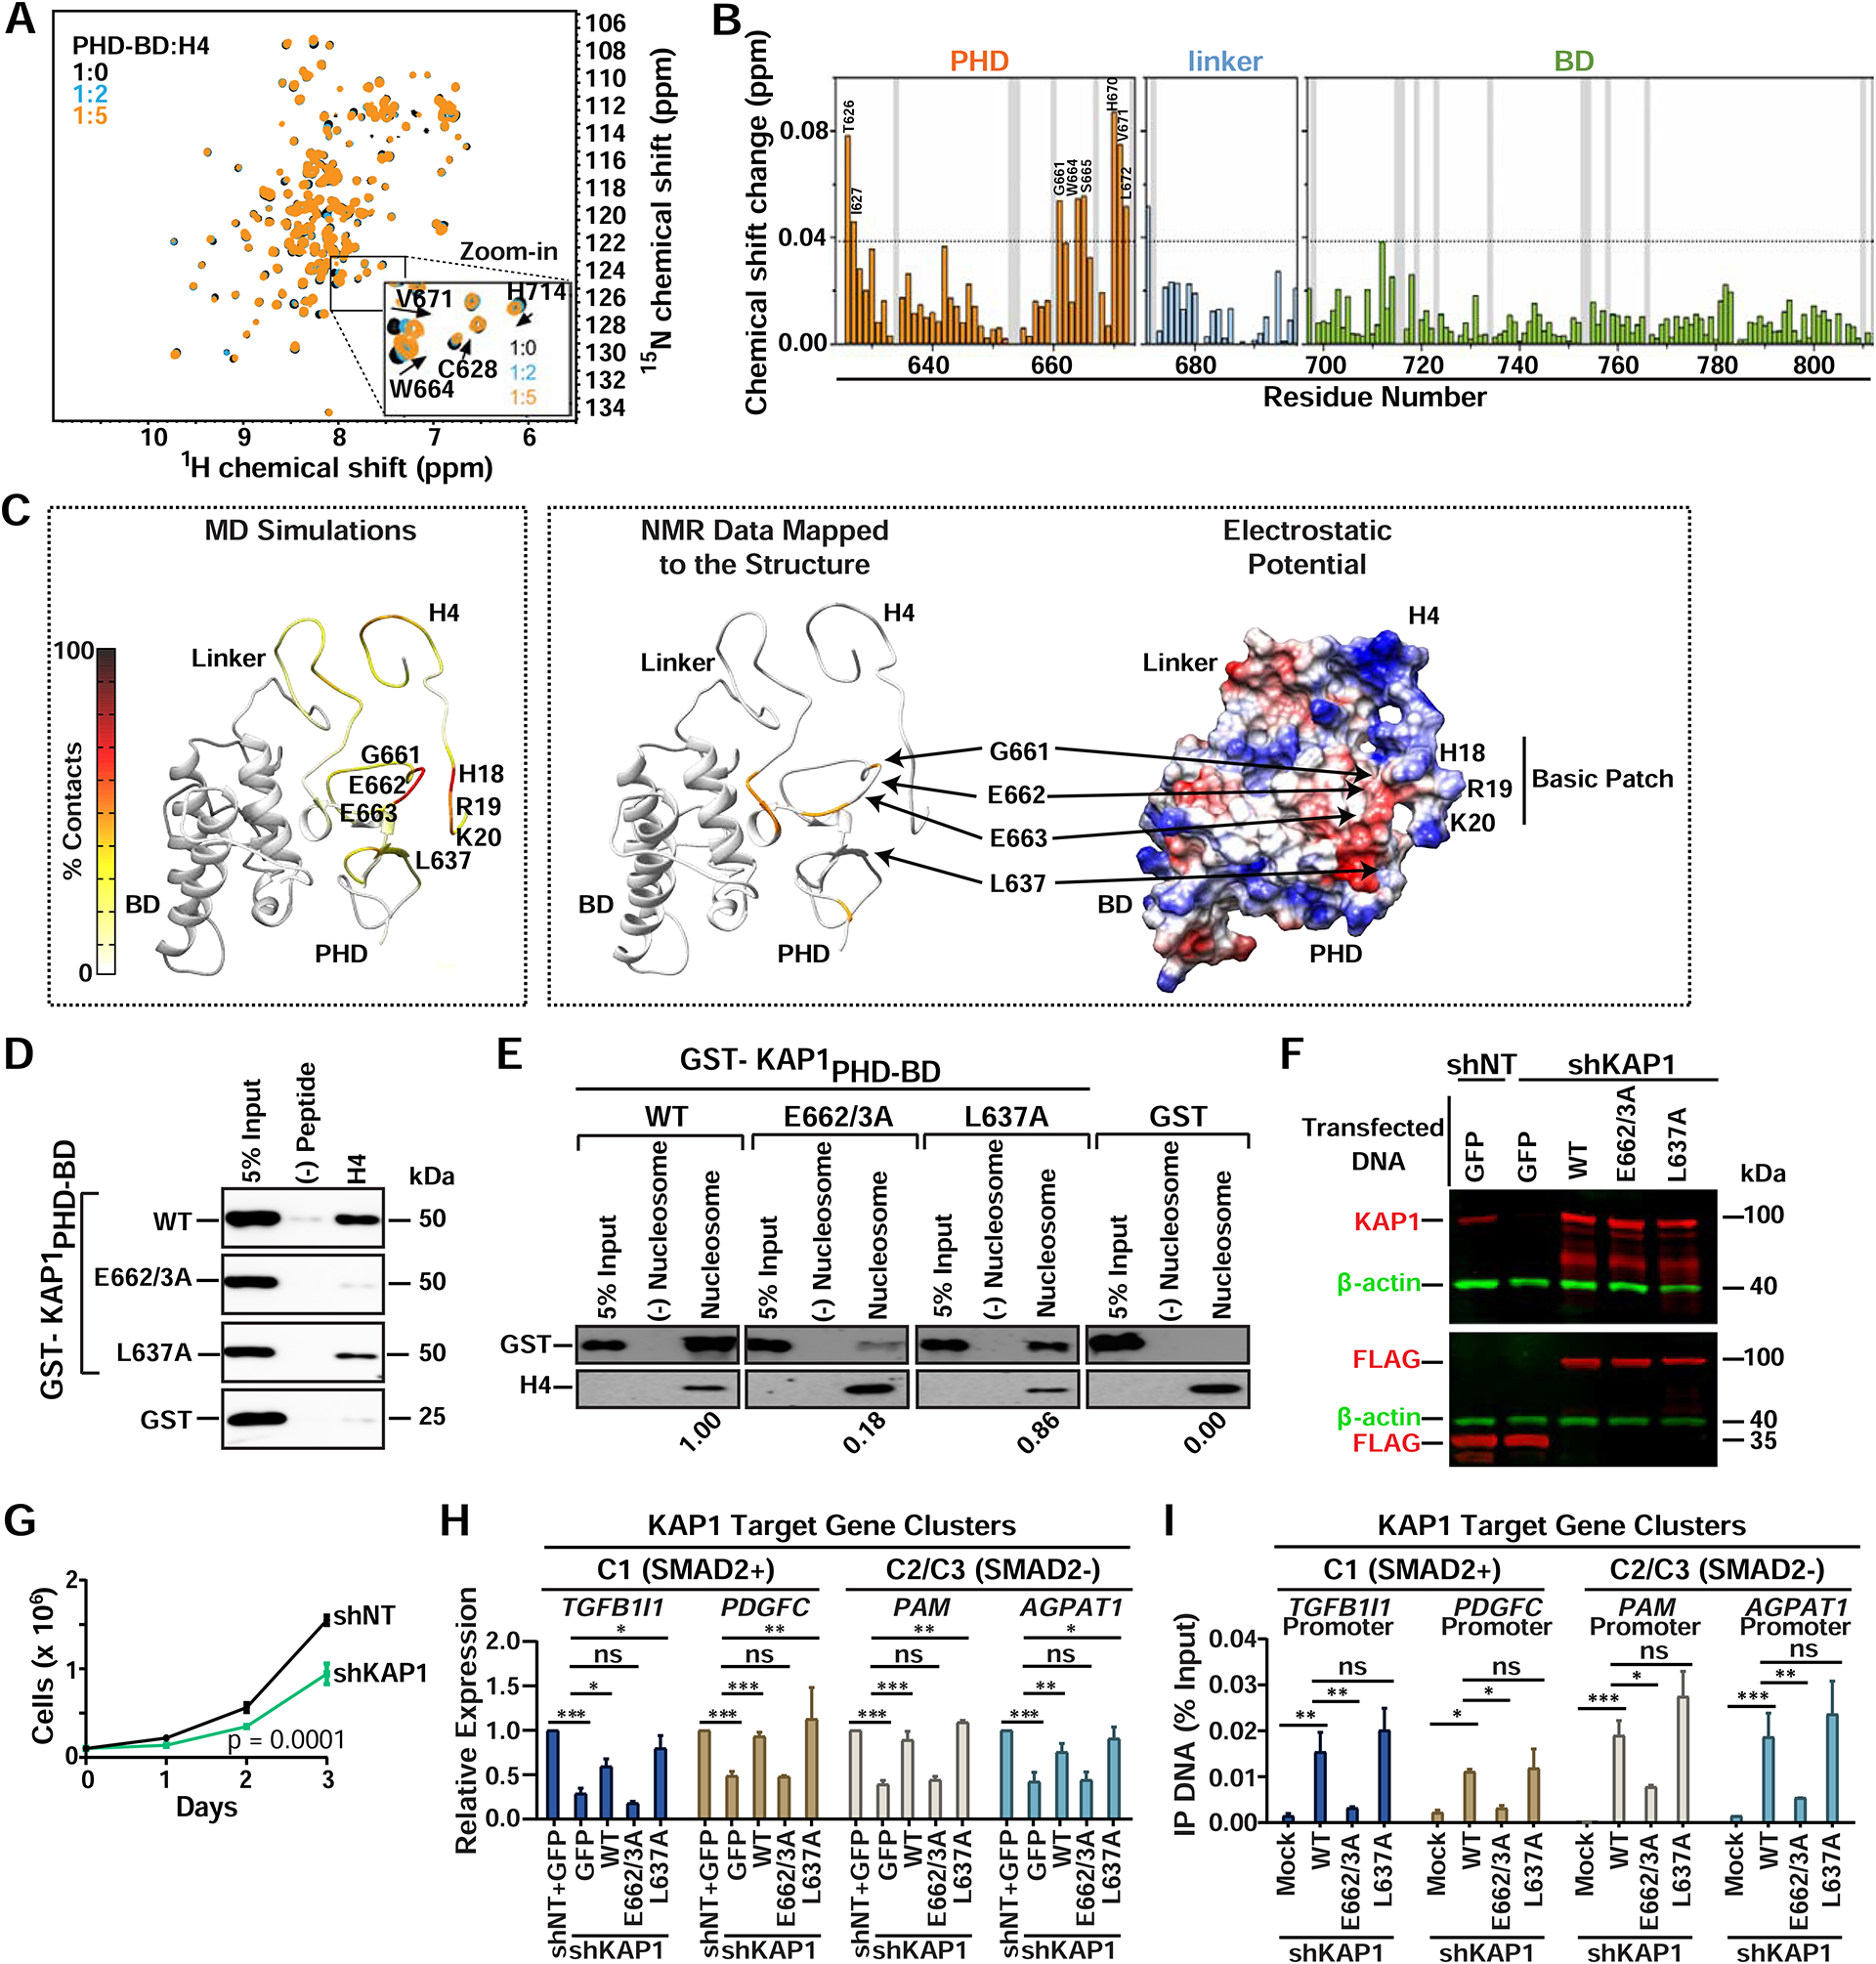
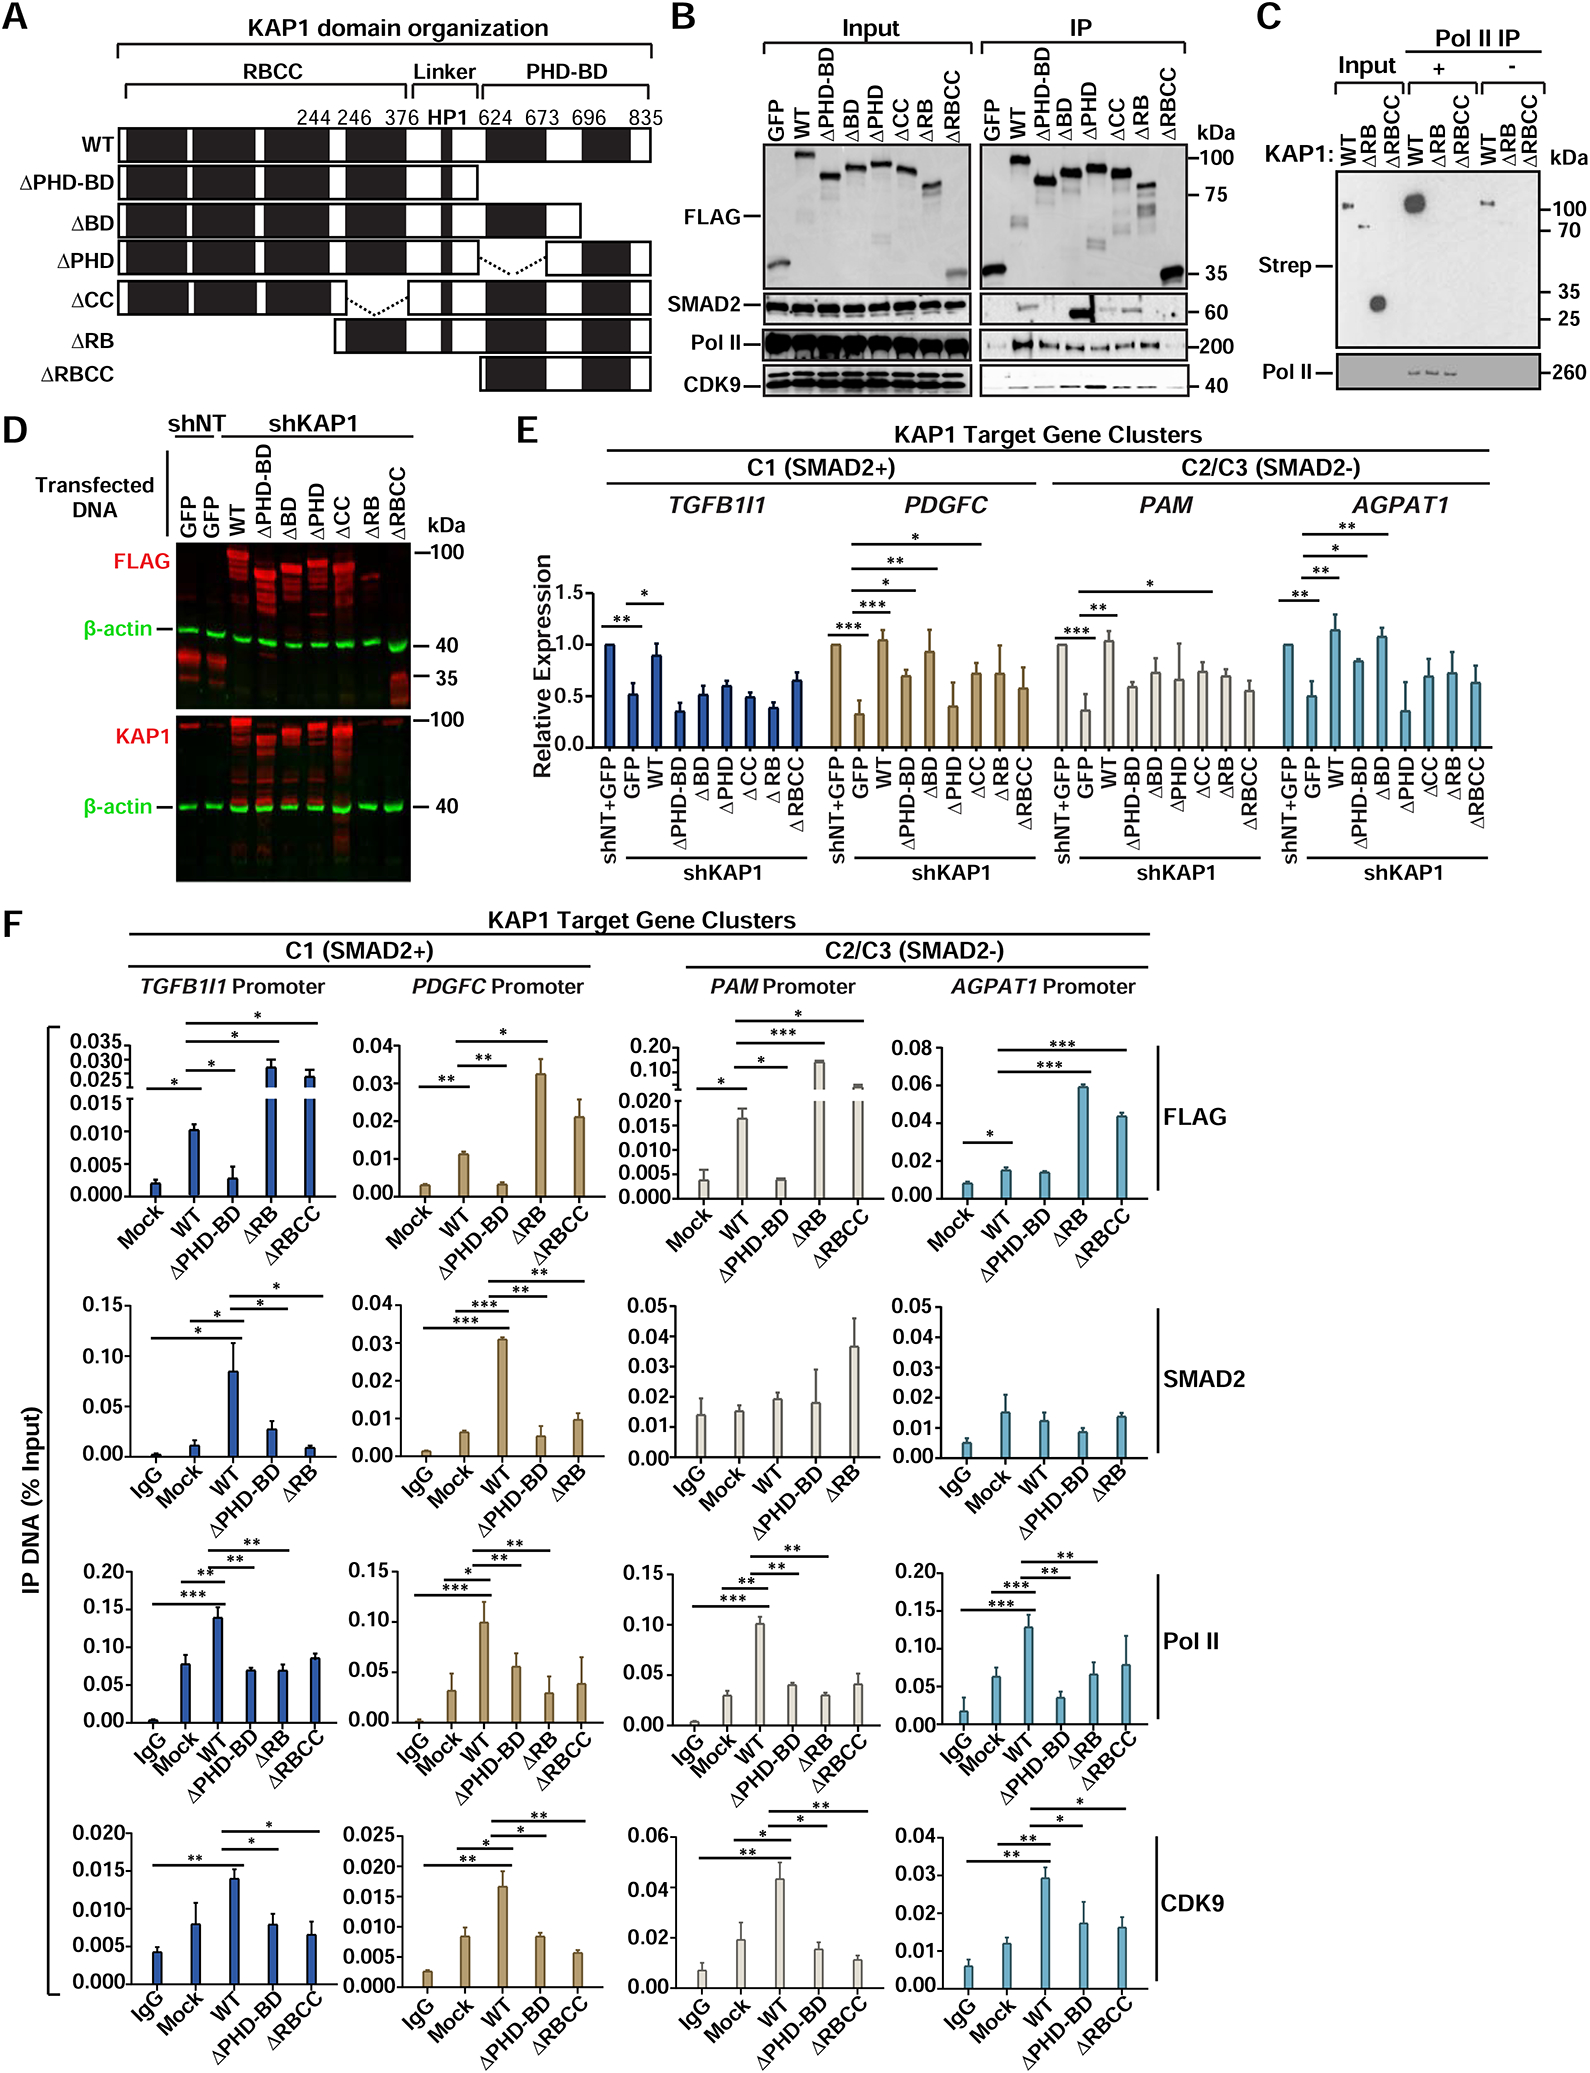
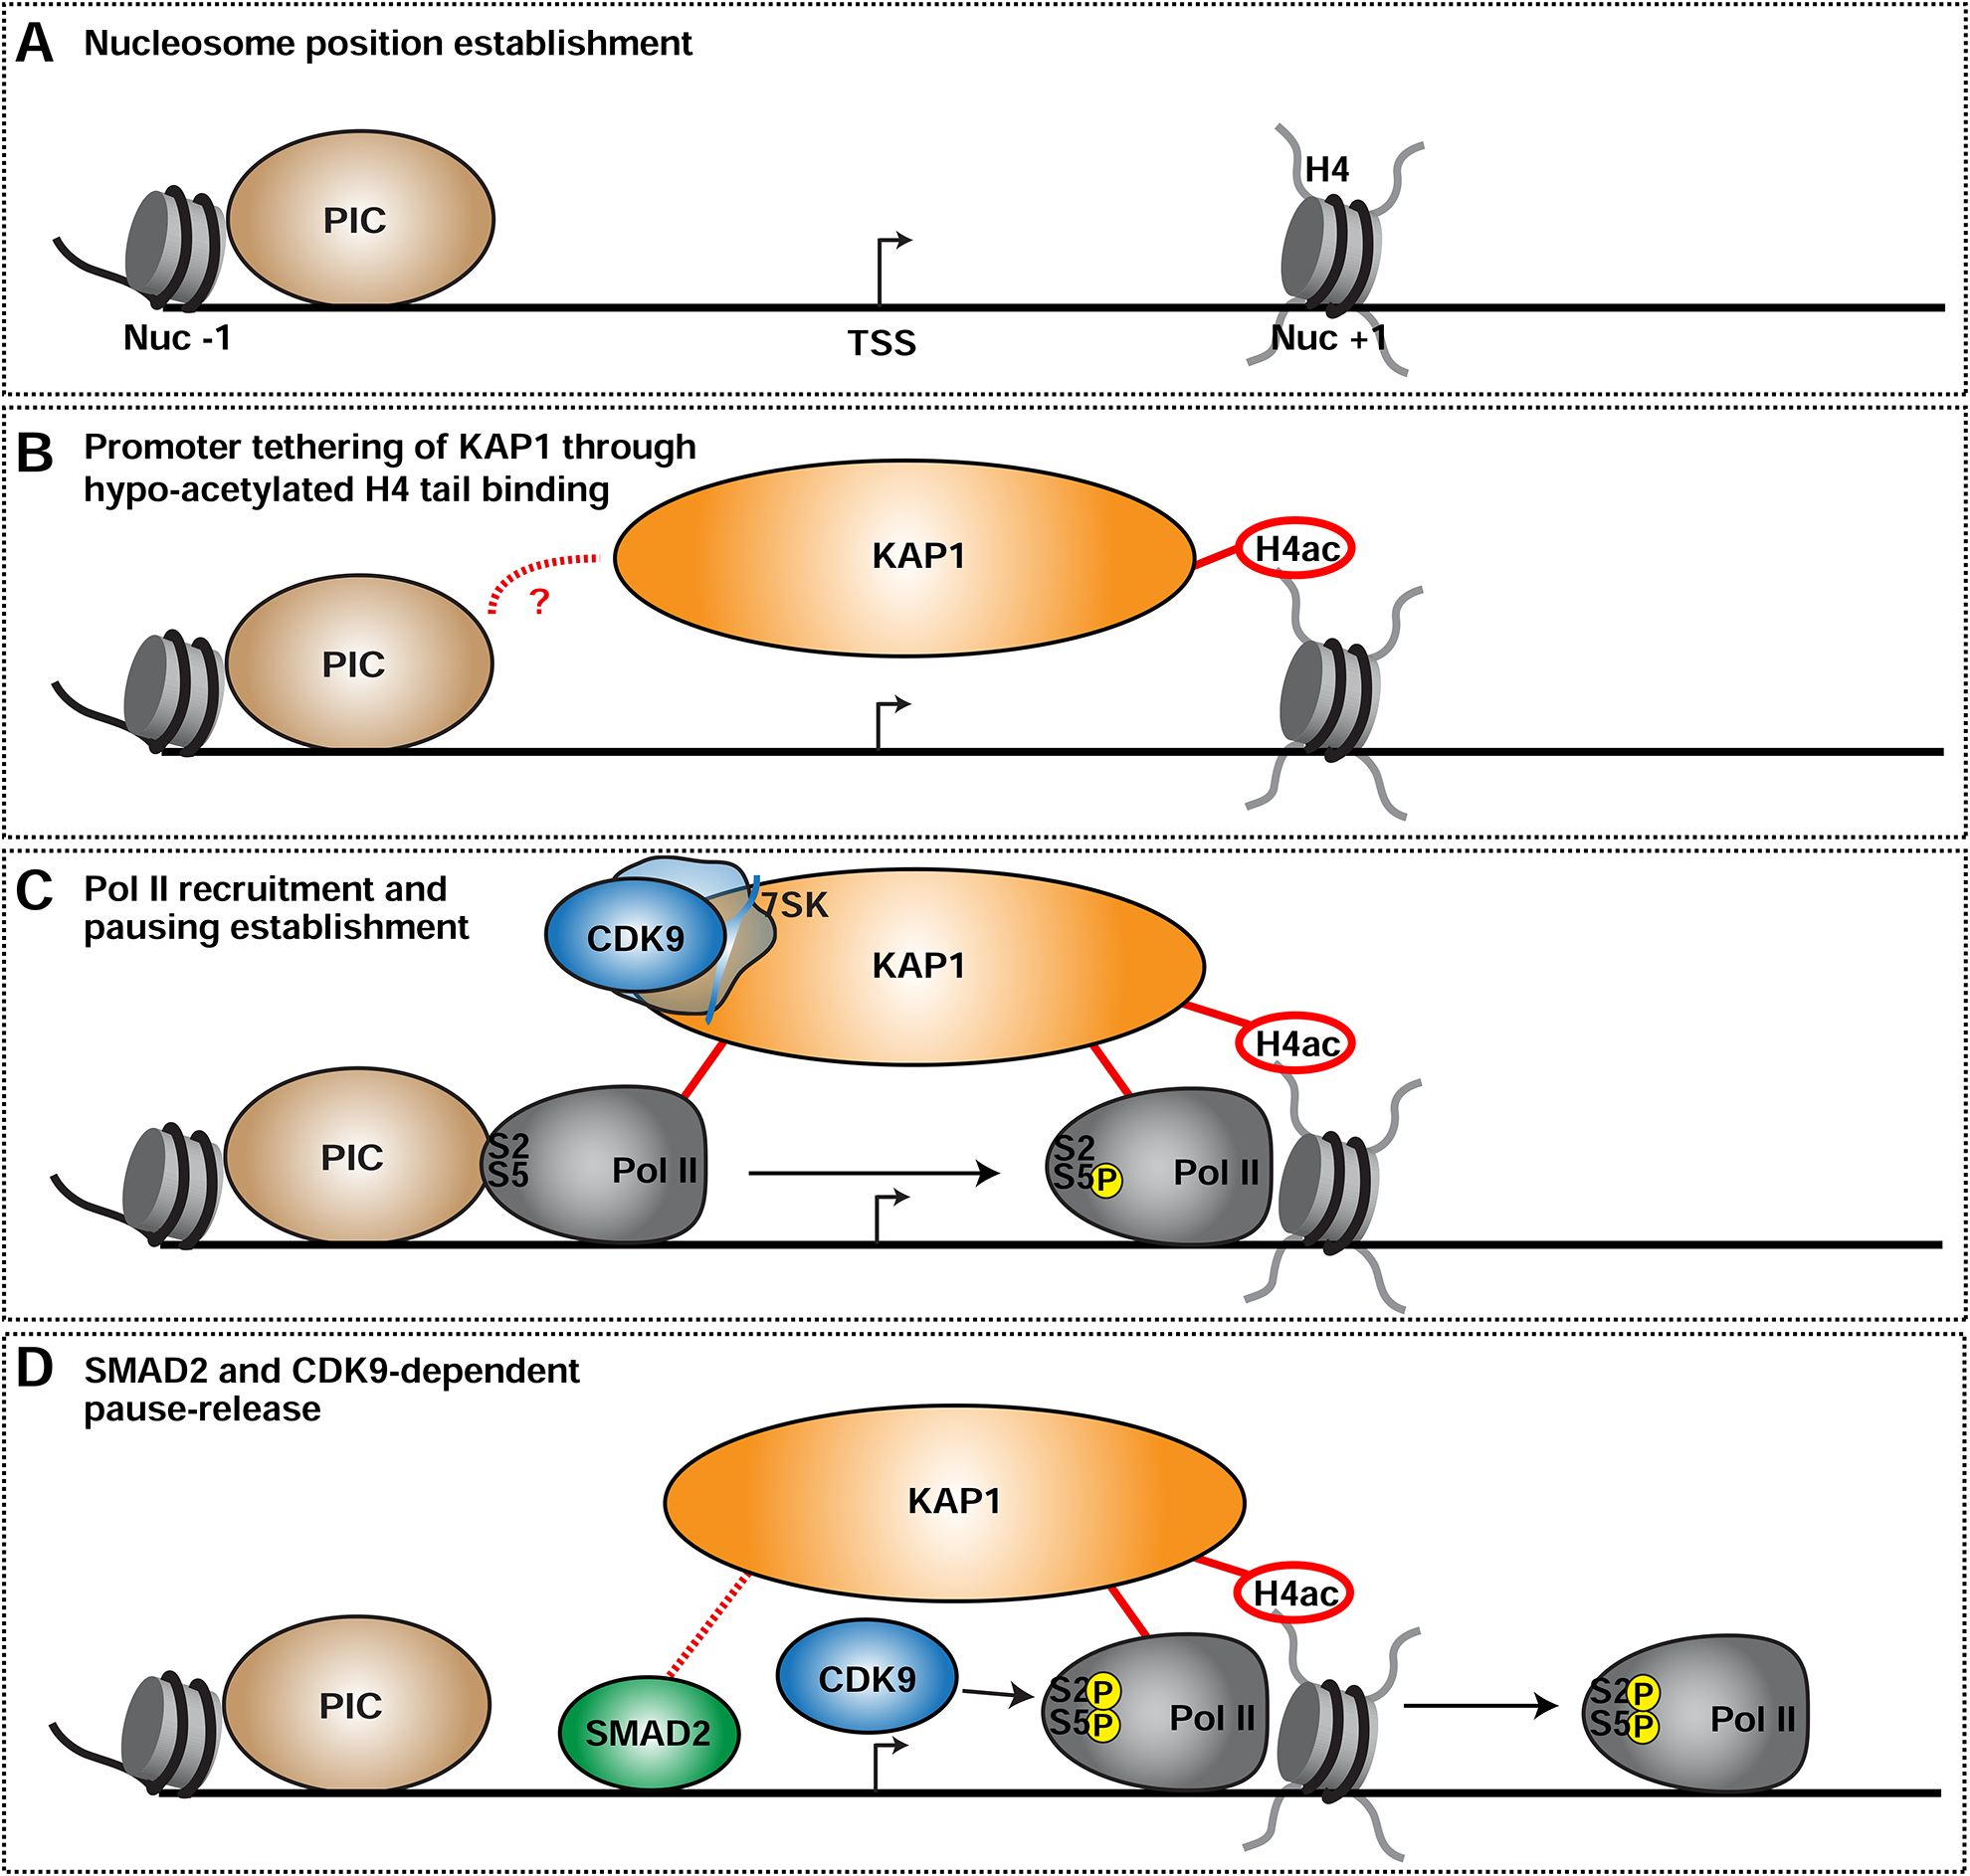
Precise control of the RNA polymerase II (RNA Pol II) cycle, including pausing and pause release, maintains transcriptional homeostasis and organismal functions. Despite previous work to understand individual transcription steps, we reveal a mechanism that integrates RNA Pol II cycle transitions. Surprisingly, KAP1/TRIM28 uses a previously uncharacterized chromatin reader cassette to bind hypo-acetylated histone 4 tails at promoters, guaranteeing continuous progression of RNA Pol II entry to and exit from the pause state. Upon chromatin docking, KAP1 first associates with RNA Pol II and then recruits a pathway-specific transcription factor (SMAD2) in response to cognate ligands, enabling gene-selective CDK9-dependent pause release. This coupling mechanism is exploited by tumor cells to aberrantly sustain transcriptional programs commonly dysregulated in cancer patients. The discovery of a factor integrating transcription steps expands the functional repertoire by which chromatin readers operate and provides mechanistic understanding of transcription regulation, offering alternative therapeutic opportunities to target transcriptional dysregulation.

Keywords: CDK9; KAP1; RNA polymerase II; SMAD; TGF-β; TRIM28; cancer; chromatin reader; epigenetics; pausing.


Conflict of interest statement

Declaration of Interests The authors declare no competing interests.

Figures

Figure 1.
Figure 1.. KAP1 Regulates the Growth and Transcriptional Output of Cancer Cells
(A) Western blot verifying KAP1 KO. (B) Cell growth assay (cell counts ± SEM; n=3). (C) Colony formation assay (colonies ± SEM; n=3). (D) Western blot verifying KAP1 KD of cells of panel (E). (E) Cell growth assay (cell counts ± SEM; n=3). (F-G) Scatter plot of the differentially expressed genes (n=3, FDR<0.05). (H) Top: Differentially expressed genes identified in 4sU-seq/RNA-seq (FDR<0.05) overlaid with KAP1 promoter ChIP-seq peaks. Bottom: Heatmaps of KAP1 ChIP-seq signal over input. (I) Validation of KAP1 ChIP-seq promoter peaks by ChIP-qPCR (mean % Input ± SEM; n=3). (J) Genome browser tracks for select genes.
Figure 2.
Figure 2.. Pol II Promoter Levels and Pause-release are Dependent on KAP1
(A) Left: K-means clustered log2(KO1/Ctrl) heatmap of Pol II. Middle: Heatmaps of factor promoter occupancy. Right: Heatmap of Δ4sU-seq. ChIP-seq signal was normalized to Drosophila spike-ins. Individual clusters (C1 n=177, C2 n=98, C3 n=382) are sorted by decreasing Pol II occupancy. (B) Metagene plots (± 2 kb flanking regions) of Pol II at downregulated KAP1 target gene clusters. (C) STREP AP of ectopically expressed STREP-tagged KAP1 from HCT116 nuclear extracts. (D) Endogenous IP of KAP1 from HCT116 nuclear extracts. (E) In vitro binding assay between purified KAP1 and Pol II. (F) Empirical cumulative density function plots of Pol II PI at genes from each cluster. (G) Metagene plots (± 2 kb flanking regions) representing the log2(S2P/total) signal at genes from each cluster. (H) Empirical cumulative density function plots of log2(S2P/total) signal at genes from each cluster. (I) Genome browser tracks of ChIP-seq and 4sU-seq for genes from each cluster. (J) Western blot of CDK9 KD in HCT116. (K) RT-qPCR analysis after CDK9 KD (mean ± SEM; normalized to RPL19; n=3). (L) Western blots at different time points after Flavopiridol (FP) treatment. Pol II (RPB3). (M) RT-qPCR analysis after FP treatment (mean expression relative to DMSO ± SEM; normalized to U6; n=3).
Figure 3.
Figure 3.. KAP1 Recruits a Pathway Specific Factor to Stimulate Pol II Pause-release
(A–C) KEGG pathway analysis for the three gene clusters. Pathways with P<0.01 are shown. (D) Enriched SMAD2 DNA motifs in promoter regions for C1 genes. (E) Western blot validating KD efficiency in HCT116. (F) Expression levels of genes after RNAi in HCT116 (mean expression relative to siNT ± SEM; normalized to RPL19; n=3). (G) STREP AP of ectopically expressed STREP-tagged KAP1 (same AP from Figure 2C) (H) FLAG IP of ectopically expressed FLAG-tagged SMAD2 from HCT116 nuclear extract. (I) Endogenous IP of SMAD2 from HCT116 nuclear extracts. *IgG. (J) ChIP-qPCR of SMAD2 at the indicated gene promoters (mean ± SEM; n=3). (K) Western blots of the indicated factors. (L) ChIP-qPCR of KAP1 at the indicated gene promoters (mean ± SEM; n=2). (M) ChIP-qPCR of Pol II at the indicated gene regions (mean ± SEM; n=2).
Figure 4.
Figure 4.. The KAP1 Chromatin Reader Cassette Directly Recognizes Hypo-acetylated H4 Tails
(A-B) In vitro binding assay between recombinant proteins and (A) biotinylated mono-nucleosomes or (B) biotinylated histone peptides. (C) H4 tail sequence with commonly modified residues highlighted. (D) In vitro binding assay between recombinant proteins and acetylated H4 peptides. (E) ChIP-qPCR of H4K16ac in HCT116 (mean ± SEM; n=3). (F) In vitro binding assay between recombinant proteins and methylated H4 histone peptides. For panels (D) and (F) quantifications relative to unmodified H4 are shown. All western blots were probed with anti-GST.
Figure 5.
Figure 5.. Direct H4 Tail Binding is Necessary for KAP1 Promoter Occupancy and Target Gene Activation
(A) The 1H, 15N HSQC spectra of KAP1PHD-BD collected upon titration with H4 peptide. Inset shows residues displaying chemical shifts. Spectra are color-coded according to the PHD-BD:H4 molar ratio. (B) Histogram showing chemical shift perturbations. Vertical grey bars indicate Pro and unmapped residues. The dash line indicates a threshold value of average + 3×SD. Chemical shift assignments of the apo-PHD-BD state were from BMRB (ID 11036). (C) Left: Predicted model depicting the frequency of residue specific contacts between KAP1PHD and H4 in the production run of the MD simulations using backbone amide resonances in panel (A) as restraints. Middle: Residues exhibiting H4-induced resonance perturbations above threshold are mapped in orange onto the structure of the predicted complex. Right: The electrostatic surface potential of the predicted complex is colored blue and red for positive and negative charges, respectively. (D-E) In vitro binding assay between recombinant proteins and (D) H4 peptide or (E) biotinylated mono-nucleosomes. Western blots probed with anti-GST. Quantitation relative to WT KAP1 of (E) are shown. (F) Western blot of KAP1 proteins in the indicated HCT116 cell lines. (G) Cell growth assay (cell counts ± SEM; n=3). (H) RT-qPCR of KAP1 target genes after reconstitution of the indicated proteins in shKAP1 HCT116 (mean expression relative to shNT+GFP ± SEM; normalized to RPL19; n=3). (I) FLAG ChIP-qPCR of the indicated proteins at KAP1 target gene promoters (mean % Input DNA ± SEM; n=3).
Figure 6.
Figure 6.. The KAP1 Chromatin Reader Function is Necessary to Scaffold Pol II and Pause-release Factors at Promoters Through Different Protein Domains
(A) FLAG-tagged KAP1 constructs. (B) Co-IP of FLAG-tagged KAP1 constructs from HCT116 nuclear extracts. (C) In vitro binding assay between core Pol II and KAP1 constructs. Pol II (RPB1). (D) Expression of FLAG-tagged KAP1 constructs in shKAP1 HCT116. Note that N-terminal deletion constructs are not recognized by the KAP1 antibody. (E) Expression levels of KAP1 target genes after reconstitution of HCT116 shKAP1 cells with KAP1 constructs (mean expression relative to shNT+GFP ± SEM; normalized to RPL19; n=3). (F) ChIP-qPCR of the indicated factors at KAP1 target gene promoters after reconstitution of shKAP1 HCT116 with the indicated constructs (mean % Input DNA ± SEM; n=3).
Figure 7.
Figure 7.. KAP1 Couples Establishment of Pol II Promoter Levels with Pause-release to Sustain Oncogenic Transcriptional Programs
(A) Establishment of the NFR around promoters. (B) KAP1 is tethered to gene promoters through direct interactions with the hypo-acetylated H4 tail. Specific promoter recognition may occur through yet unknown interactions with other TFs such as PIC subunits. See Discussion for complete details. (C) Upon promoter binding, KAP1 directly stimulates Pol II recruitment and/or pausing and tethers 7SK-bound CDK9. (D) In response to cognate signals (TGF-β), KAP1 recruits a pathway-specific TF (SMAD2) to select gene promoters thereby promoting CDK9 activation and Pol II pause-release.

References

    1. Agricola E, Randall RA, Gaarenstroom T, Dupont S, and Hill CS (2011). Recruitment of TIF1gamma to chromatin via its PHD finger-bromodomain activates its ubiquitin ligase and transcriptional repressor activities. Mol Cell 43, 85–96. - PubMed
    1. Ahn SH, Kim M, and Buratowski S (2004). Phosphorylation of serine 2 within the RNA polymerase II C-terminal domain couples transcription and 3’ end processing. Mol Cell 13, 67–76. - PubMed
    1. Allis CD, and Jenuwein T (2016). The molecular hallmarks of epigenetic control. Nat Rev Genet 17, 487–500. - PubMed
    1. Bacon CW, and D’Orso I (2018). CDK9: a signaling hub for transcriptional control. Transcription, 1–19. - PMC - PubMed
    1. Bailey TL, Boden M, Buske FA, Frith M, Grant CE, Clementi L, Ren J, Li WW, and Noble WS (2009). MEME SUITE: tools for motif discovery and searching. Nucleic Acids Res 37, W202–208. - PMC - PubMed

Publication types

MeSH terms