. 2020 Jun 2;31(6):1120-1135.e7.
doi: 10.1016/j.cmet.2020.04.013. Epub 2020 May 12.

Brain-Sparing Sympathofacilitators Mitigate Obesity without Adverse Cardiovascular Effects

Affiliations

Brain-Sparing Sympathofacilitators Mitigate Obesity without Adverse Cardiovascular Effects

Inês Mahú et al. Cell Metab. .

Abstract

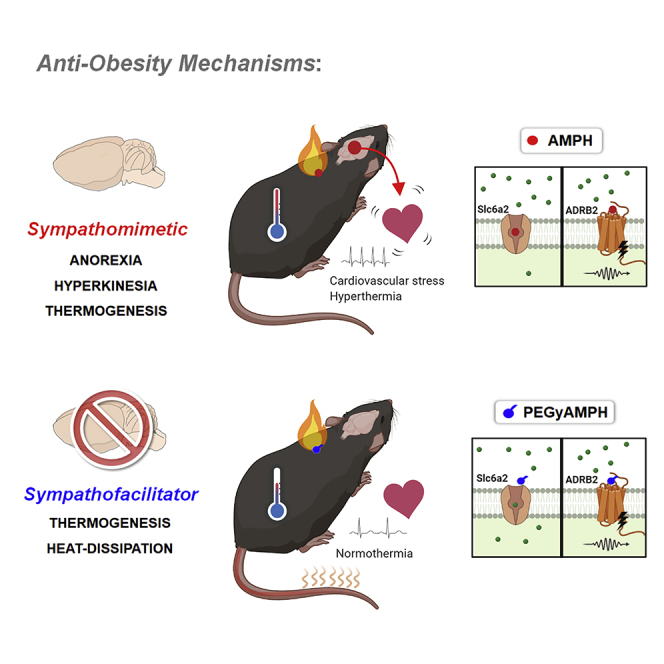
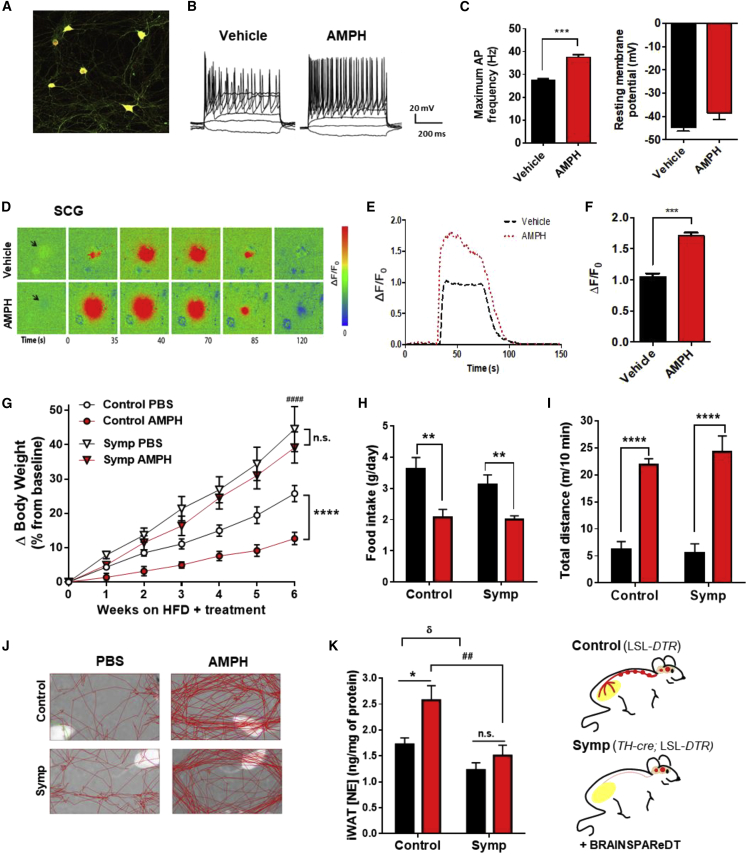
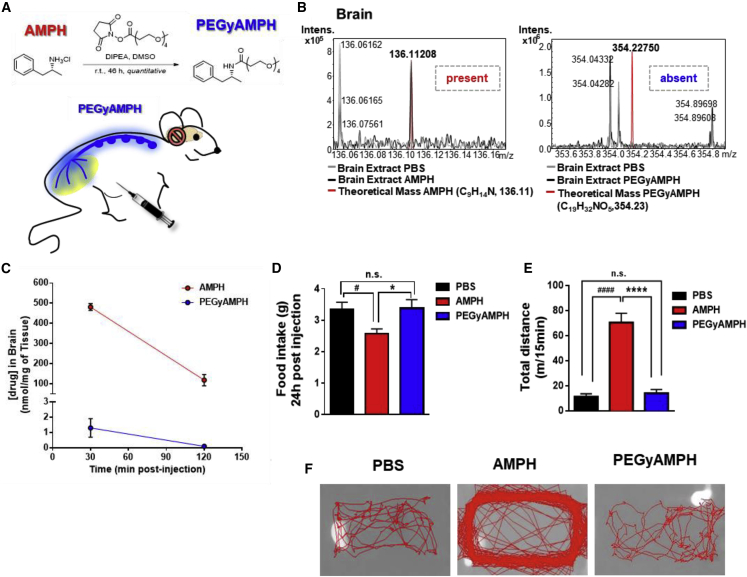
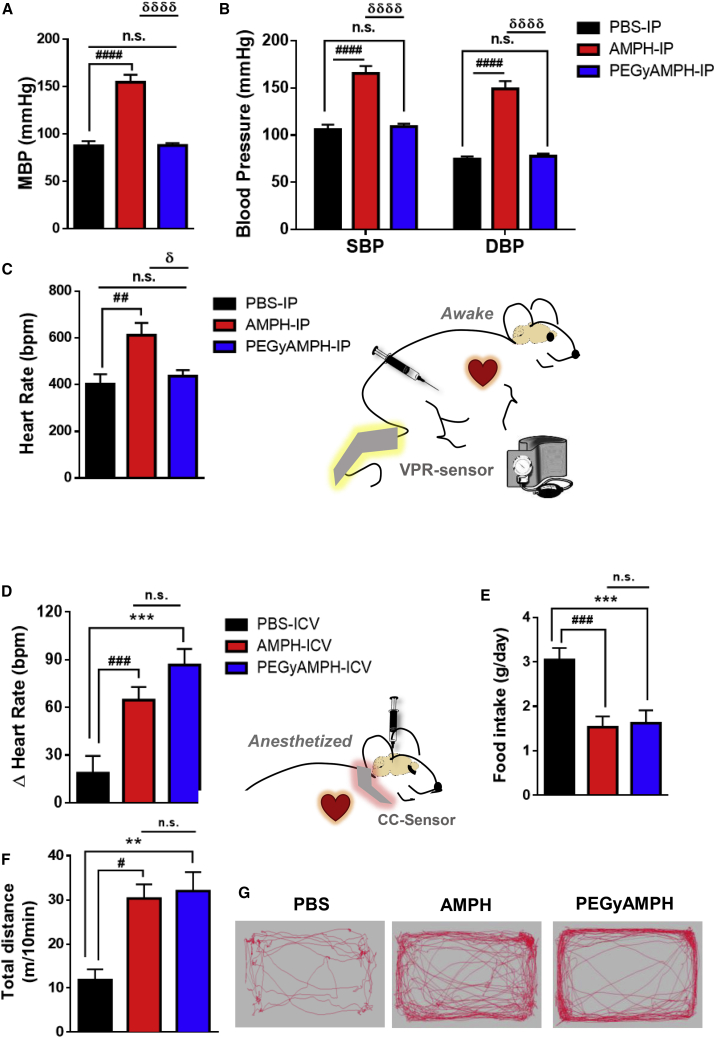
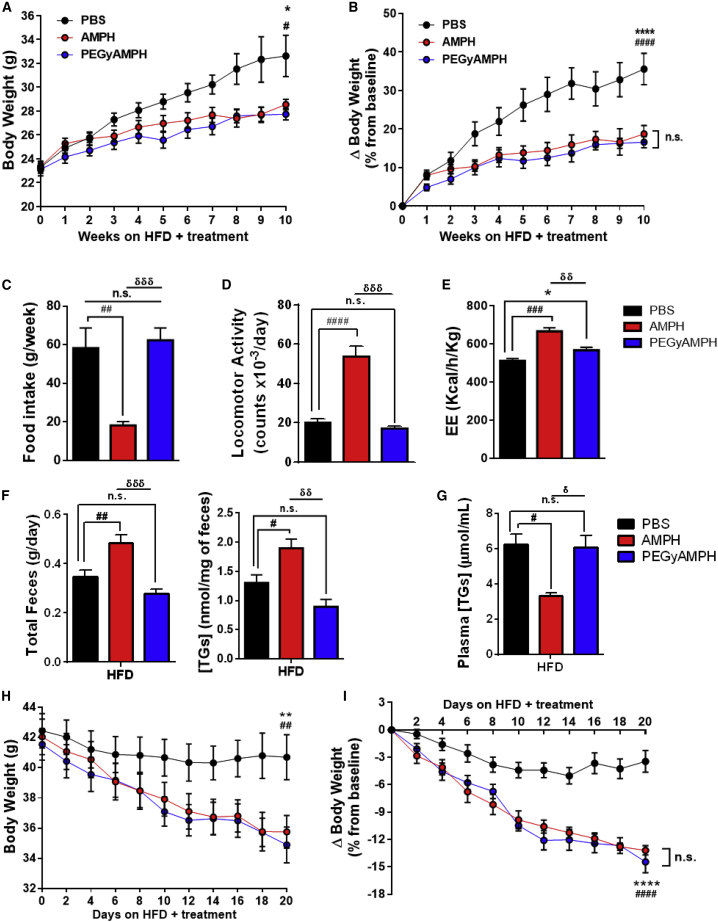
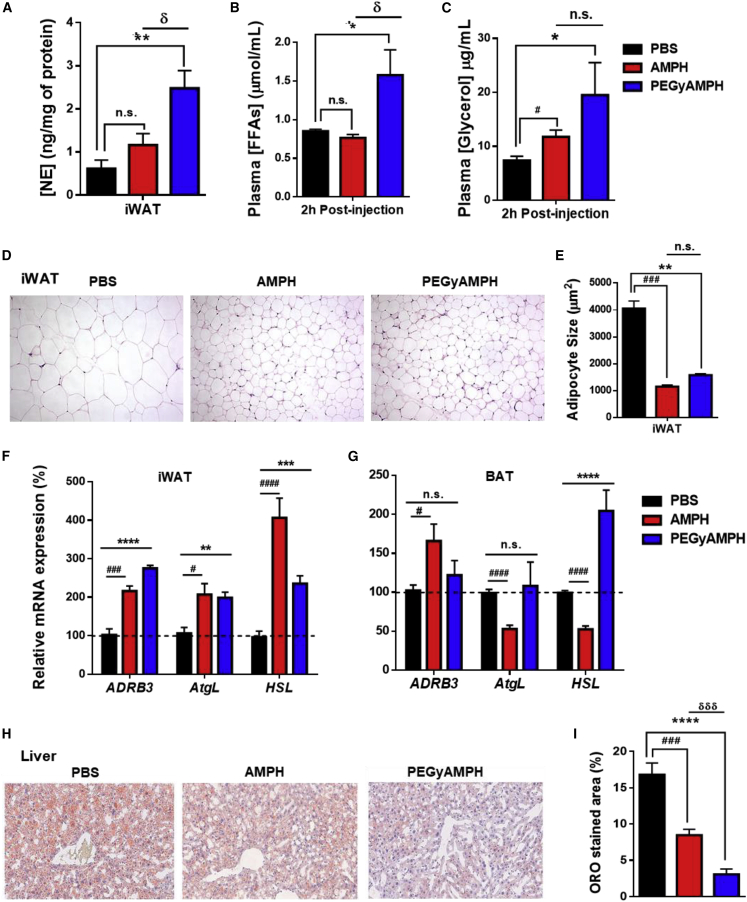
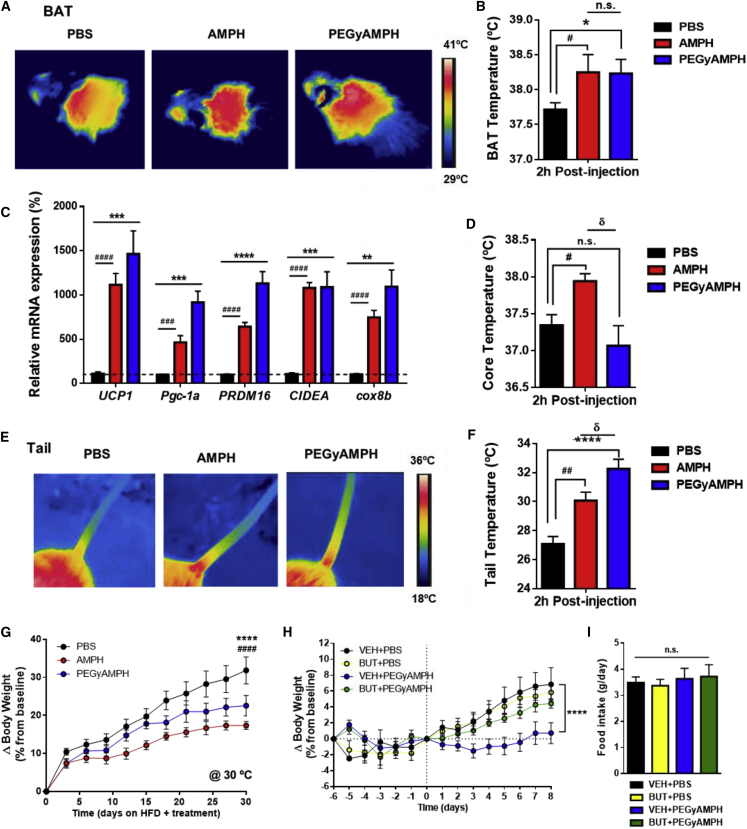
Anti-obesity drugs in the amphetamine (AMPH) class act in the brain to reduce appetite and increase locomotion. They are also characterized by adverse cardiovascular effects with origin that, despite absence of any in vivo evidence, is attributed to a direct sympathomimetic action in the heart. Here, we show that the cardiac side effects of AMPH originate from the brain and can be circumvented by PEGylation (PEGyAMPH) to exclude its central action. PEGyAMPH does not enter the brain and facilitates SNS activity via theβ2-adrenoceptor, protecting mice against obesity by increasing lipolysis and thermogenesis, coupled to higher heat dissipation, which acts as an energy sink to increase energy expenditure without altering food intake or locomotor activity. Thus, we provide proof-of-principle for a novel class of exclusively peripheral anti-obesity sympathofacilitators that are devoid of any cardiovascular and brain-related side effects.

Keywords: amphetamine; heat dissipation; lipolysis; obesity; sympathetic-nervous-system; sympathofacilitators; sympathomimetics; tachycardia; thermogenesis; thermoregulation.


Conflict of interest statement

Declaration of Interests Authors G.J.L.B. and A.I.D. declare to be inventors on the patent application WO2019/076675 A1 that incorporates discoveries described in this manuscript. The remaining authors declare no competing interests.

Figures

None
Graphical abstract
Figure 1
Figure 1
Amphetamine (AMPH) Facilitates SNS Activation, Which Is Required for the Anti-obesity Effect, Independently of Hypophagia and Hyperkinesia (A) Cultured GCaMP3+ SCG neurons immuno-labeled for tyrosine hydroxylase (TH). (B) Representative traces of changes in membrane potential and action potential (AP) evoked under current-clamp mode in Vehicle and AMPH-treated SCG neurons. (C) Maximum AP firing frequency and resting membrane potential. (D) Sequence of representative pseudocolor images showing calcium levels ([Ca2+]i) in GCaMP3+ neurons after stimulation with ACh. Changes in fluorescence (ΔF) are expressed as ΔF/F0 = [(Fpost − Frest)/Frest] and represented in pseudocolor scale. (E) Representative ACh-induced [Ca2+]i response tracings. (F) Amplitude of ACh-induced [Ca2+]i transients (n = 8; statistics done using one-way ANOVA, followed by Bonferroni correction). (G) Change in body weight (ΔBW) of control and regionally Symp mice during HFD exposure plus treatment with PBS or AMPH (120 μmol/kg of BW, daily i.p. - n = 10–13. Statistics done using two-way ANOVA). (H) Daily food intake during HFD exposure and respective treatment. (I) Representative tracking of the LA. (J) Total distance traveled in 10 min. (K) NE content in iWAT. (n = 6–12; statistics done using unpaired Student’s t test, with Holm-Sidak correction method). ∗,δ,#p < 0.05; PBS versus AMPH; δcontrol+PBS versus Symp+PBS; #control+AMPH versus Symp+AMPH. Data presented as mean ± SEM. See also Figure S1.
Figure 2
Figure 2
Pegylated Amphetamine (PEGyAMPH) Does Not Enter the Brain and Does Not Induce Hypophagia or Hyperkinesia (A) Representative scheme of the AMPH’s PEGylation method to produce PEGyAMPH. (B) Representative FT-ICR mass spectra of brain extracts from C57BL/6 mice 30 min post-injection with AMPH or PEGyAMPH (120 μmol/kg of BW, i.p.). (C) Brain levels of AMPH and PEGyAMPH. (D) 24 h FI post-injection with PBS, AMPH, or PEGyAMPH (normal diet). (E) Total distance traveled in 15 min. (F) Representative tracking of LA (n = 4–10; statistics done using unpaired Student’s t test, with Holm-Sidak correction method). ∗,#p < 0.05; PBS versus PEGyAMPH; #PBS versus AMPH. Data presented as mean ± SEM. See also Figure S2.
Figure 3
Figure 3
PEGyAMPH Facilitates SNS Activation via ADRB2 Signaling (A) Representative traces of changes in membrane potential and AP evoked under current-clamp mode in Vehicle, AMPH and PEGyAMPH-treated SCG neurons. (B) Maximum AP firing frequency. (C) Sequence of representative pseudocolor images of [Ca2+]i changes after stimulation with ACh. (D) Representative ACh-induced [Ca2+]i response tracings in Vehicle, AMPH and PEGyAMPH-treated GCaMP3+ neurons (left), and Amplitude of ACh-induced [Ca2+]i transients (right). (n = 3-4; statistics done using one-way ANOVA followed by Bonferroni correction). (E) Increase in NE content of iWAT (left) and liver (right) of C57BL/6 mice post-treatment with PEGyAMPH (60, 120, or 240 μmol/kg of BW, i.p. injections). (n = 8–12; statistics done using unpaired Student’s t test, with Holm-Sidak correction method). (F) 3D structure of ADRB2 in complex with AMPH and PEGyAMPH. Left: Minimized structure for ADRB2-AMPH complex, and Right: Minimized structure for ADRB2-PEGyAMPH complex, both showing the most relevant interactions between ligand and receptor. ADBR2 is represented as white ribbons and the carbon atoms of the residues of this receptor that are interacting with the ligands are in yellow. The carbon atoms of the ligands are in green. (G) Representative ACh-induced [Ca2+]i response (left), and Amplitude of ACh-induced [Ca2+]i transients in GCaMP3+ neurons after pharmacological treatment with PEGyAMPH, in the absence or presence of butoxamine (BUT) (right). (n = 3–4; statistics done using one-way ANOVA followed by Bonferroni correction). ∗,#p < 0.05; PBS versus PEGyAMPH; #PEGyAMPH versus PEGyAMPH+BUT. Data presented as mean ± SEM. See also Figure S3.
Figure 4
Figure 4
PEGyAMPH, Unlike AMPH, Does Not Affect Cardiovascular Function, Unless Delivered Centrally (A) Mean blood pressure (MBP). (B) Systolic blood pressure (SBP) and diastolic blood pressure (DBP). (C) Heart rate of C57BL/6 mice, recorded post-injection with PBS, AMPH, or PEGyAMPH (120 μmol/kg of BW for both drugs, i.p.) using a non-invasive Volume Pressure Recording (VPR) tail-cuff system. (D–G) Measurements taken post-i.c.v. injection of PBS, AMPH, or PEGyAMPH (60 nmol, bolus, per animal). (D) Change in heart rate recorded using a CollarClip Sensor (CC-Sensor) for pulse oximetry. (E) 24-h FI of i.c.v.-injected mice. (F) Total distance traveled in 10 min. (G) Representative trackings post-i.c.v. (n = 8–12; statistics done using unpaired Student’s t test, with Holm-Sidak correction method). ∗,#,δp < 0.05; PBS versus PEGyAMPH; #PBS versus AMPH; δPEGyAMPH versus AMPH. Data presented as mean ± SEM. See also Figure S4.
Figure 5
Figure 5
PEGyAMPH Protects Mice from DIO and Increases EE without Affecting Food Intake (A and B) BW (A) and ΔBW (B) of C57BL/6 mice during HFD exposure and treatment with PBS, AMPH, or PEGyAMPH (120 μmol/kg of BW for both drugs, daily i.p.). (C) Average FI.(D) Daily LA, quantified in beam-break counts. (E) EE, normalized to total BW. (F) Daily fecal output (left) and fecal TGs content (right). (G) Plasma TGs levels. (H and I) BW (H) and ΔBW (I) of DIO mice during treatment. (n = 8–15; statistics done using two-way ANOVA for the BW measurement over time, and using unpaired Student’s t tests, with Holm-Sidak correction method, for the other assays). ∗,#,δp < 0.05; PBS versus PEGyAMPH; #PBS versus AMPH; δPEGyAMPH versus AMPH. Data presented as mean ± SEM. See also Figure S5.
Figure 6
Figure 6
PEGyAMPH Elevates Adipose Tissue Lipolysis and Peripheral Lipid Utilization during DIO (A–C) NE content in iWAT after 10 weeks of HFD exposure and respective treatment (A). Plasma levels of FFAs (B) and glycerol (C). (D and E) Representative histology of iWAT stained with H&E (D) and quantification of iWAT adipocyte size (E). (F and G) Lipolytic gene expression in iWAT (F) and in BAT (G) determined by qRT-PCR relative to housekeeping gene Arbp0. (H) Representative histology of liver oro staining. (I) Quantification of oro staining normalized to the total liver area. (n = 5–12; statistics done using unpaired Student’s t test, with Holm-Sidak correction). ∗,#,δp < 0.05; PBS versus PEGyAMPH; #PBS versus AMPH; δPEGyAMPH versus AMPH. Data presented as mean ± SEM. See also Figure S6.
Figure 7
Figure 7
PEGyAMPH Increases Thermogenesis and Heat Dissipation, and it Protects against Obesity via ADRB2 (A) Representative infrared thermography of the BAT area. (B) Quantification of BAT skin temperature post-injection with PBS, AMPH, or PEGyAMPH (120 μmol/kg of BW, i.p.). (C) BAT mRNA levels of thermogenic genes determined by qRT-PCR relative to housekeeping gene Arbp0, after 10 weeks of HFD exposure and treatment. (D) Core body temperature measured with rectal probe. (E) Representative infrared thermography of tail. (F) Quantification of tail temperature measured 0.5 cm from the base. (n = 8–12; statistics done using unpaired Student’s t test, with Holm-Sidak correction). (G) ΔBW of mice exposed to HFD and treatment with PBS, AMPH, or PEGyAMPH under thermoneutral housing conditions. (H and I) ΔBW (H) and daily FI of mice exposed to HFD and treatment with PBS or PEGyAMPH in combination with BUT (16 μmol/kg/day, delivered via osmotic pumps) (I). (n = 10–12; statistics done using two-way ANOVA). ∗,#,δp < 0.05; PBS versus PEGyAMPH; #PBS versus AMPH; δPEGyAMPH versus AMPH. Data presented as mean ± SEM. See also Figure S7.

Comment in

References

    1. Agudelo L.Z., Femenía T., Orhan F., Porsmyr-Palmertz M., Goiny M., Martinez-Redondo V., Correia J.C., Izadi M., Bhat M., Schuppe-Koistinen I. Skeletal muscle PGC-1α1 modulates kynurenine metabolism and mediates resilience to stress-induced depression. Cell. 2014;159:33–45. - PubMed
    1. Arch J.R.S. The contribution of increased thermogenesis to the effect of anorectic drugs on body composition in mice. Am. J. Clin. Nutr. 1981;34:2763–2769. - PubMed
    1. Arch J.R.S. Challenges in β3 -adrenoceptor agonist drug development. Ther. Adv. Endocrinol. Metab. 2011;2:59–64. - PMC - PubMed
    1. Arch J.R.S., Trayhurn P. Detection of thermogenesis in rodents in response to anti-obesity drugs and genetic modification. Front. Physiol. 2013;4:64. - PMC - PubMed
    1. Bartness T.J., Liu Y., Shrestha Y.B., Ryu V. Neural innervation of white adipose tissue and the control of lipolysis. Front. Neuroendocrinol. 2014;35:473–493. - PMC - PubMed

Publication types