. 2020 Jul 7;32(1):44-55.e6.
doi: 10.1016/j.cmet.2020.04.015. Epub 2020 May 12.

Metformin Enhances Autophagy and Normalizes Mitochondrial Function to Alleviate Aging-Associated Inflammation

Affiliations

Metformin Enhances Autophagy and Normalizes Mitochondrial Function to Alleviate Aging-Associated Inflammation

Leena P Bharath et al. Cell Metab. .

Abstract

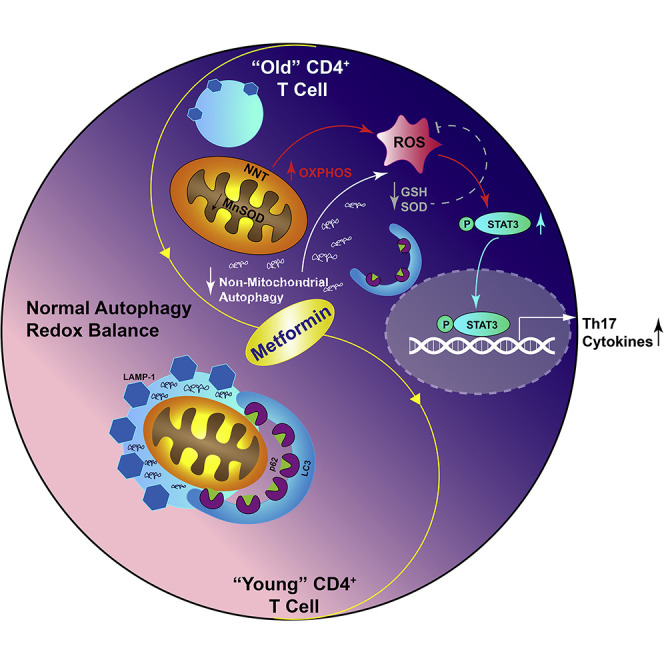
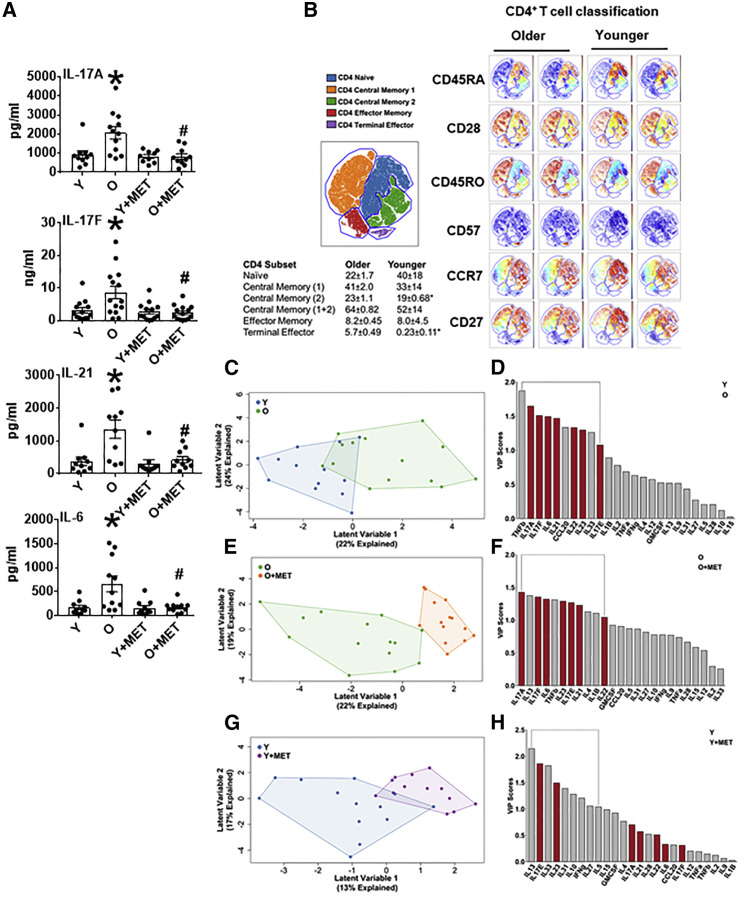
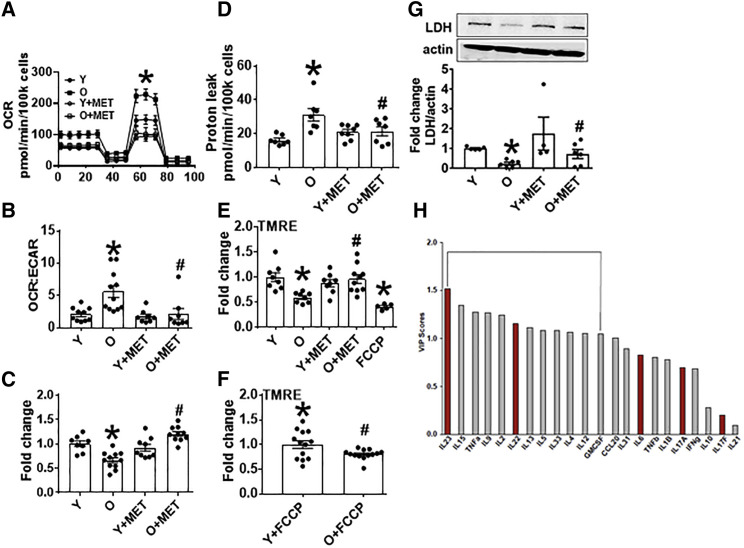
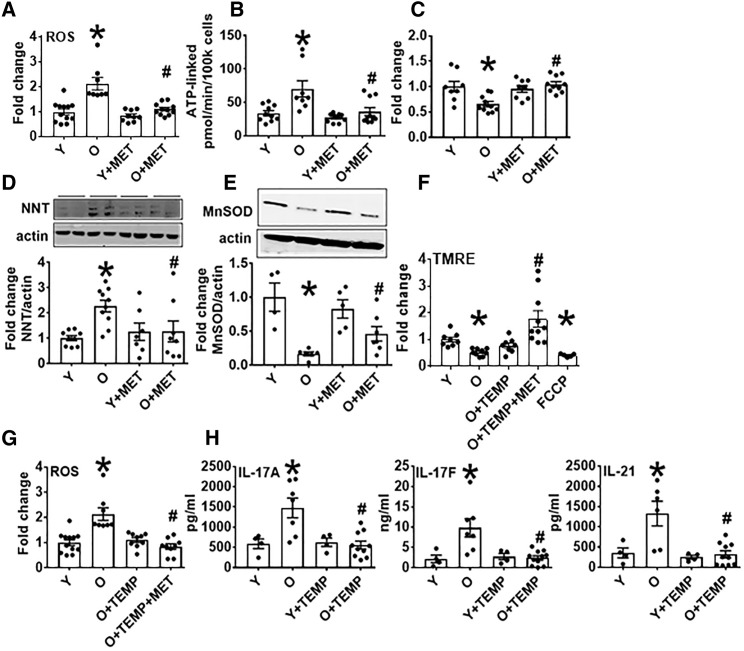
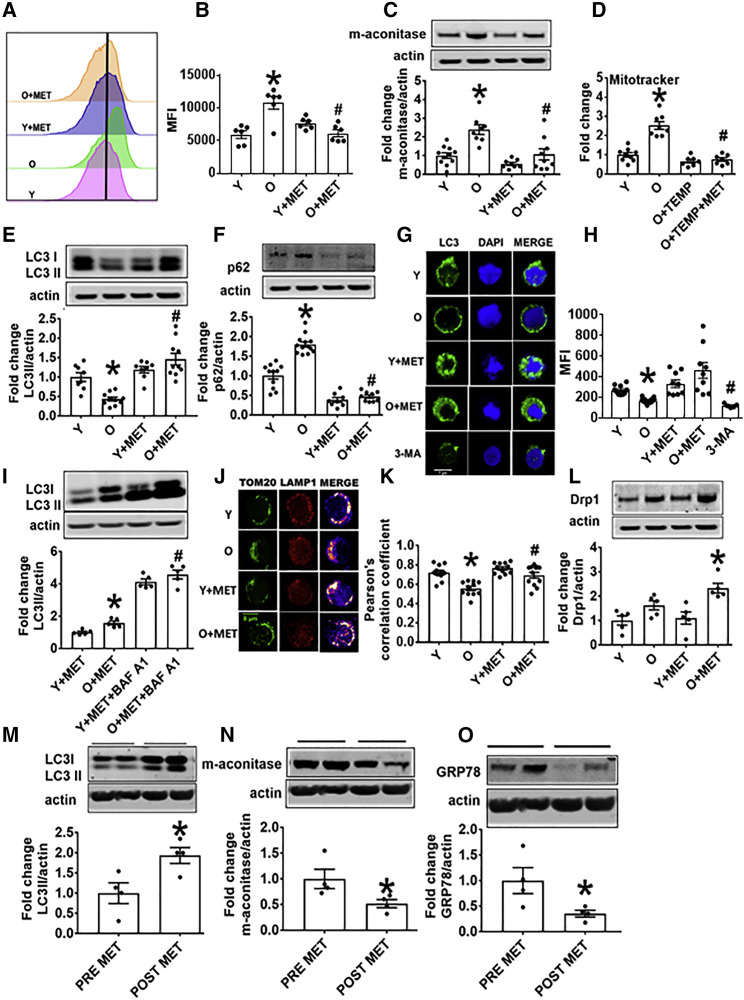
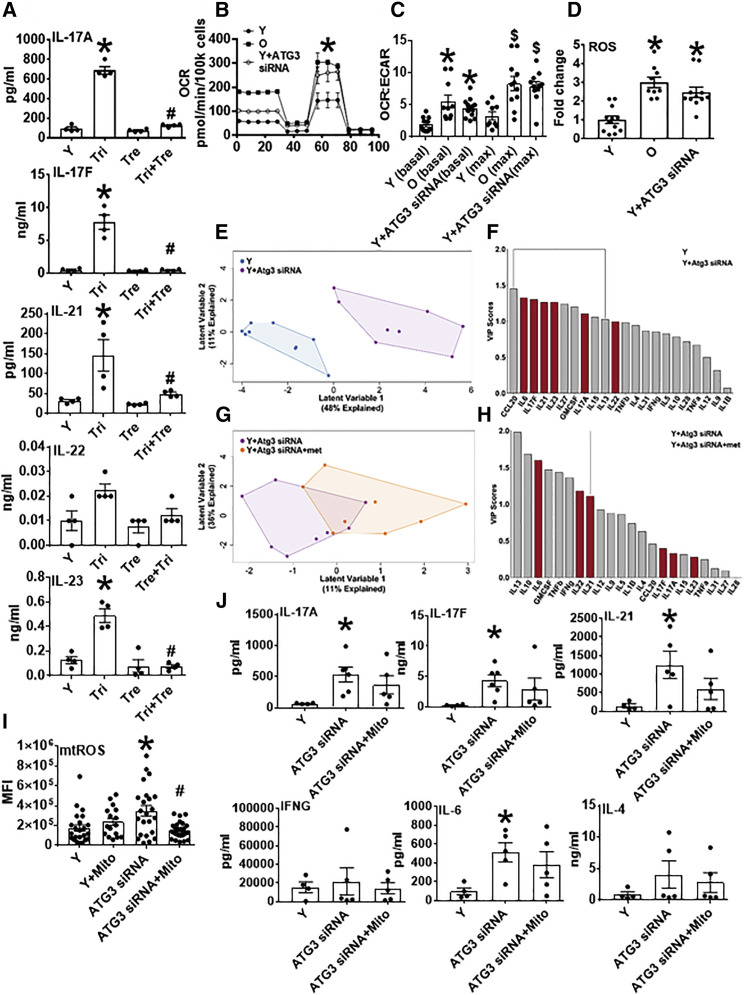
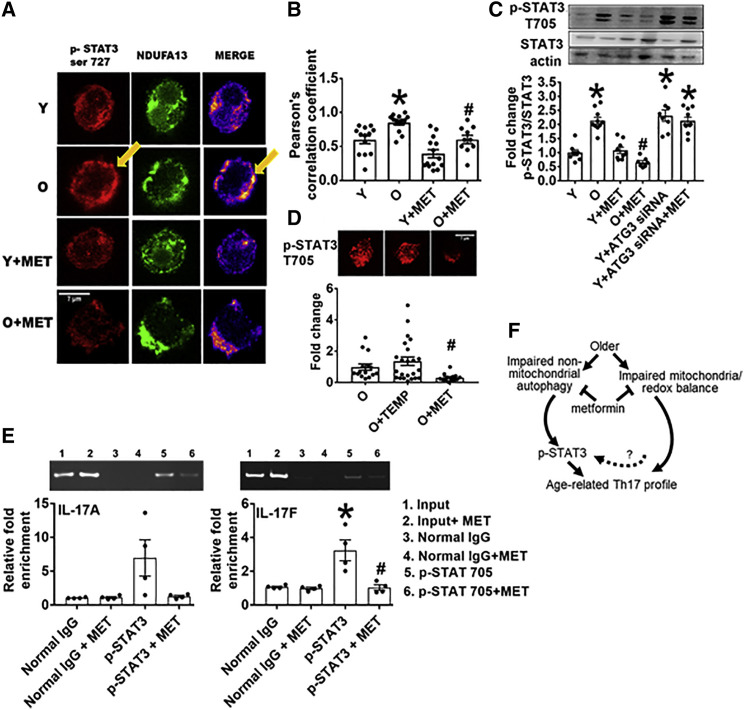
Age is a non-modifiable risk factor for the inflammation that underlies age-associated diseases; thus, anti-inflammaging drugs hold promise for increasing health span. Cytokine profiling and bioinformatic analyses showed that Th17 cytokine production differentiates CD4+ T cells from lean, normoglycemic older and younger subjects, and mimics a diabetes-associated Th17 profile. T cells from older compared to younger subjects also had defects in autophagy and mitochondrial bioenergetics that associate with redox imbalance. Metformin ameliorated the Th17 inflammaging profile by increasing autophagy and improving mitochondrial bioenergetics. By contrast, autophagy-targeting siRNA disrupted redox balance in T cells from young subjects and activated the Th17 profile by activating the Th17 master regulator, STAT3, which in turn bound IL-17A and F promoters. Mitophagy-targeting siRNA failed to activate the Th17 profile. We conclude that metformin improves autophagy and mitochondrial function largely in parallel to ameliorate a newly defined inflammaging profile that echoes inflammation in diabetes.

Keywords: T cells; autophagy; inflammaging; metformin; mitochondria.


Conflict of interest statement

Declaration of Interests The authors declare no competing interests.

Figures

None
Graphical abstract
Figure 1
Figure 1
Metformin Ameliorates an Age-Related Th17 Cytokine Profile Cytokine production was assessed in T cells from BMI-matched normoglycemic Y and O subjects following 40 h αCD3/αCD28 stimulation ± 100 μm metformin (MET). (A) Concentrations of IL-17A, IL-17F, IL-21, and IL-6 as indicated. Data are mean ± SEM. n = 10–14. For all panels, each n (i.e., each dot) represents T cells isolated from one subject. p < 0.05 versus Y, #p < 0.05 versus O by ANOVA. (B) Left: tSNE grouping of CD4+ T cell subsets based on markers shown in Figure S1E identified 5 subsets. Right: two representative analyses from subjects in age groups as indicated. Table shows frequencies (average and SD) of CD4+ T cell subsets in samples from Y or O subjects. p < 0.05 by two-tailed t test. (C, E, and G) PLSDA shows compendium measures of “inflammation” generated by combining all cytokines measured by (C) Y (blue) or O (green) CD4+ T cells, (E) CD4+ cells from O subjects stimulated in the presence (orange) or absence (green) of metformin (100 μM), or (G) CD4+ cells from Y subjects stimulated in the presence (purple) or absence (blue) of metformin (100 μM). (D, F, and H) Bar graphs show VIP scores, which rank cytokines as most (leftmost) or least (rightmost) important for differentiating overall cytokine profiles between the groups indicated in key. A VIP score >1 (bracket) is considered important for differentiating inflammatory profiles between groups. All VIP cytokines indicated also differed in post hoc analyses (p < 0.05). n = 10–14. See also Figure S1.
Figure 2
Figure 2
Metformin Ameliorates OXPHOS and Promotes Non-mitochondrial Glycolysis in CD4+ T Cells from O Subjects (A) OCR in a mito stress test assayed by XF of CD4+ T cells following 40 h αCD3/αCD28 stimulation ± 100 μm MET as indicated. (B) OCR:ECAR ratio calculated by profiles in (A) and Figure S2C. (C) Relative lactate production after 40-h stimulation per (A). (D) Proton leak calculated from (A) data. (E) MMP measured with TMRE after stimulation per (A). #p = 0.055 versus O. (F) MMP measured following addition of the mitochondrial uncoupler fluoro-carbonyl cyanide phenylhydrazone (FCCP) to unstimulated CD4+ T cells from Y or O subjects. n = 8–10 (A–E) and 12–13 (F). (G) LDH quantification on western blots. Top: representative blot and bottom averages n = 4–6 of group indicated beneath. p < 0.05 versus Y, #p < 0.05 versus O. Data shown are mean ± SEM. (H) VIP scores, which rank cytokines as most (leftmost) or least (rightmost) important for differentiating overall cytokine profiles between CD4+ T cells from young subjects stimulated ± the LDH inhibitor OA in an orthagonalized model. A VIP score >1 (bracket) is considered important for differentiating inflammatory profiles between groups. All VIP cytokines indicated also differed in post hoc analyses (p < 0.05). Fold change is compared to Y or Y + FCCP. See also Figure S2.
Figure 3
Figure 3
ROS Amelioration Prevents Th17 Profile Production by CD4+ T Cells from O Subjects (A–E) ROS production (A), ATP-linked respiration (B), GSH (C), NNT (D), or MnSOD expression (E) by CD4+ cells stimulated for 40 h with αCD3/αCD28 ± 100 μm MET. #p = 0.062 versus O. (F and G) Outcomes following stimulation the ROS scavenger Tempol ± 100 μM MET as indicated. (H) Production of Th17 cytokines by CD4+ cells stimulated for 40 h with αCD3/αCD28 ± tempol. n = 7–10 (A–D, F, and G), 4–10 (H), and 4–7 (E); p < 0.05 versus Y, #p < 0.05 versus O. Data are represented as mean ± SEM. Fold change is compared with Y. See also Figure S3.
Figure 4
Figure 4
Metformin Promotes Mitochondrial Turnover and Mitophagy in CD4+ T Cells from O Subjects (A and B) MitoTracker green fluorescence in CD4+ T cells from O and Y subjects assessed by flow cytometry. n = 6. (C) Mitochondrial matrix protein m-aconitase in CD4+ T cells from O and Y subjects as measured on western blots. n = 7–10. (D) Mitochondrial mass assessed via Mitotracker green fluorescence in the presence of Tempol (TEMP) ± MET as indicated. n = 7–8. (E and F) Expression of the autophagy proteins LC3II (E) or p62 (F) in cells, measured on western blots. n = 8–10. (G and H) Autophagosome formation as indicated by puncta and quantitated by confocal microscopy. 3-MA is an inhibitor or autophagy thus serves as a negative control. n = 3. (I) LC3II expression in CD4+ T cells as indicated, following treatment with metformin + BAF A1 as a positive control for autophagy. n = 5. (J and K) Localization in representative CD4+ cells (J), and quantitation of co-localization of the mitochondrial protein TOM20 and the lysosomal protein (LAMP1) ± metformin as indicated (K). n = 4 with multiple dots from some N’s shown. For both confocal analyses (G, H, J, and K), 3 cells/field and 3 fields/slide were imaged using 63× oil immersion in Zeiss microscope. The average fluorescence/field is reported. (L) Expression of mitochondrial fission protein Drp 1 on western blots. n = 5. (M–O) Indicators of autophagy (M) LC3II, (N) m-aconitase, or (O) GRP78 quantified in CD4+ T cells from pre-diabetes subjects sampled before or after 3 months’ administration of metformin (1,000 mg/day; n = 4). p < 0.05 versus Y or pre-met, #p < 0.05 versus O. Data are represented as mean ± SEM. Fold change is compared to either Y, Y + MET, or PRE-MET.
Figure 5
Figure 5
Genetic Inhibition of Autophagy Recapitulates Respiratory Profiles of Cells from O Subjects (A) Th17-associated cytokine production by CD4+ T cells from Y subjects, with cells stimulated 40 h αCD3/αCD28 in the presence of trimetazidine, a fatty acid oxidation inhibitor; alone; or in combination with trehalose, an autophagy activator. n = 4. p < 0.05 versus Y by one-way ANOVA. (B) Mito stress test XF profiles from 40 h αCD3/αCD28-stimulated CD4+ T cells from Y or O subjects as indicated. Autophagy dysfunction was induced in cells from Y subjects using siRNA-mediated ATG3 knockdown. n = 8–12. (C and D) OCR:ECAR ratio (C) and ROS generation (D) measured by DCFDA in CD4+ T cells manipulated as indicated. n = 8–12. p < 0.05 versus Y by SHORE (Nicholas et al., 2017) (B) or one-way ANOVA (C and D). p < 0.05 versus Y (basal), $p < 0.05 versus Y (max) (C). (E and G) PLSDA analysis differentiated combinatorial “inflammation” of CD4+ cells from Y subjects (blue), Y with siRNA-induced autophagy dysfunction (purple), or autophagy dysfunction and metformin (met; orange). n = 8–9. (F and H) VIP scores rank cytokines important for differentiating data clouds in (E) and (G). Comparison of Figure 5F with 1D highlights profiles that differentiate Y from either O or Y + ATG3 siRNA conditions. n = 8–9. (I) Mitochondrial ROS generation measured by MitoSOX in CD4+ T cells manipulated as indicated; 3 cells/field and 4 fields/slide were imaged using 40× in Zeiss microscope. The average fluorescence/field is reported. n = 4–5. (J) Cytokine production by CD4+ T cells from young subjects, with cells stimulated 40 h αCD3/αCD28 after autophagy inhibition and in the presence of mitoTEMPO, a mitochondrial ROS-specific scavenger (1 μM, added 3 h post αCD3/αCD28 stimulation). n = 5–6. (A, C, D, I, and J) Data show mean ± SEM. Fold change is compared with Y. See also Figures S4 and S5.
Figure 6
Figure 6
Aging Promotes STAT3 Activation, Mitochondrial Localization, and IL17A/F Promoter Binding (A and B) Quantification of STAT3 ser727 and the mitochondrial complex 1 subunit NDUFA13 localization in CD4+ T cells stimulated for 40 h with αCD3/αCD28 ± metformin as indicated. n = 4 with multiple field readings shown per N. (C) Phospho (p)-STAT3 T705 expression assayed on western blots as indicated on x axis. n = 6–8. (D) p-STAT3 T705 expression relative to total STAT3 in O cells in the presence of TEMP or MET. n = 4–5. p < 0.05 versus Y or control siRNA or #p < 0.05 versus O. Fold change is compared with Y or O. (A and D) 3 cells/field and 3–5 fields/slide were imaged using 63× oil immersion in Zeiss microscope. Average fluorescence/field is reported. (E) Chromatin immunoprecipitation assay showing fold-enrichment of p-STAT3 705 on (left) IL-17A or (right) IL-17F promoters. n = 4. All bar graphs show mean ± SEM. (F) Model for parallel metformin-sensitive pathways that drive T cell inflammaging. Activated T cells from O subjects displayed blunted autophagy, which was largely independent of changes in mitochondrial bioenergetics/excess ROS that promote STAT3-mediated activation of a CD4+ T cell inflammaging profile.

Comment in

  • CD4+ T Cells at the Center of Inflammaging.
    Kroemer G, Zitvogel L. Kroemer G, et al. Cell Metab. 2020 Jul 7;32(1):4-5. doi: 10.1016/j.cmet.2020.04.016. Epub 2020 May 12. Cell Metab. 2020. PMID: 32402265 Free PMC article.
  • Next steps in mechanisms of inflammaging.
    Bharath LP, Nikolajczyk BS. Bharath LP, et al. Autophagy. 2020 Dec;16(12):2285-2286. doi: 10.1080/15548627.2020.1822089. Epub 2020 Sep 22. Autophagy. 2020. PMID: 32960694 Free PMC article.

Similar articles

Cited by

References

    1. Abusleme L., Moutsopoulos N.M. IL-17: overview and role in oral immunity and microbiome. Oral Dis. 2017;23:854–865. - PMC - PubMed
    1. Almeida L., Lochner M., Berod L., Sparwasser T. Metabolic pathways in T cell activation and lineage differentiation. Semin. Immunol. 2016;28:514–524. - PubMed
    1. Alpert A., Pickman Y., Leipold M., Rosenberg-Hasson Y., Ji X., Gaujoux R., Rabani H., Starosvetsky E., Kveler K., Schaffert S. A clinically meaningful metric of immune age derived from high-dimensional longitudinal monitoring. Nat. Med. 2019;25:487–495. - PMC - PubMed
    1. Bektas A., Schurman S.H., Gonzalez-Freire M., Dunn C.A., Singh A.K., Macian F., Cuervo A.M., Sen R., Ferrucci L. Age-associated changes in human CD4+ T cells point to mitochondrial dysfunction consequent to impaired autophagy. Aging (Albany NY) 2019;11:9234–9263. - PMC - PubMed
    1. Belkina A.C., Ciccolella C.O., Anno R., Halpert R., Spidlen J., Snyder-Cappione J.E. Automated optimized parameters for T-distributed stochastic neighbor embedding improve visualization and analysis of large datasets. Nat. Commun. 2019;10:5415. - PMC - PubMed

Publication types